| Param | Original file | Final file |
|---|---|---|
| Filename | modeM0/AS1T04_043T01_9000004648_31882cztM0_level2.evt | modeM0/AS1T04_043T01_9000004648_31882cztM0_level2_quad_clean.evt |
| Size (bytes) | 571,487,040 | 75,444,480 |
| Size | 545.0 MB | 71.9 MB |
| Events in quadrant A | 3,314,900 | 460,590 |
| Events in quadrant B | 5,677,841 | 456,354 |
| Events in quadrant C | 3,761,083 | 445,038 |
| Events in quadrant D | 4,080,035 | 434,989 |
| Mode M0 | |||
|---|---|---|---|
| Quadrant | BADHDUFLAG | Total packets | Discarded packets |
| A | 0 | 14210 | 2 |
| B | 0 | 22060 | 1 |
| C | 0 | 15511 | 1 |
| D | 0 | 16815 | 1 |
| Mode M9 | |||
|---|---|---|---|
| Quadrant | BADHDUFLAG | Total packets | Discarded packets |
| A | 0 | 7 | 0 |
| B | 0 | 7 | 0 |
| C | 0 | 7 | 0 |
| D | 0 | 7 | 0 |
| Mode SS | |||
|---|---|---|---|
| Quadrant | BADHDUFLAG | Total packets | Discarded packets |
| A | 0 | 142 | 0 |
| B | 0 | 142 | 0 |
| C | 0 | 142 | 0 |
| D | 0 | 142 | 0 |
| Quadrant | Total seconds | Saturated seconds | Saturation percentage |
|---|---|---|---|
| A | 6997 | 37 | 0.528798% |
| B | 6997 | 134 | 1.915106% |
| C | 6997 | 108 | 1.543519% |
| D | 6997 | 90 | 1.286266% |
Noise dominated data is calculated using 1-second bins in cleaned event files. If a bin has >2000 counts, and if more than 50% of those come from <1% of pixels, then it is considered to be noise-dominated and hence unusable.
| Quadrant | # 1 sec bins | Bins with >0 counts | Bins with >2000 counts | High rate bins dominated by noise | Noise dominated (total time) | Noise dominated (detector-on time) | Marked lightcurve |
|---|---|---|---|---|---|---|---|
| A | 7702 | 6997 | 0 | 0 | 0.00% | 0.00% | 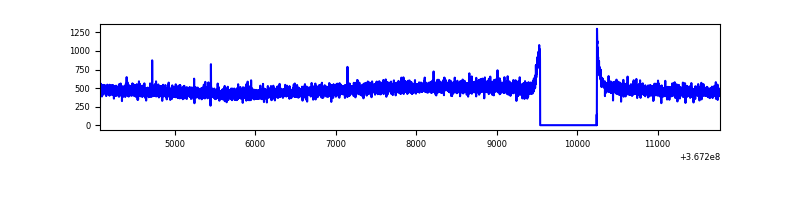 |
| B | 7702 | 6997 | 16 | 16 | 0.21% | 0.23% | 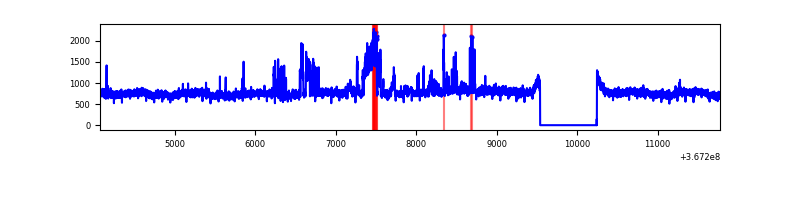 |
| C | 7702 | 6997 | 7 | 7 | 0.09% | 0.10% | 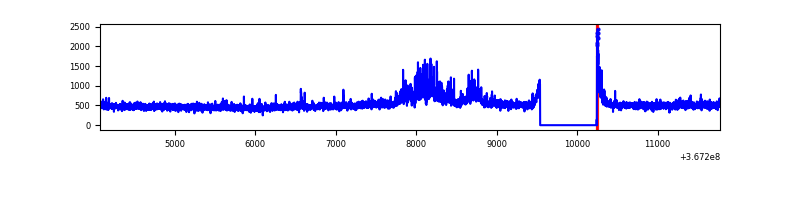 |
| D | 7702 | 6998 | 51 | 51 | 0.66% | 0.73% | 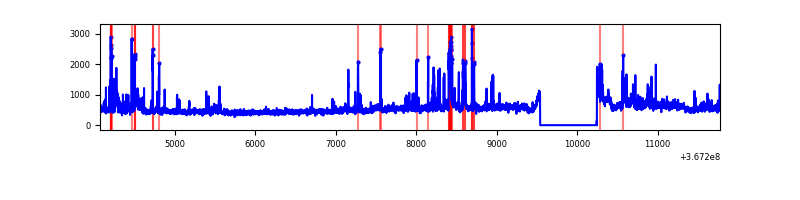 |
Top three noisy pixels from each quadrant. If the there are fewer than three noisy pixels in the level2.evt file, extra rows are filled as -1
| Pixel properties | Quadrant properties | ||||||
|---|---|---|---|---|---|---|---|
| Quadrant | DetID | PixID | Counts | Sigma | Mean | Median | Sigma |
| A | 13 | 6 | 11845 | 63.71 | 855 | 836 | 172.8 |
| A | 13 | 254 | 11353 | 60.86 | 855 | 836 | 172.8 |
| A | 3 | 137 | 9076 | 47.68 | 855 | 836 | 172.8 |
| B | 6 | 159 | 1915907 | 11646.86 | 847 | 825 | 164.4 |
| B | 10 | 245 | 368877 | 2238.36 | 847 | 825 | 164.4 |
| B | 12 | 111 | 20831 | 121.67 | 847 | 825 | 164.4 |
| C | 3 | 233 | 365709 | 1879.92 | 819 | 824 | 194.1 |
| C | 14 | 238 | 136523 | 699.13 | 819 | 824 | 194.1 |
| C | 0 | 10 | 32976 | 165.65 | 819 | 824 | 194.1 |
| D | 8 | 195 | 540038 | 2726.55 | 822 | 803 | 197.8 |
| D | 12 | 218 | 286258 | 1443.35 | 822 | 803 | 197.8 |
| D | 12 | 233 | 46122 | 229.15 | 822 | 803 | 197.8 |
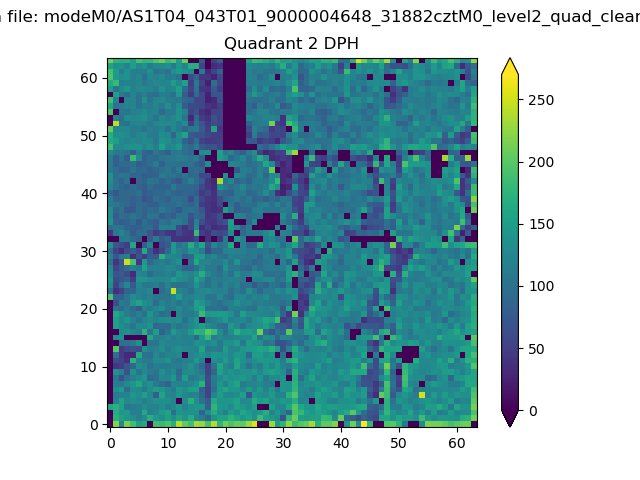
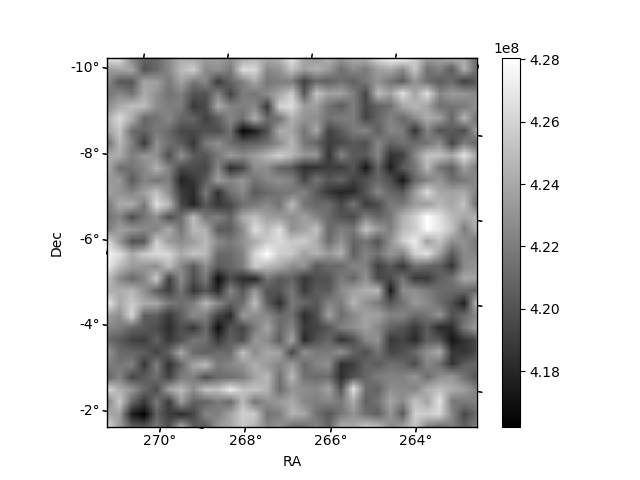
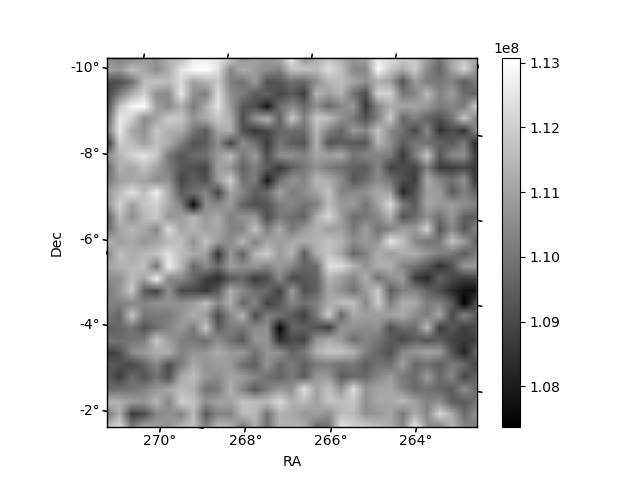
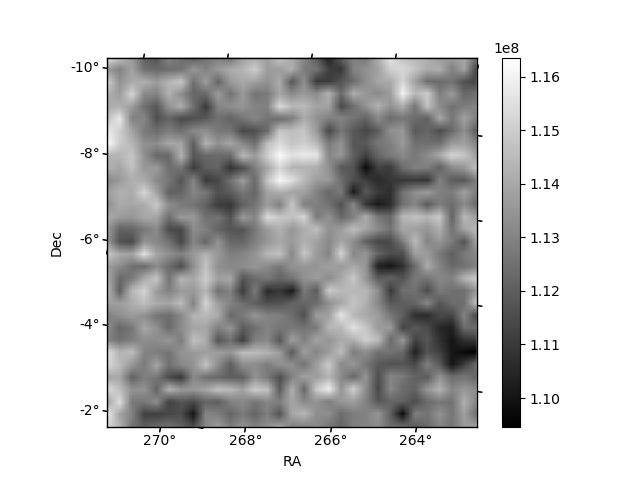
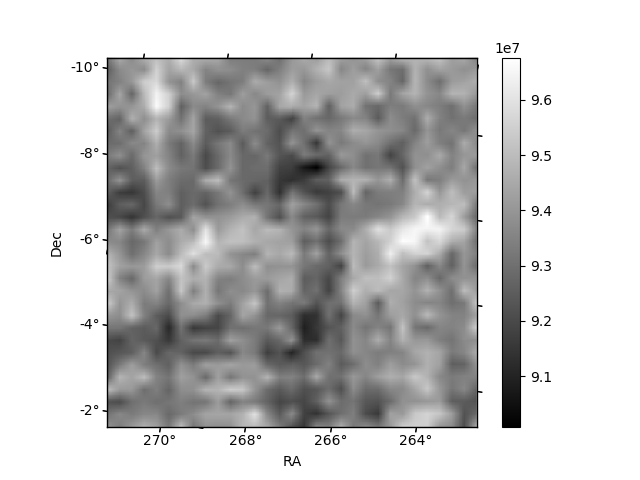
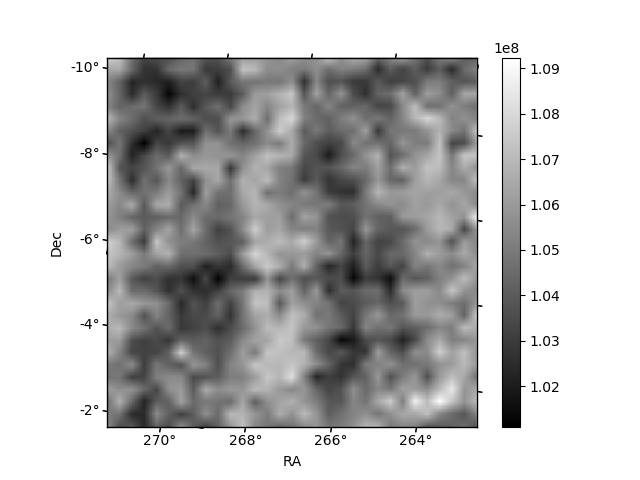
Histogram calculated using DETX and DETY for each event in the final _common_clean file
| Quadrant A | 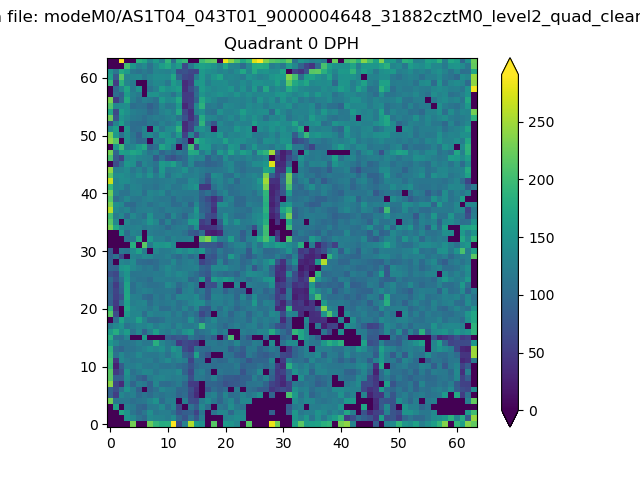 |
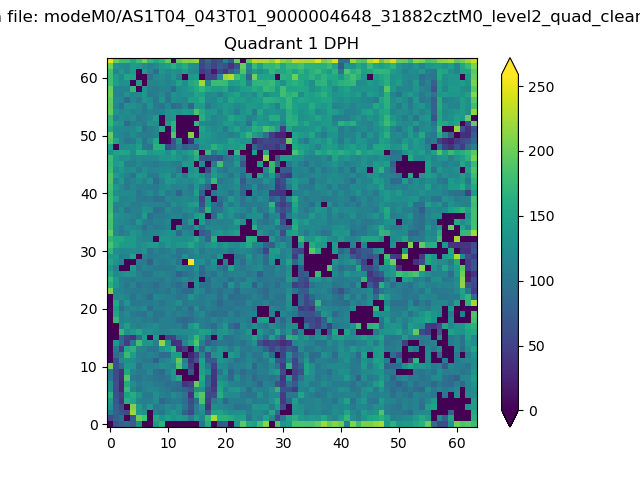 |
Quadrant B |
|---|---|---|---|
| Quadrant D | 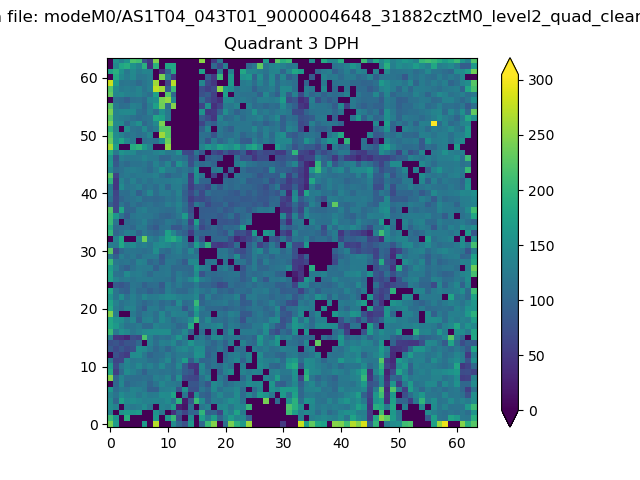 |
 |
Quadrant C |
| Plot type | Count rate plots | Images |
|---|---|---|
| Comparison with Poisson distribution Blue bars denote a histogram of data divided into 1 sec bins. Red curve is a Poisson curve with rate = median count rate of data. |
 |
 |
| Quadrant-wise count rates Data is divided into 100 sec bins |
 |
|
| Module-wise count rates for Quadrant A Data is divided into 100 sec bins |
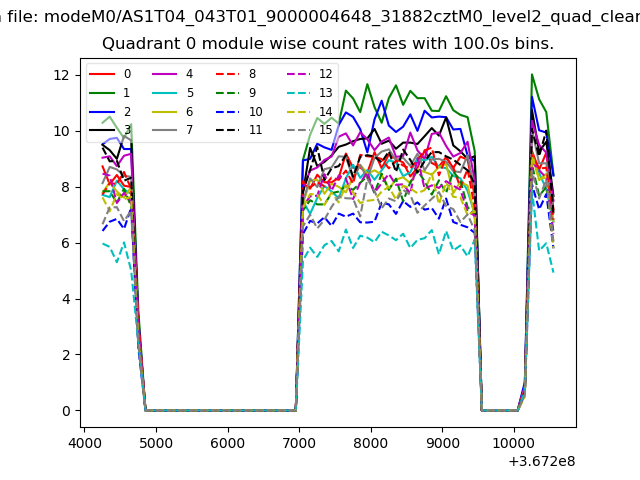 |
 |
| Module-wise count rates for Quadrant B Data is divided into 100 sec bins |
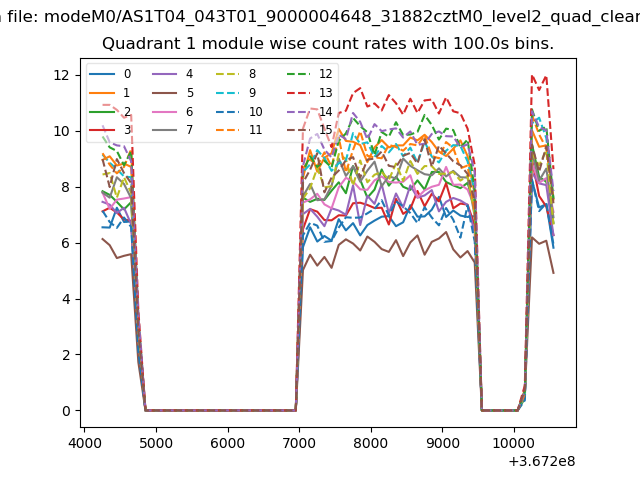 |
 |
| Module-wise count rates for Quadrant C Data is divided into 100 sec bins |
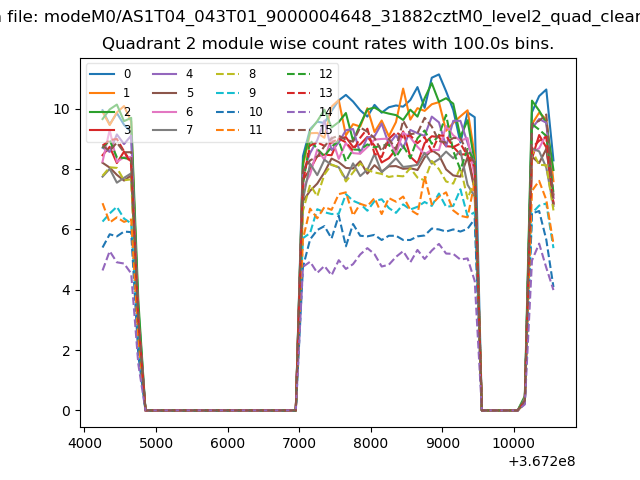 |
 |
| Module-wise count rates for Quadrant D Data is divided into 100 sec bins |
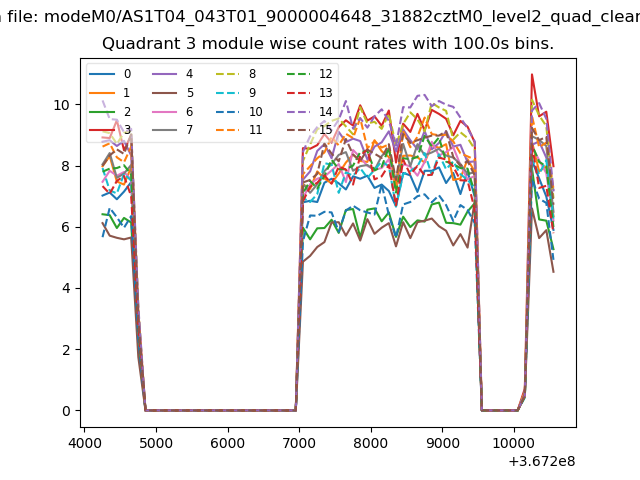 |
 |
| Parameter | Plot |
|---|---|
| CZT HV Monitor | 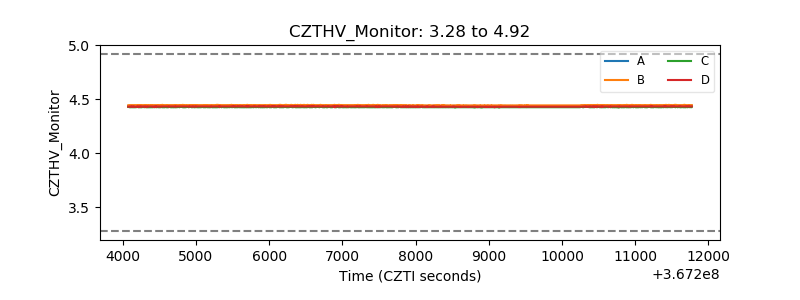 |
| D_VDD | 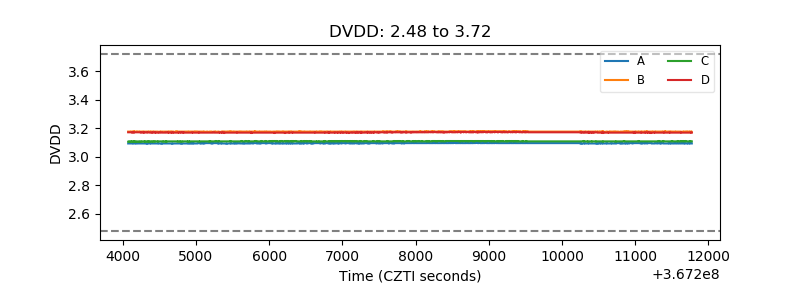 |
| Temperature 1 | 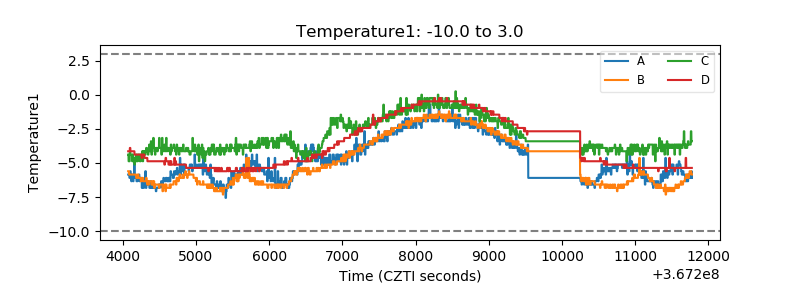 |
| Veto HV Monitor | 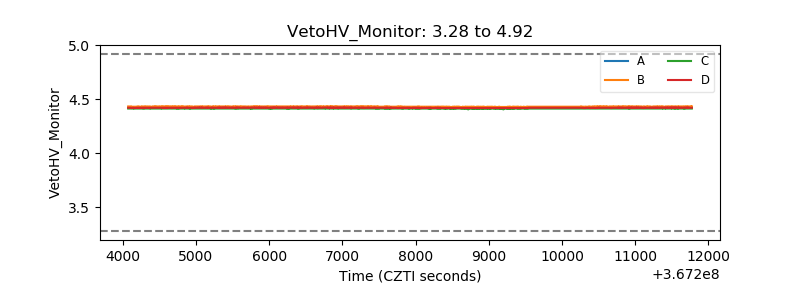 |
| Veto LLD | 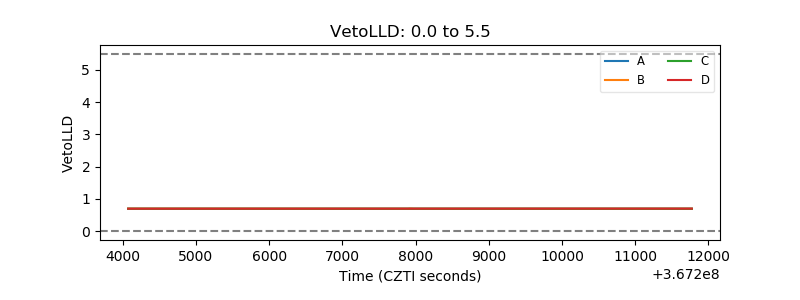 |
| Alpha Counter | 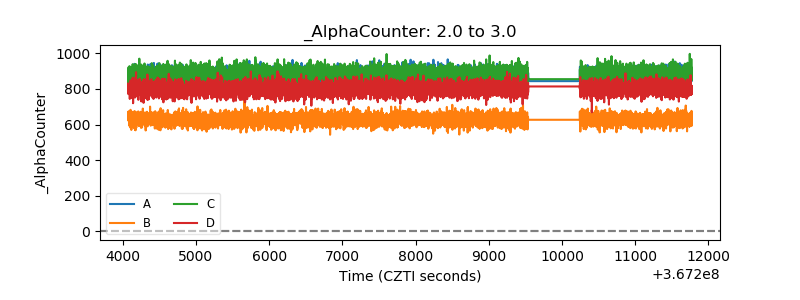 |
| _CPM_Rate |  |
| CZT Counter | 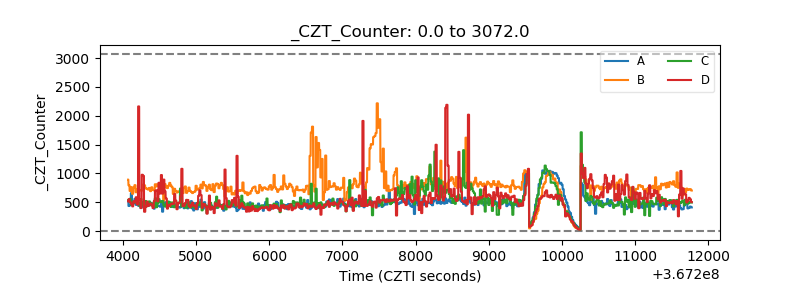 |
| +2.5 Volts monitor |  |
| +5 Volts monitor |  |
| _ROLL_ROT | 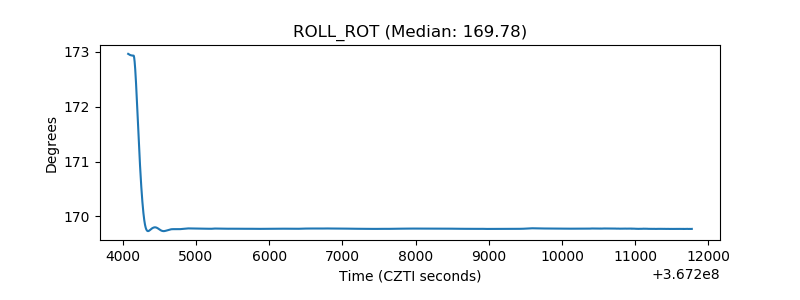 |
| _Roll_DEC | 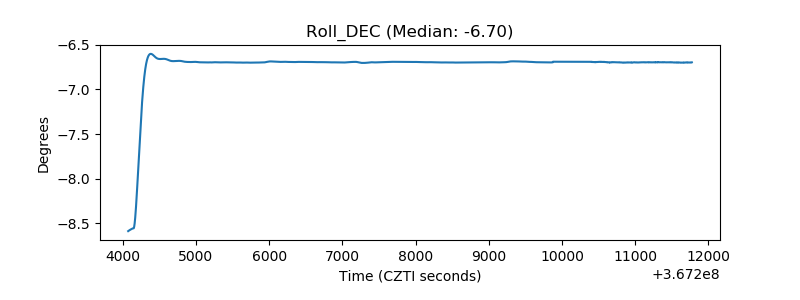 |
| _Roll_RA | 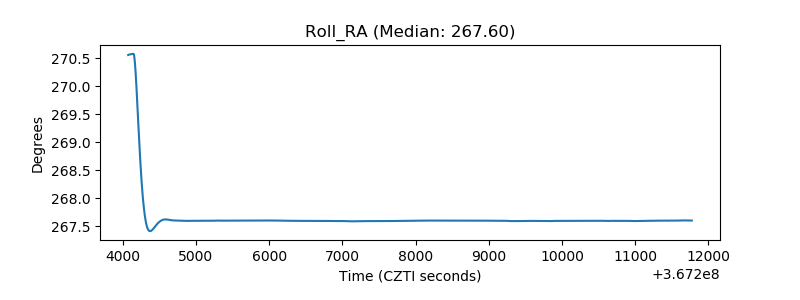 |
| Veto Counter | 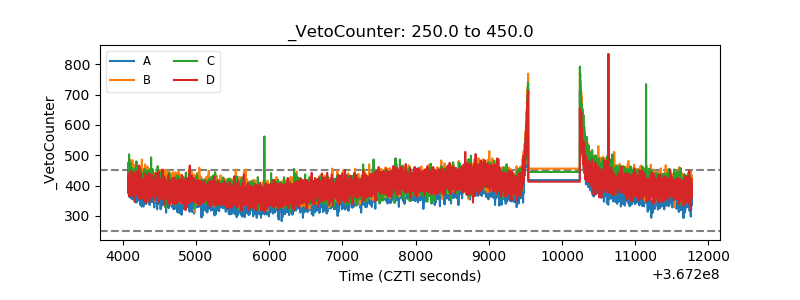 |