| Param | Original file | Final file |
|---|---|---|
| Filename | modeM0/AS1T04_043T01_9000004648_31884cztM0_level2.evt | modeM0/AS1T04_043T01_9000004648_31884cztM0_level2_quad_clean.evt |
| Size (bytes) | 563,653,440 | 69,045,120 |
| Size | 537.5 MB | 65.8 MB |
| Events in quadrant A | 3,395,579 | 416,790 |
| Events in quadrant B | 5,165,084 | 416,913 |
| Events in quadrant C | 3,579,025 | 402,047 |
| Events in quadrant D | 4,477,991 | 388,867 |
| Mode M0 | |||
|---|---|---|---|
| Quadrant | BADHDUFLAG | Total packets | Discarded packets |
| A | 0 | 14024 | 4 |
| B | 0 | 20285 | 2 |
| C | 0 | 14481 | 2 |
| D | 0 | 17804 | 5 |
| Mode M9 | |||
|---|---|---|---|
| Quadrant | BADHDUFLAG | Total packets | Discarded packets |
| A | 0 | 15 | 0 |
| B | 0 | 16 | 0 |
| C | 0 | 16 | 0 |
| D | 0 | 16 | 0 |
| Mode SS | |||
|---|---|---|---|
| Quadrant | BADHDUFLAG | Total packets | Discarded packets |
| A | 0 | 136 | 0 |
| B | 0 | 136 | 0 |
| C | 0 | 136 | 0 |
| D | 0 | 136 | 0 |
| Quadrant | Total seconds | Saturated seconds | Saturation percentage |
|---|---|---|---|
| A | 6682 | 68 | 1.017659% |
| B | 6682 | 141 | 2.110147% |
| C | 6682 | 185 | 2.768632% |
| D | 6680 | 144 | 2.155689% |
Noise dominated data is calculated using 1-second bins in cleaned event files. If a bin has >2000 counts, and if more than 50% of those come from <1% of pixels, then it is considered to be noise-dominated and hence unusable.
| Quadrant | # 1 sec bins | Bins with >0 counts | Bins with >2000 counts | High rate bins dominated by noise | Noise dominated (total time) | Noise dominated (detector-on time) | Marked lightcurve |
|---|---|---|---|---|---|---|---|
| A | 7682 | 6683 | 1 | 1 | 0.01% | 0.01% | 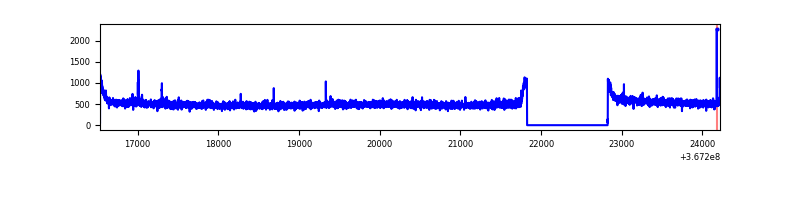 |
| B | 7682 | 6683 | 5 | 5 | 0.07% | 0.07% | 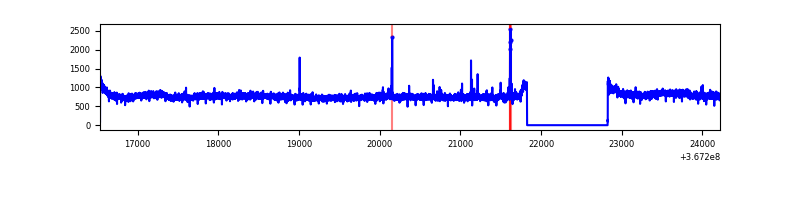 |
| C | 7682 | 6683 | 3 | 3 | 0.04% | 0.04% | 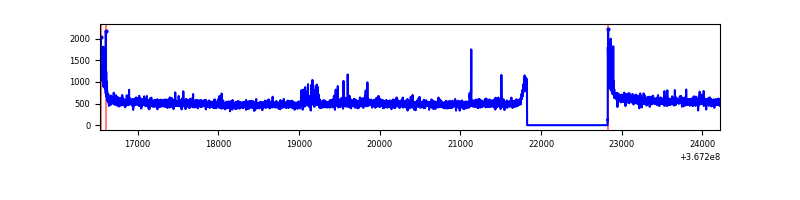 |
| D | 7682 | 6683 | 77 | 77 | 1.00% | 1.15% | 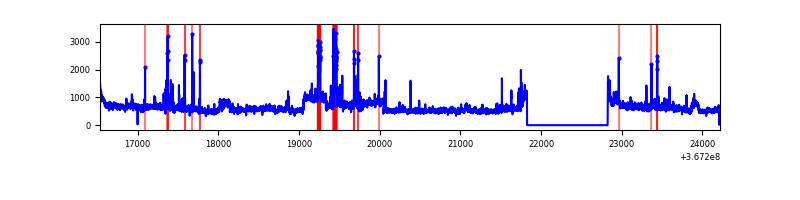 |
Top three noisy pixels from each quadrant. If the there are fewer than three noisy pixels in the level2.evt file, extra rows are filled as -1
| Pixel properties | Quadrant properties | ||||||
|---|---|---|---|---|---|---|---|
| Quadrant | DetID | PixID | Counts | Sigma | Mean | Median | Sigma |
| A | 15 | 174 | 15284 | 83.4 | 871 | 856 | 173.0 |
| A | 13 | 6 | 13250 | 71.64 | 871 | 856 | 173.0 |
| A | 13 | 254 | 11059 | 58.98 | 871 | 856 | 173.0 |
| B | 6 | 159 | 1737643 | 10514.49 | 862 | 840 | 165.2 |
| B | 12 | 111 | 20421 | 118.54 | 862 | 840 | 165.2 |
| B | 11 | 111 | 18834 | 108.93 | 862 | 840 | 165.2 |
| C | 14 | 238 | 147611 | 760.21 | 827 | 833 | 193.1 |
| C | 0 | 10 | 88134 | 452.16 | 827 | 833 | 193.1 |
| C | 3 | 233 | 59827 | 305.55 | 827 | 833 | 193.1 |
| D | 8 | 195 | 1034992 | 5260.05 | 828 | 806 | 196.6 |
| D | 13 | 249 | 196120 | 993.4 | 828 | 806 | 196.6 |
| D | 2 | 250 | 99627 | 502.62 | 828 | 806 | 196.6 |
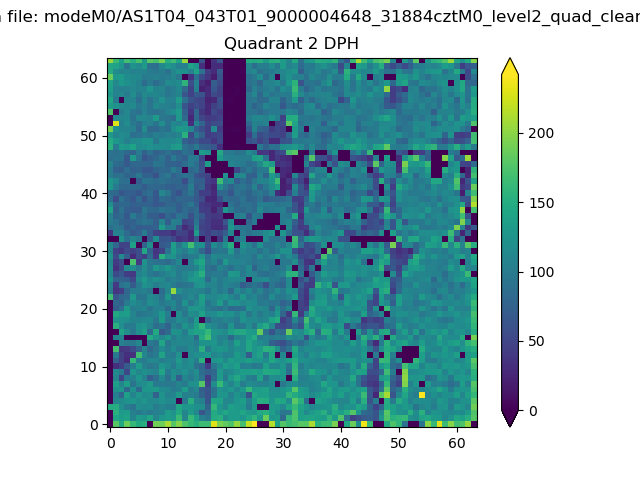
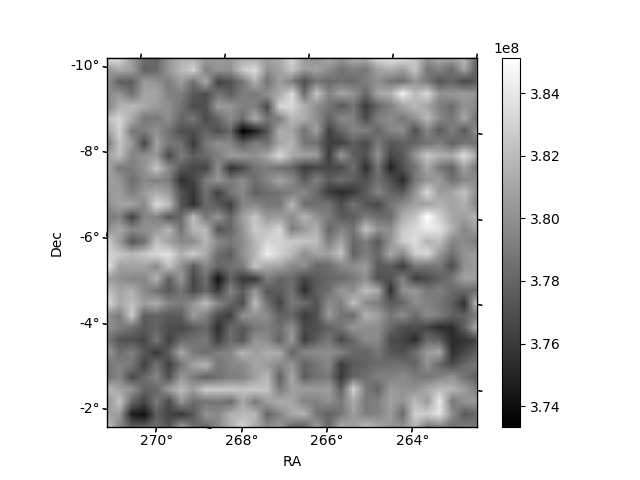
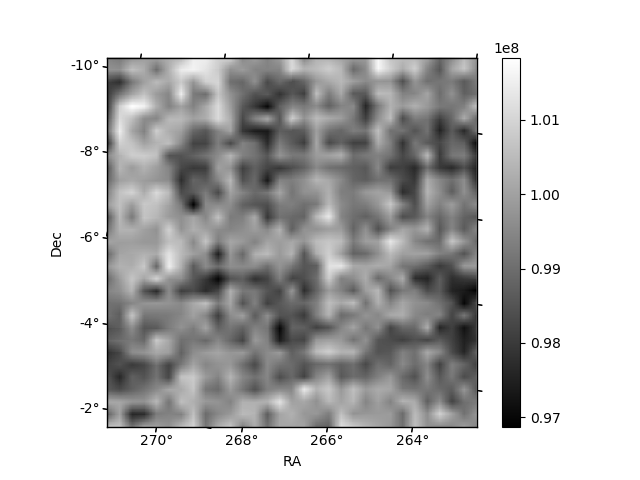
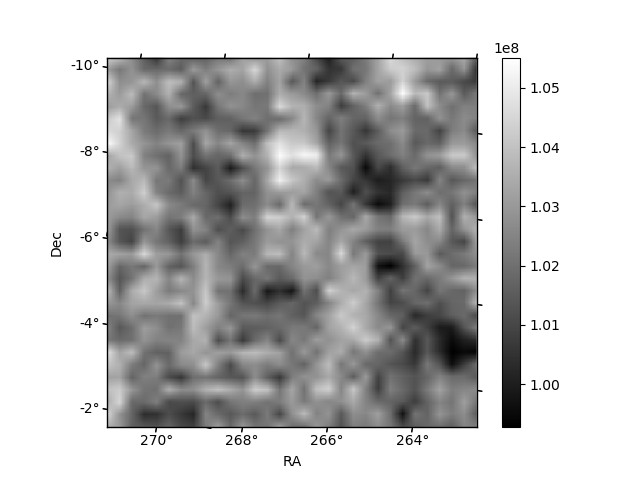
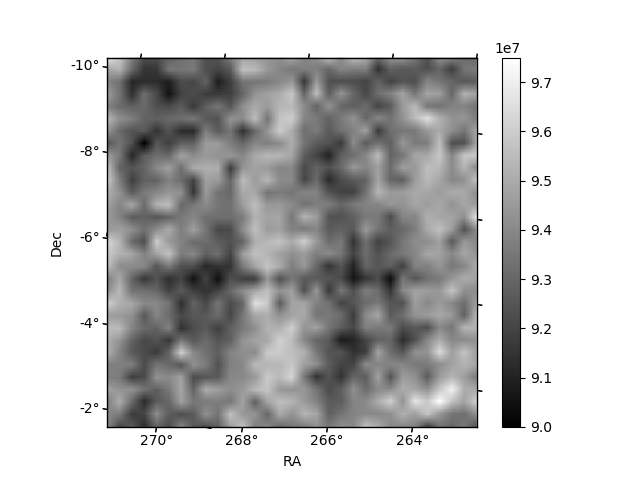
Histogram calculated using DETX and DETY for each event in the final _common_clean file
| Quadrant A | 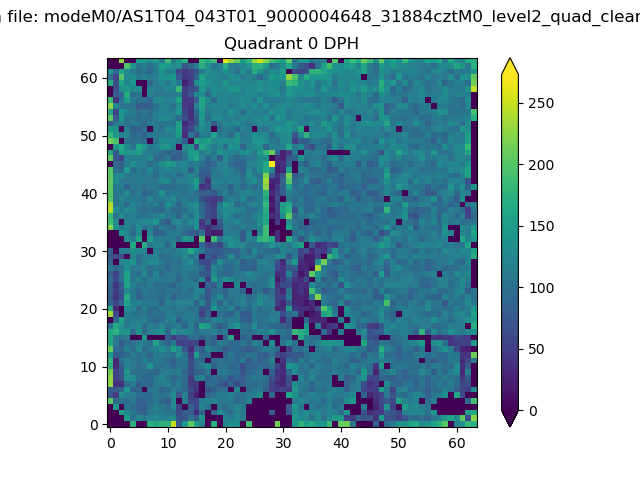 |
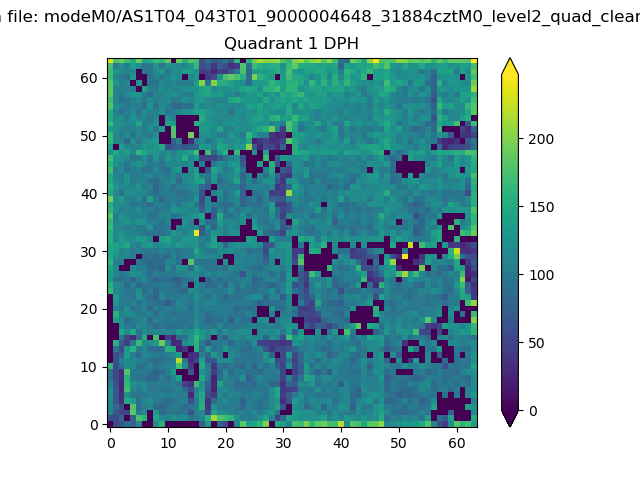 |
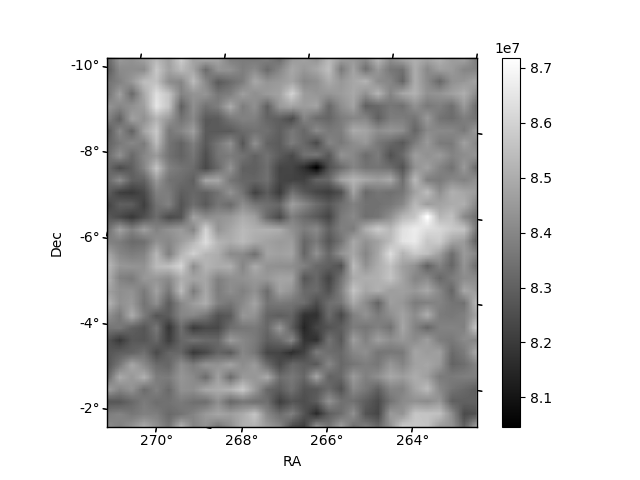
Quadrant B |
|---|---|---|---|
| Quadrant D | 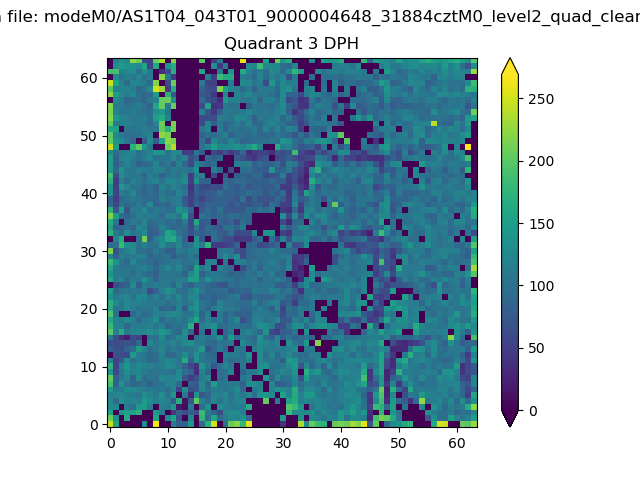 |
 |
Quadrant C |
| Plot type | Count rate plots | Images |
|---|---|---|
| Comparison with Poisson distribution Blue bars denote a histogram of data divided into 1 sec bins. Red curve is a Poisson curve with rate = median count rate of data. |
 |
 |
| Quadrant-wise count rates Data is divided into 100 sec bins |
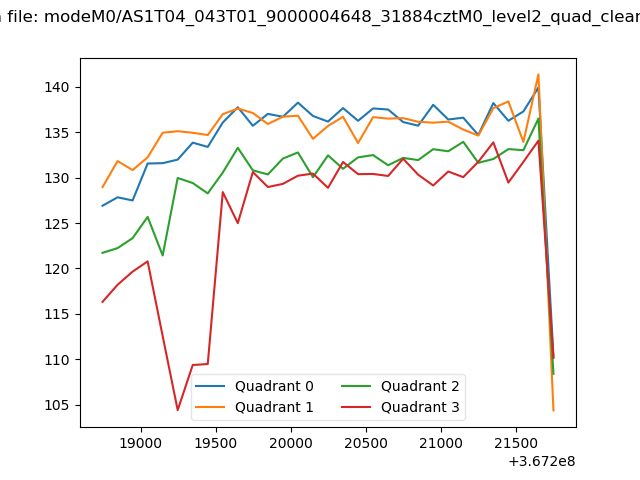 |
|
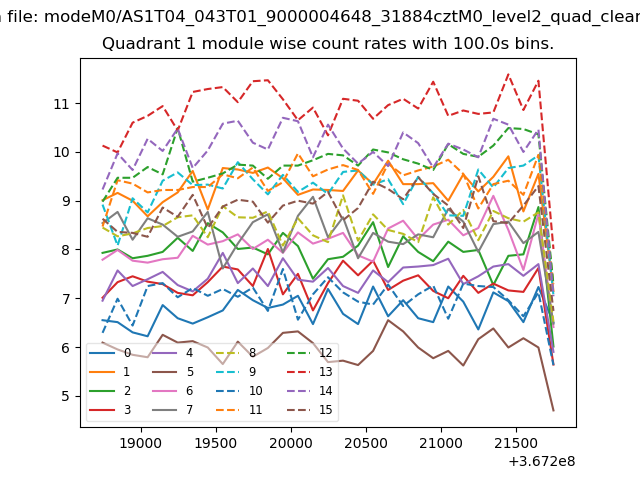
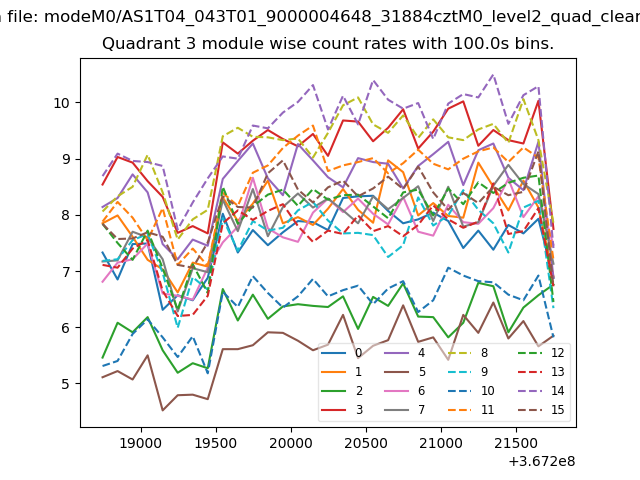
| Module-wise count rates for Quadrant A Data is divided into 100 sec bins |
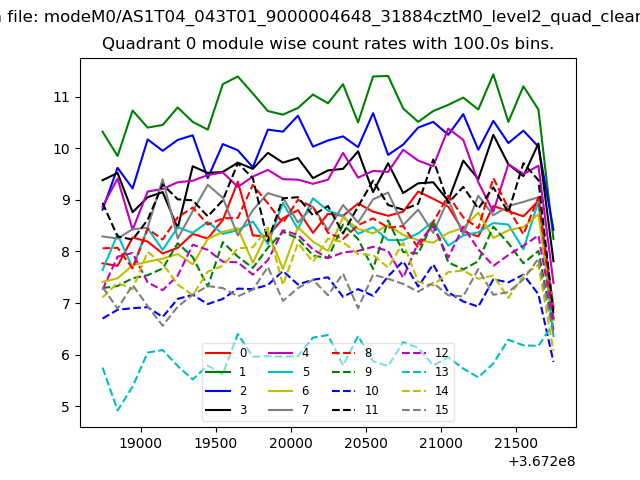 |
 |
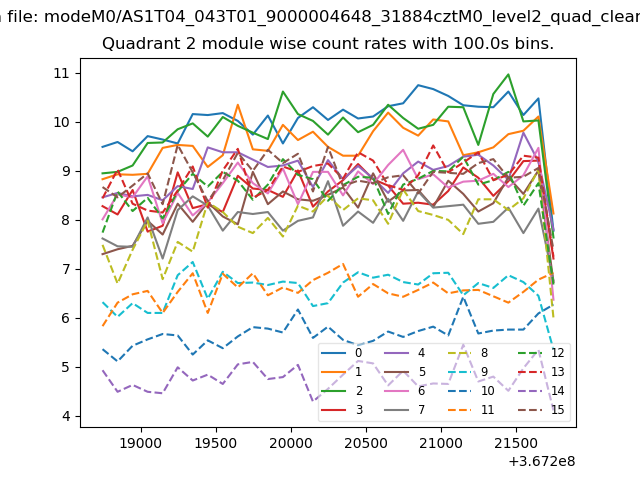
| Module-wise count rates for Quadrant B Data is divided into 100 sec bins |
 |
 |
| Module-wise count rates for Quadrant C Data is divided into 100 sec bins |
 |
 |
| Module-wise count rates for Quadrant D Data is divided into 100 sec bins |
 |
 |
| Parameter | Plot |
|---|---|
| CZT HV Monitor | 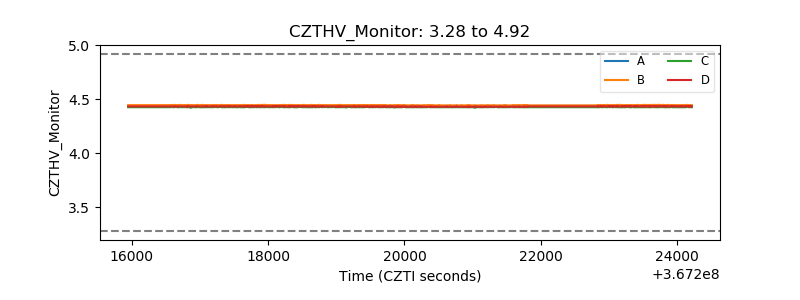 |
| D_VDD | 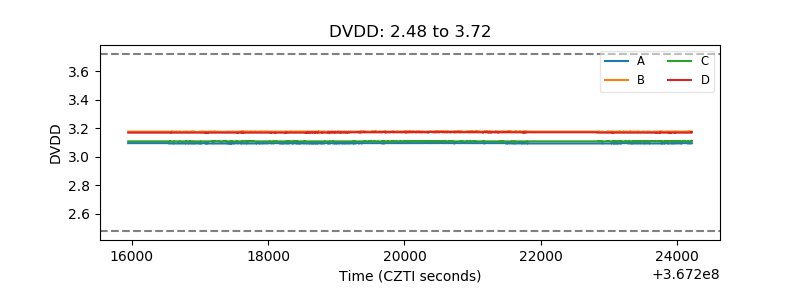 |
| Temperature 1 | 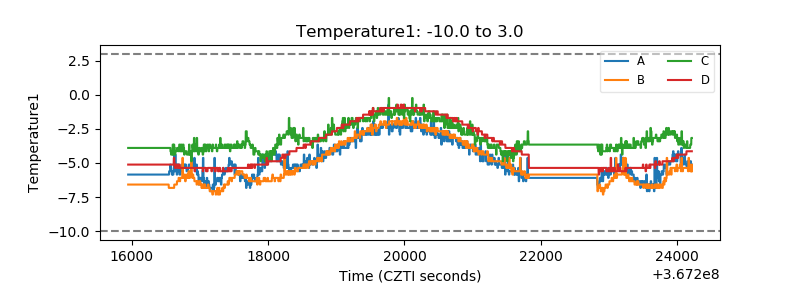 |
| Veto HV Monitor | 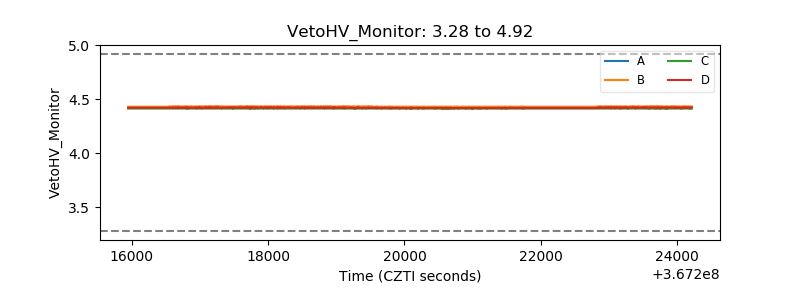 |
| Veto LLD | 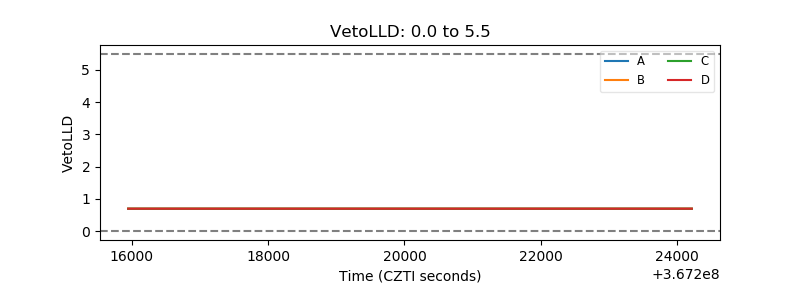 |
| Alpha Counter | 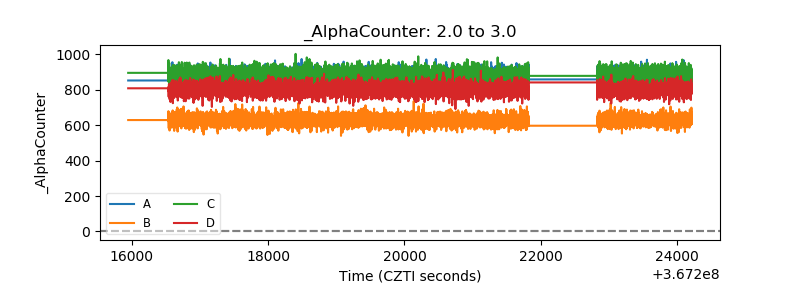 |
| _CPM_Rate |  |
| CZT Counter | 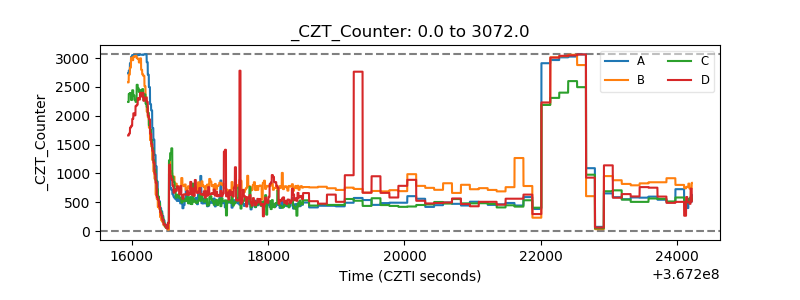 |
| +2.5 Volts monitor |  |
| +5 Volts monitor |  |
| _ROLL_ROT | 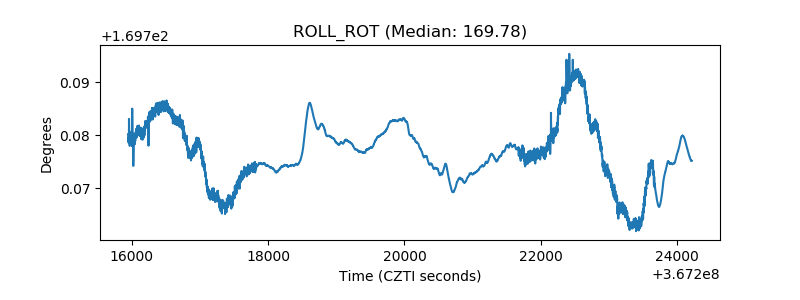 |
| _Roll_DEC | 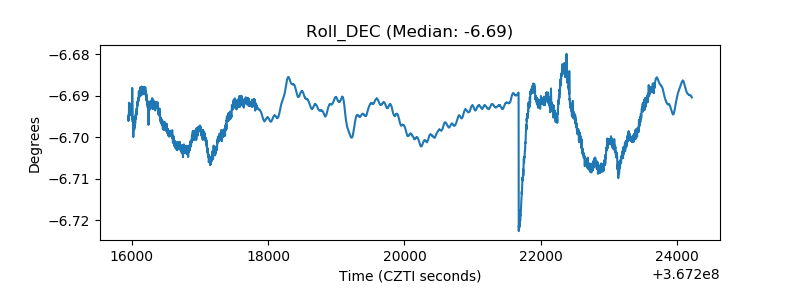 |
| _Roll_RA | 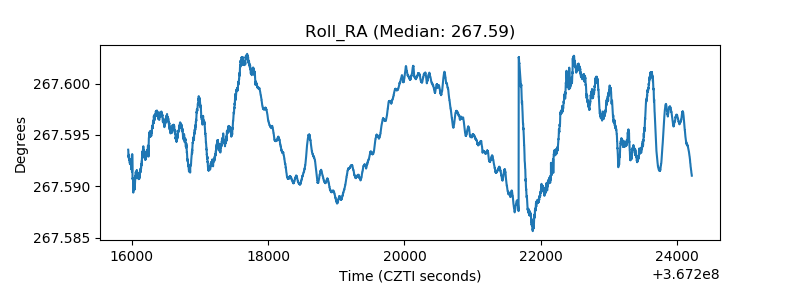 |
| Veto Counter | 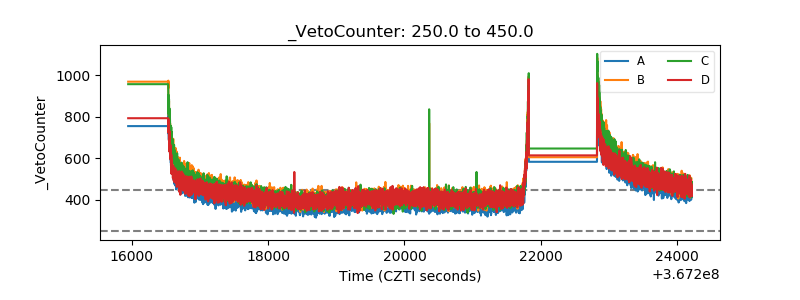 |