| Param | Original file | Final file |
|---|---|---|
| Filename | modeM0/AS1T04_043T01_9000004648_31886cztM0_level2.evt | modeM0/AS1T04_043T01_9000004648_31886cztM0_level2_quad_clean.evt |
| Size (bytes) | 1,475,568,000 | 80,732,160 |
| Size | 1.4 GB | 77.0 MB |
| Events in quadrant A | 8,756,137 | 311,016 |
| Events in quadrant B | 13,875,473 | 309,443 |
| Events in quadrant C | 9,416,117 | 301,695 |
| Events in quadrant D | 11,440,051 | 293,903 |
| Mode M0 | |||
|---|---|---|---|
| Quadrant | BADHDUFLAG | Total packets | Discarded packets |
| A | 0 | 38964 | 2169 |
| B | 0 | 57550 | 2948 |
| C | 0 | 40443 | 1916 |
| D | 0 | 47910 | 2066 |
| Mode M9 | |||
|---|---|---|---|
| Quadrant | BADHDUFLAG | Total packets | Discarded packets |
| A | 0 | 26 | 1 |
| B | 0 | 25 | 0 |
| C | 0 | 25 | 0 |
| D | 0 | 26 | 1 |
| Mode SS | |||
|---|---|---|---|
| Quadrant | BADHDUFLAG | Total packets | Discarded packets |
| A | 0 | 383 | 19 |
| B | 0 | 380 | 18 |
| C | 0 | 380 | 16 |
| D | 0 | 382 | 20 |
| Quadrant | Total seconds | Saturated seconds | Saturation percentage |
|---|---|---|---|
| A | 17811 | 134 | 0.752344% |
| B | 17742 | 331 | 1.865630% |
| C | 17832 | 334 | 1.873037% |
| D | 17824 | 293 | 1.643851% |
Noise dominated data is calculated using 1-second bins in cleaned event files. If a bin has >2000 counts, and if more than 50% of those come from <1% of pixels, then it is considered to be noise-dominated and hence unusable.
| Quadrant | # 1 sec bins | Bins with >0 counts | Bins with >2000 counts | High rate bins dominated by noise | Noise dominated (total time) | Noise dominated (detector-on time) | Marked lightcurve |
|---|---|---|---|---|---|---|---|
| A | 21336 | 17978 | 7 | 7 | 0.03% | 0.04% | 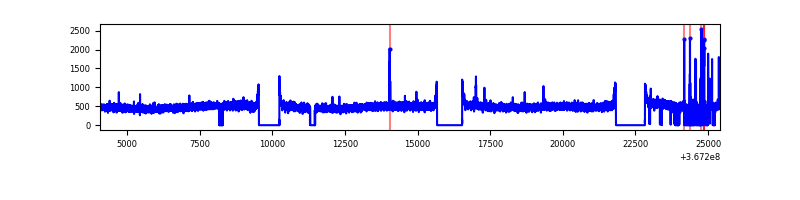 |
| B | 21336 | 17876 | 26 | 26 | 0.12% | 0.15% | 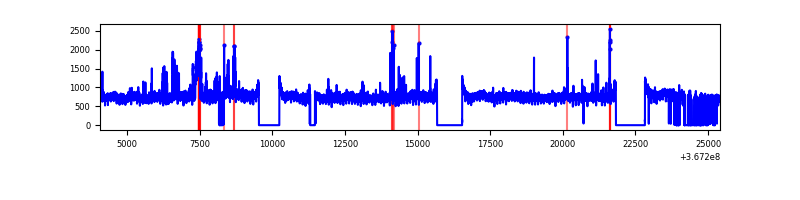 |
| C | 21336 | 17975 | 10 | 10 | 0.05% | 0.06% | 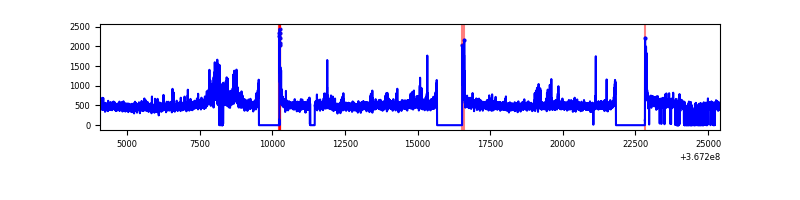 |
| D | 21336 | 17973 | 172 | 172 | 0.81% | 0.96% | 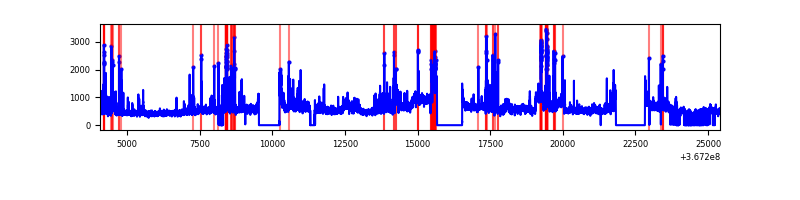 |
Top three noisy pixels from each quadrant. If the there are fewer than three noisy pixels in the level2.evt file, extra rows are filled as -1
| Pixel properties | Quadrant properties | ||||||
|---|---|---|---|---|---|---|---|
| Quadrant | DetID | PixID | Counts | Sigma | Mean | Median | Sigma |
| A | 0 | 13 | 56885 | 122.21 | 2239 | 2191 | 447.6 |
| A | 13 | 6 | 34872 | 73.02 | 2239 | 2191 | 447.6 |
| A | 15 | 174 | 32389 | 67.47 | 2239 | 2191 | 447.6 |
| B | 6 | 159 | 4713252 | 11161.6 | 2200 | 2148 | 422.1 |
| B | 10 | 245 | 374917 | 883.17 | 2200 | 2148 | 422.1 |
| B | 12 | 111 | 52939 | 120.33 | 2200 | 2148 | 422.1 |
| C | 3 | 233 | 491693 | 975.24 | 2136 | 2149 | 502.0 |
| C | 14 | 238 | 363941 | 720.74 | 2136 | 2149 | 502.0 |
| C | 0 | 10 | 122052 | 238.86 | 2136 | 2149 | 502.0 |
| D | 8 | 195 | 2327694 | 4531.02 | 2146 | 2091 | 513.3 |
| D | 12 | 218 | 430139 | 833.97 | 2146 | 2091 | 513.3 |
| D | 13 | 249 | 242112 | 467.64 | 2146 | 2091 | 513.3 |
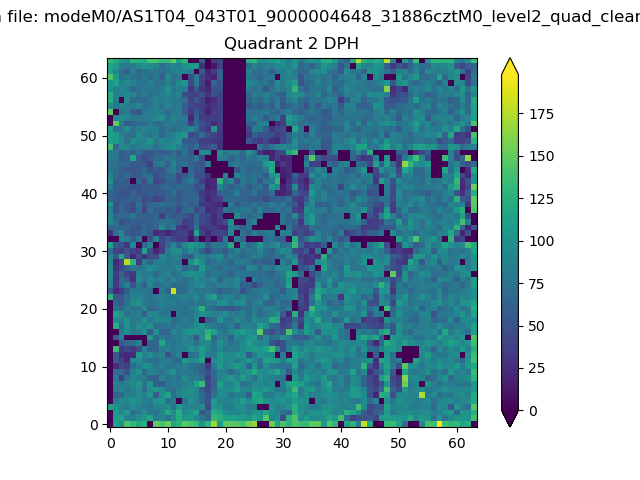
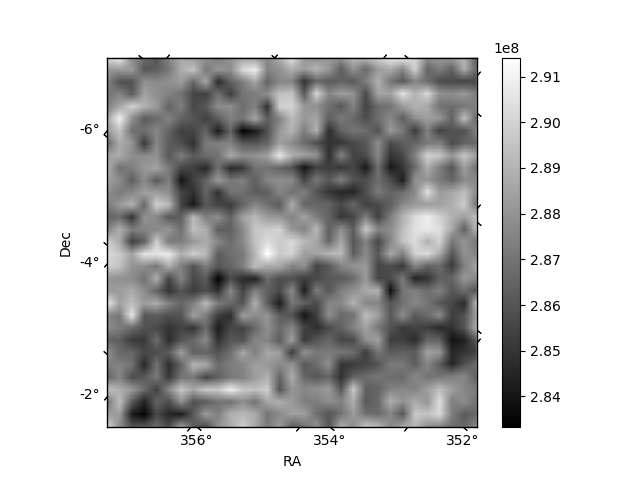
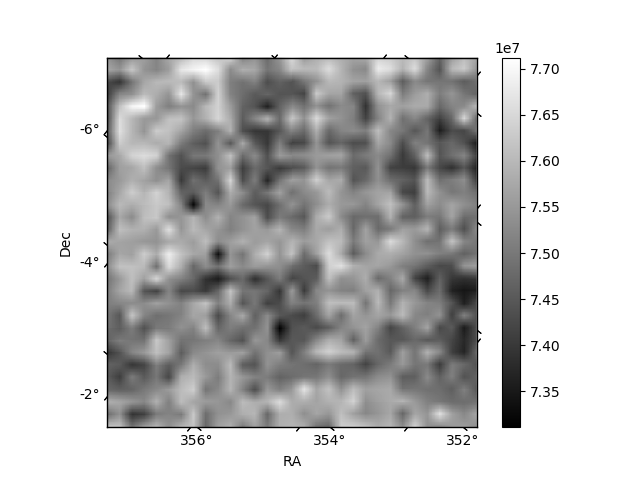
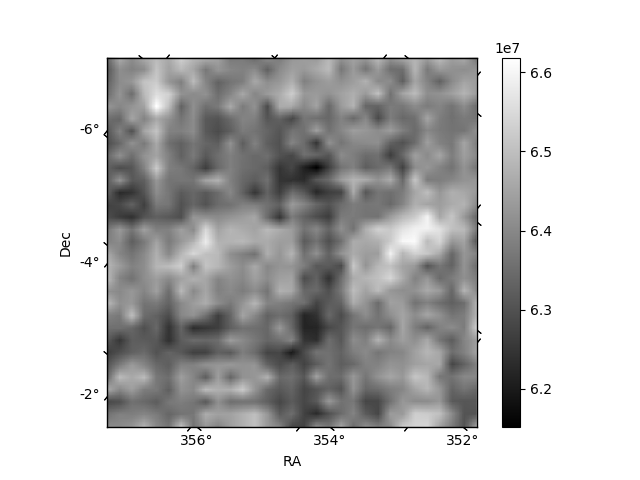
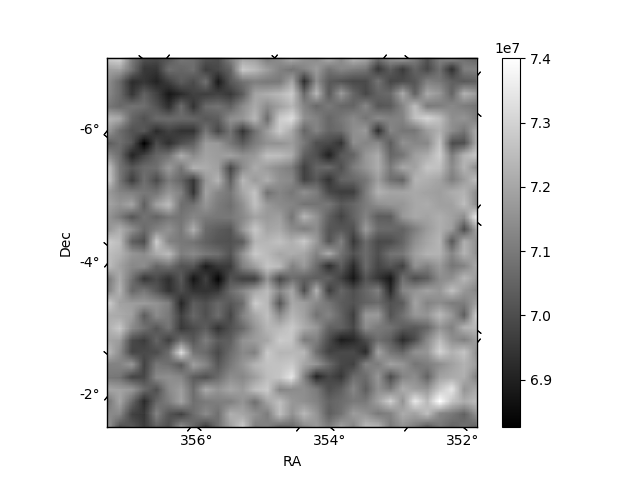
Histogram calculated using DETX and DETY for each event in the final _common_clean file
| Quadrant A | 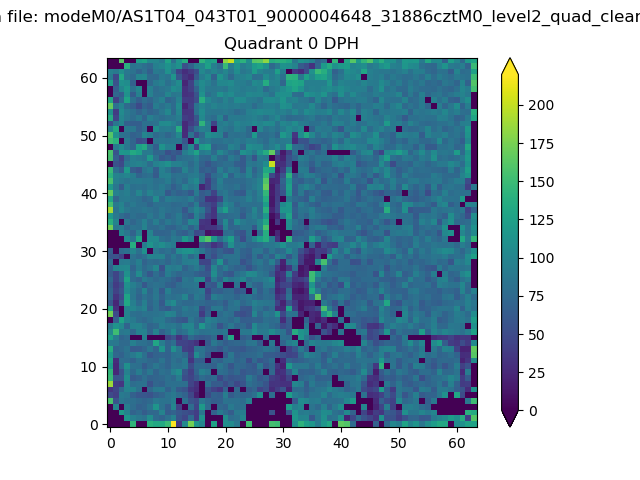 |
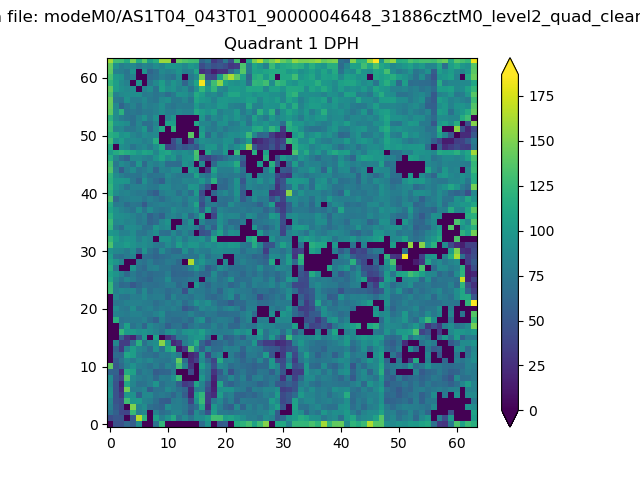 |
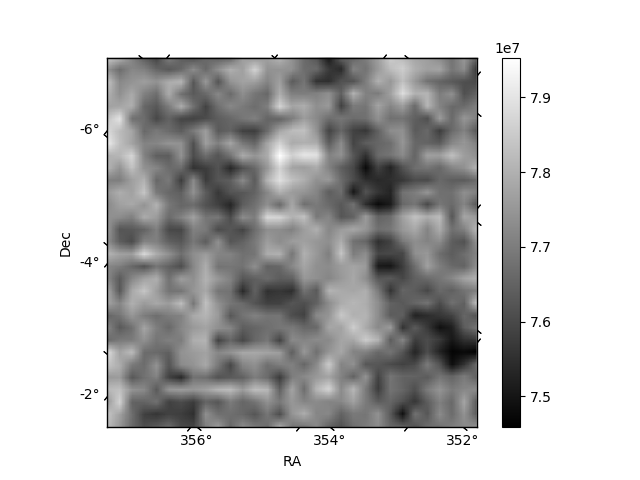
Quadrant B |
|---|---|---|---|
| Quadrant D | 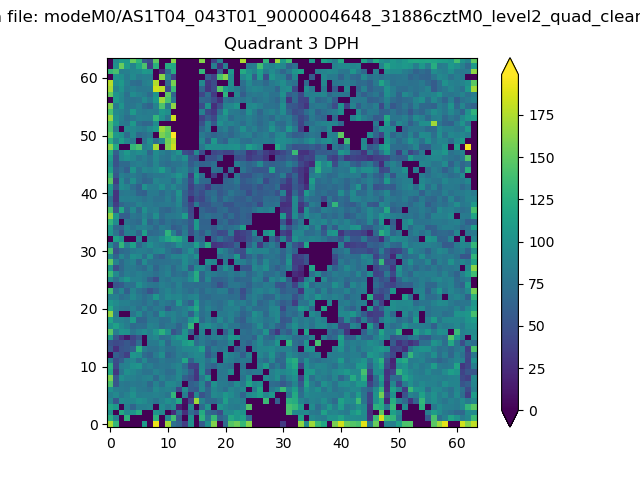 |
 |
Quadrant C |
| Plot type | Count rate plots | Images |
|---|---|---|
| Comparison with Poisson distribution Blue bars denote a histogram of data divided into 1 sec bins. Red curve is a Poisson curve with rate = median count rate of data. |
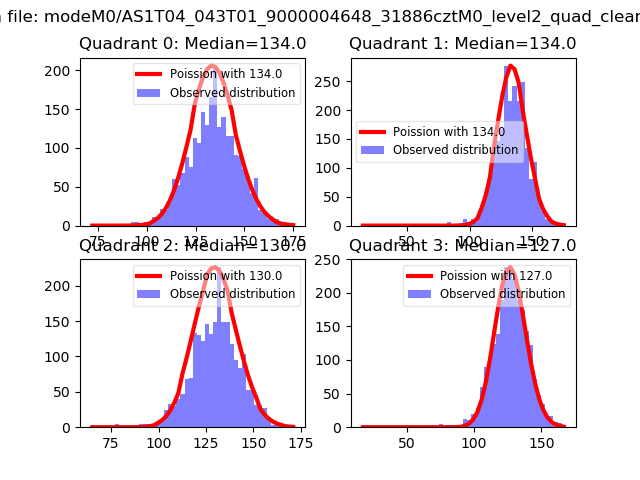 |
 |
| Quadrant-wise count rates Data is divided into 100 sec bins |
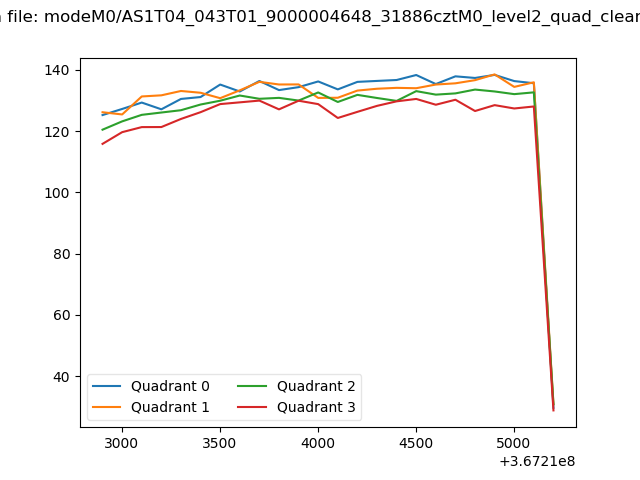 |
|
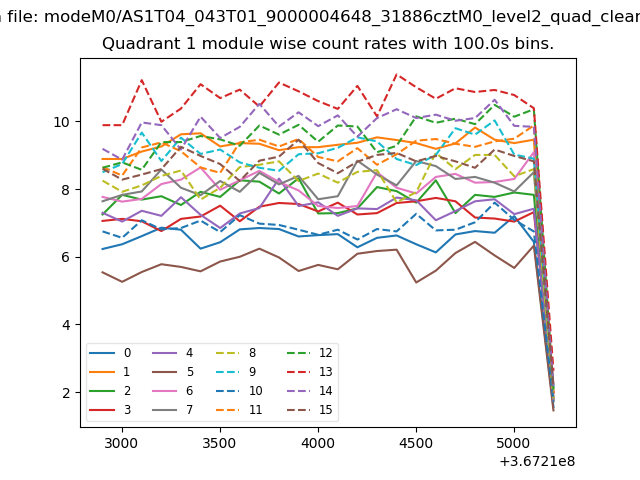
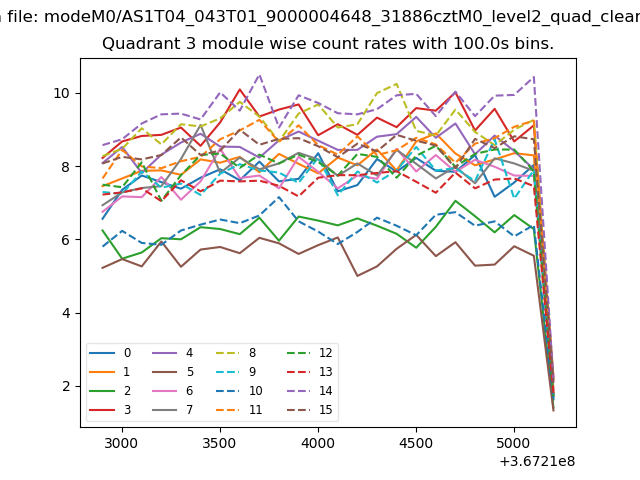
| Module-wise count rates for Quadrant A Data is divided into 100 sec bins |
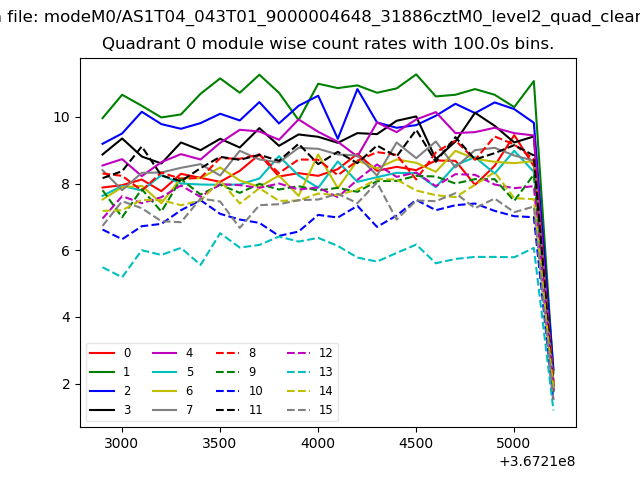 |
 |
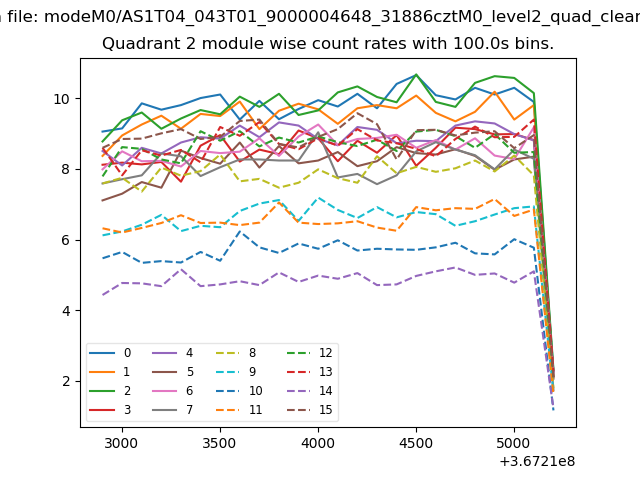
| Module-wise count rates for Quadrant B Data is divided into 100 sec bins |
 |
 |
| Module-wise count rates for Quadrant C Data is divided into 100 sec bins |
 |
 |
| Module-wise count rates for Quadrant D Data is divided into 100 sec bins |
 |
 |
| Parameter | Plot |
|---|---|
| CZT HV Monitor | 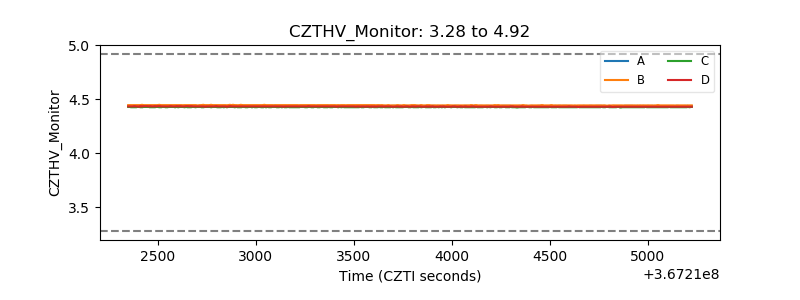 |
| D_VDD | 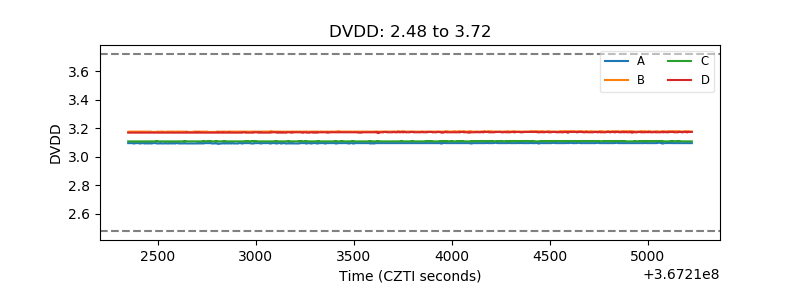 |
| Temperature 1 | 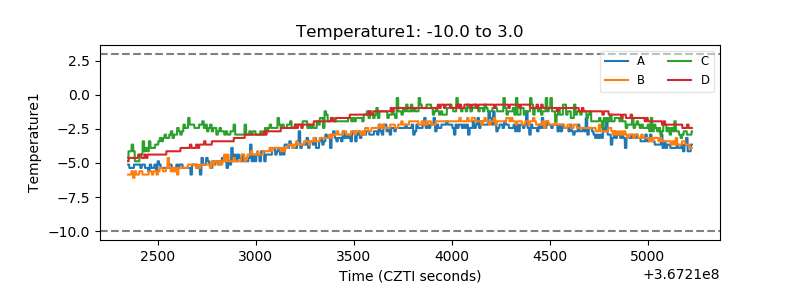 |
| Veto HV Monitor | 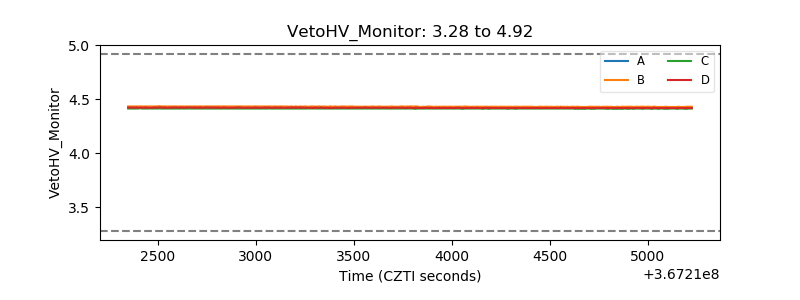 |
| Veto LLD | 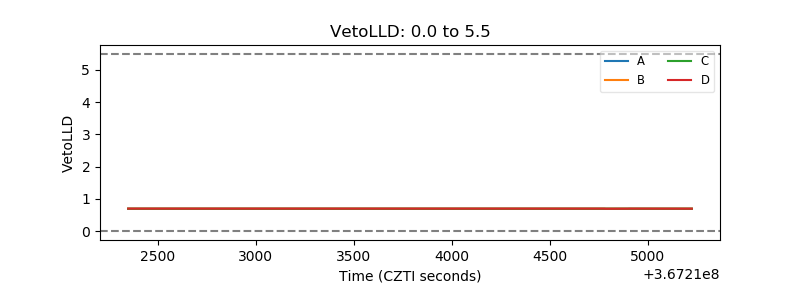 |
| Alpha Counter | 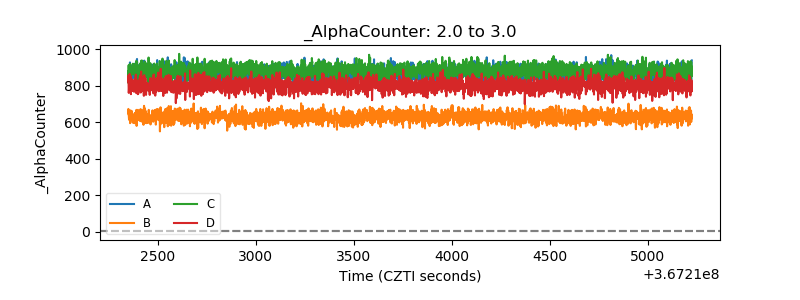 |
| _CPM_Rate |  |
| CZT Counter | 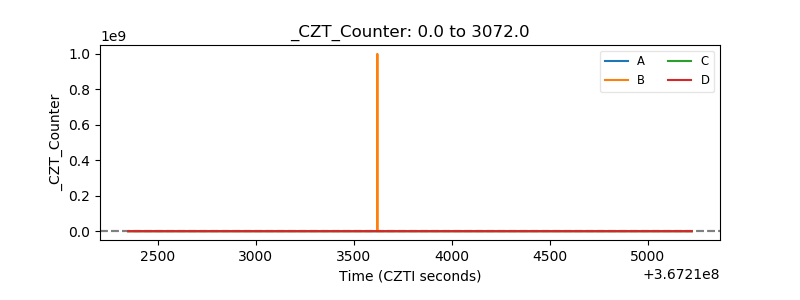 |
| +2.5 Volts monitor | 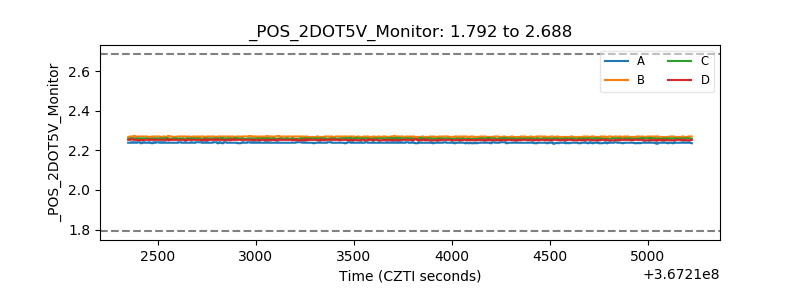 |
| +5 Volts monitor | 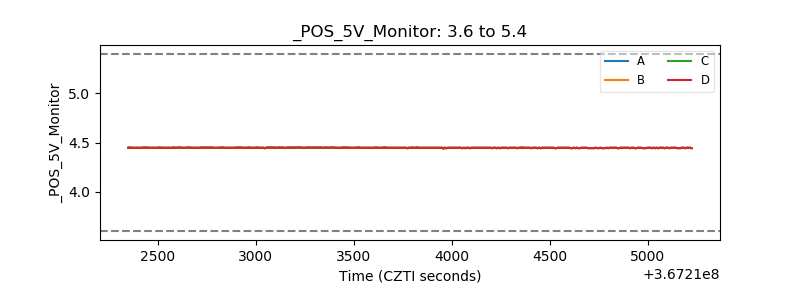 |
| _ROLL_ROT | 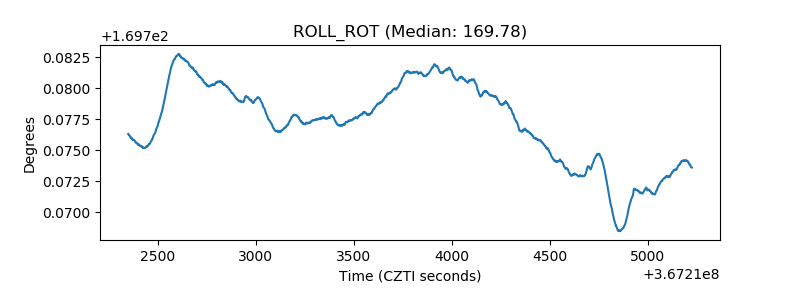 |
| _Roll_DEC | 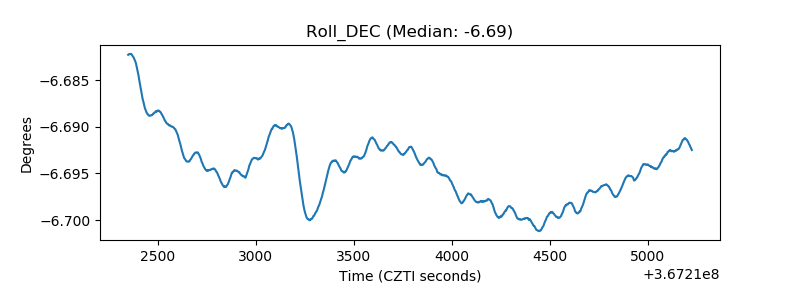 |
| _Roll_RA | 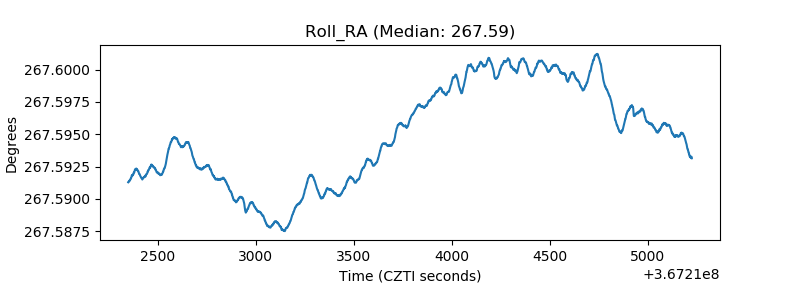 |
| Veto Counter | 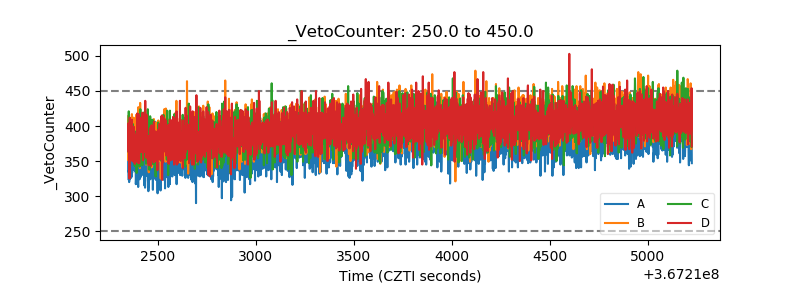 |