| Param | Original file | Final file |
|---|---|---|
| Filename | modeM0/AS1A10_123T09_9000004654_31901cztM0_level2.evt | modeM0/AS1A10_123T09_9000004654_31901cztM0_level2_quad_clean.evt |
| Size (bytes) | 177,589,440 | 27,106,560 |
| Size | 169.4 MB | 25.9 MB |
| Events in quadrant A | 871,115 | 193,728 |
| Events in quadrant B | 1,267,618 | 190,721 |
| Events in quadrant C | 2,026,247 | 155,233 |
| Events in quadrant D | 1,117,333 | 177,581 |
| Mode M0 | |||
|---|---|---|---|
| Quadrant | BADHDUFLAG | Total packets | Discarded packets |
| A | 0 | 3546 | 1 |
| B | 0 | 4650 | 1 |
| C | 0 | 6993 | 1 |
| D | 0 | 4349 | 1 |
| Mode SS | |||
|---|---|---|---|
| Quadrant | BADHDUFLAG | Total packets | Discarded packets |
| A | 0 | 26 | 0 |
| B | 0 | 26 | 0 |
| C | 0 | 26 | 0 |
| D | 0 | 26 | 0 |
| Mode M9 | |||
|---|---|---|---|
| Quadrant | BADHDUFLAG | Total packets | Discarded packets |
| A | 0 | 7 | 0 |
| B | 0 | 7 | 0 |
| C | 0 | 7 | 0 |
| D | 0 | 7 | 0 |
| Quadrant | Total seconds | Saturated seconds | Saturation percentage |
|---|---|---|---|
| A | 1388 | 39 | 2.809798% |
| B | 1388 | 102 | 7.348703% |
| C | 1388 | 581 | 41.858790% |
| D | 1388 | 42 | 3.025937% |
Noise dominated data is calculated using 1-second bins in cleaned event files. If a bin has >2000 counts, and if more than 50% of those come from <1% of pixels, then it is considered to be noise-dominated and hence unusable.
| Quadrant | # 1 sec bins | Bins with >0 counts | Bins with >2000 counts | High rate bins dominated by noise | Noise dominated (total time) | Noise dominated (detector-on time) | Marked lightcurve |
|---|---|---|---|---|---|---|---|
| A | 1388 | 1388 | 0 | 0 | 0.00% | 0.00% | 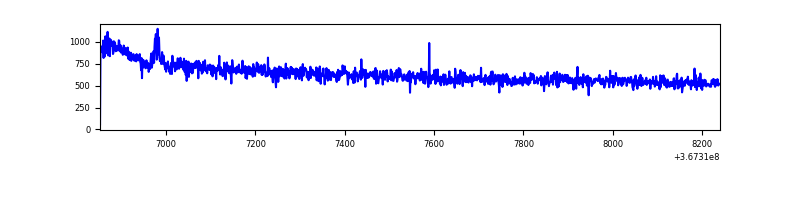 |
| B | 1388 | 1388 | 29 | 29 | 2.09% | 2.09% | 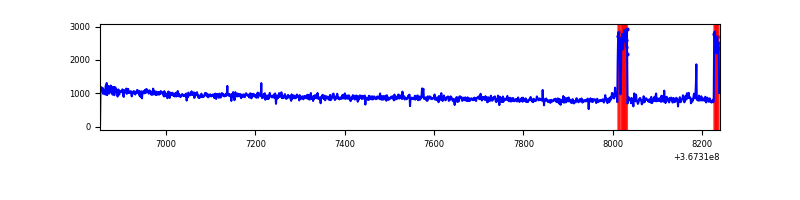 |
| C | 1388 | 1388 | 333 | 333 | 23.99% | 23.99% | 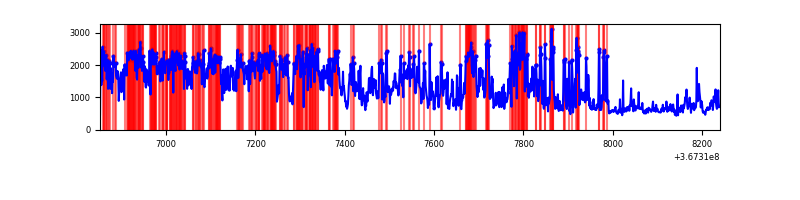 |
| D | 1388 | 1388 | 3 | 3 | 0.22% | 0.22% | 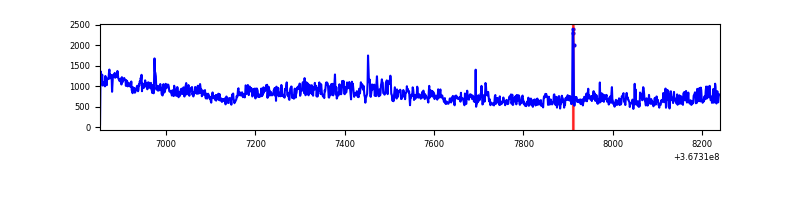 |
Top three noisy pixels from each quadrant. If the there are fewer than three noisy pixels in the level2.evt file, extra rows are filled as -1
| Pixel properties | Quadrant properties | ||||||
|---|---|---|---|---|---|---|---|
| Quadrant | DetID | PixID | Counts | Sigma | Mean | Median | Sigma |
| A | 15 | 174 | 3969 | 82.08 | 224 | 220 | 45.7 |
| A | 13 | 6 | 2863 | 57.87 | 224 | 220 | 45.7 |
| A | 13 | 254 | 2106 | 41.29 | 224 | 220 | 45.7 |
| B | 6 | 159 | 342719 | 8161.86 | 212 | 208 | 42.0 |
| B | 10 | 245 | 87736 | 2085.75 | 212 | 208 | 42.0 |
| B | 12 | 111 | 4740 | 108.0 | 212 | 208 | 42.0 |
| C | 3 | 233 | 964840 | 24163.15 | 169 | 169 | 39.9 |
| C | 0 | 10 | 360950 | 9036.87 | 169 | 169 | 39.9 |
| C | 14 | 238 | 29881 | 744.23 | 169 | 169 | 39.9 |
| D | 8 | 195 | 310116 | 6036.36 | 208 | 202 | 51.3 |
| D | 2 | 250 | 12544 | 240.38 | 208 | 202 | 51.3 |
| D | 12 | 233 | 5137 | 96.11 | 208 | 202 | 51.3 |
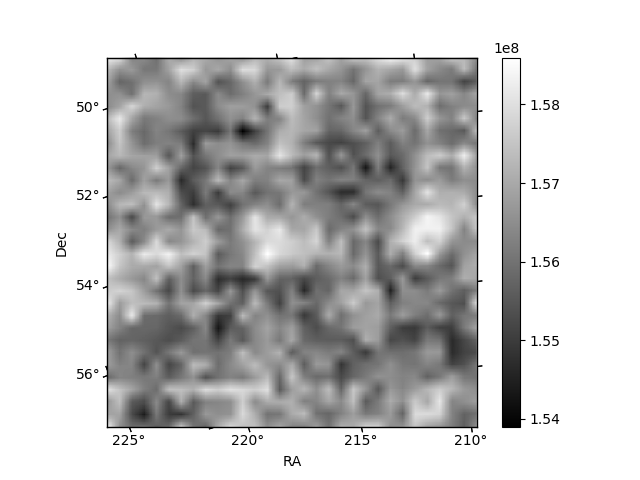
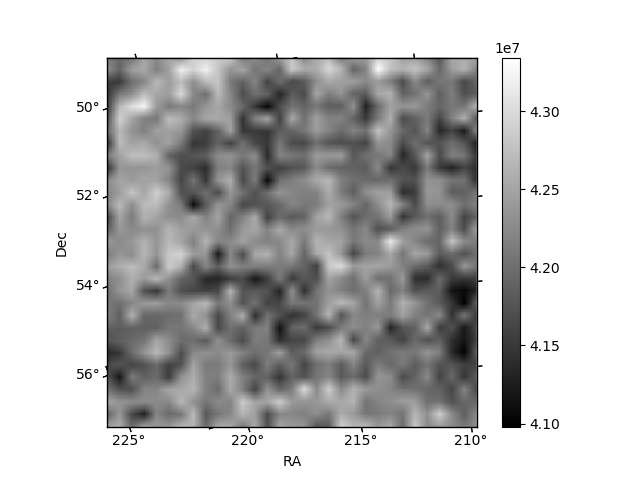
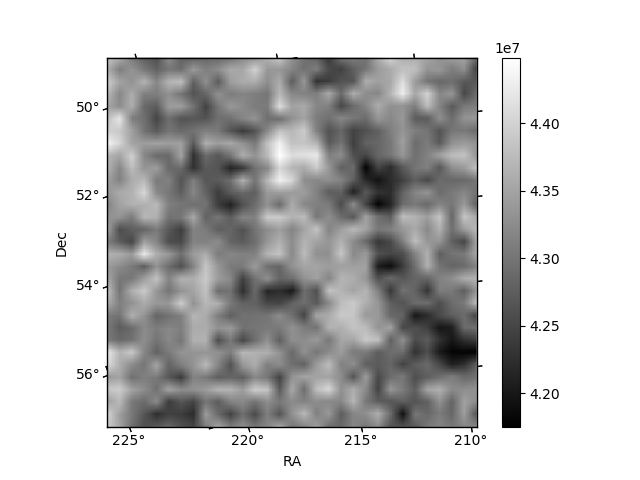
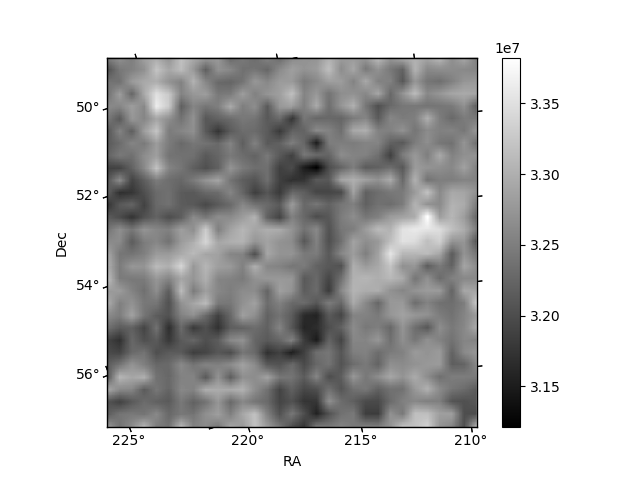
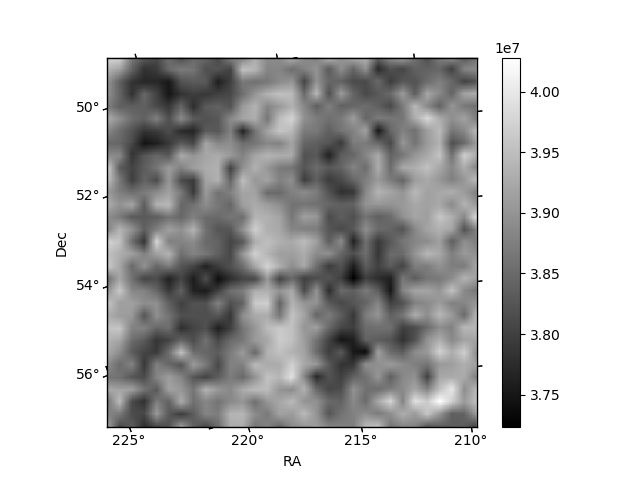
Histogram calculated using DETX and DETY for each event in the final _common_clean file
| Quadrant A | 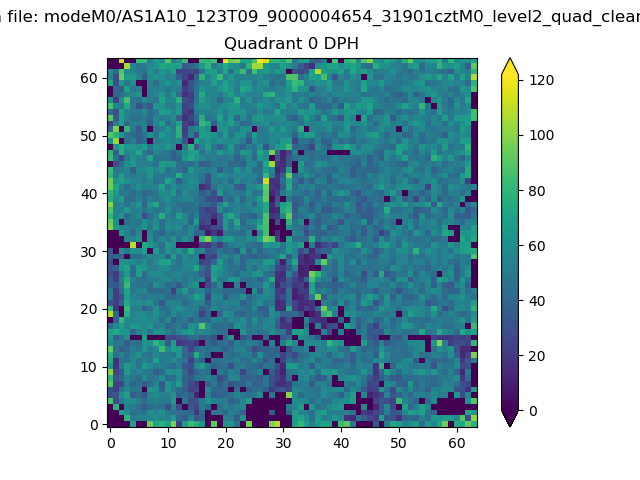 |
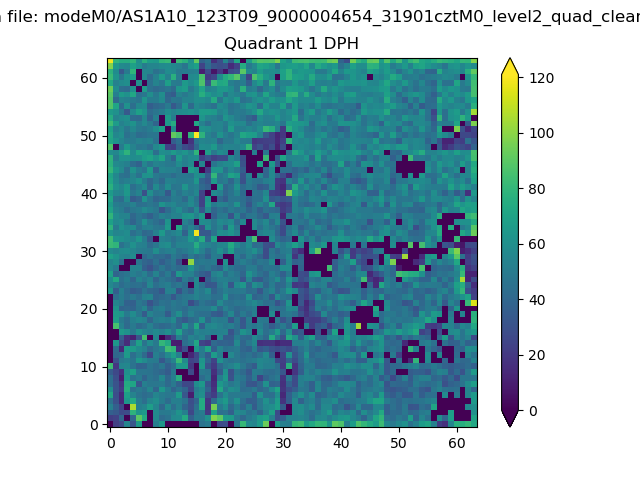 |
Quadrant B |
|---|---|---|---|
| Quadrant D | 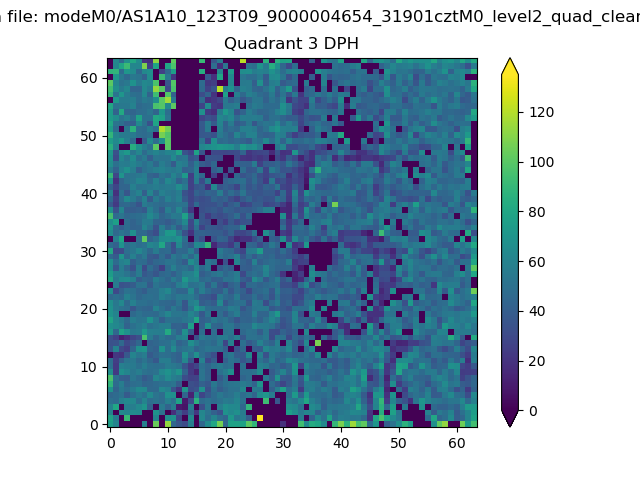 |
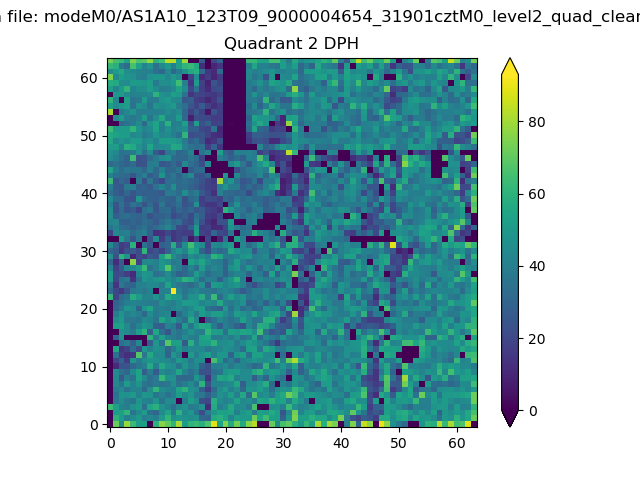 |
Quadrant C |
| Plot type | Count rate plots | Images |
|---|---|---|
| Comparison with Poisson distribution Blue bars denote a histogram of data divided into 1 sec bins. Red curve is a Poisson curve with rate = median count rate of data. |
 |
 |
| Quadrant-wise count rates Data is divided into 100 sec bins |
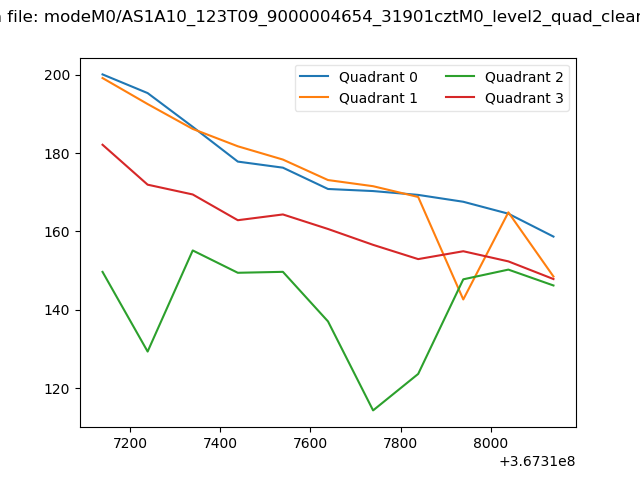 |
|
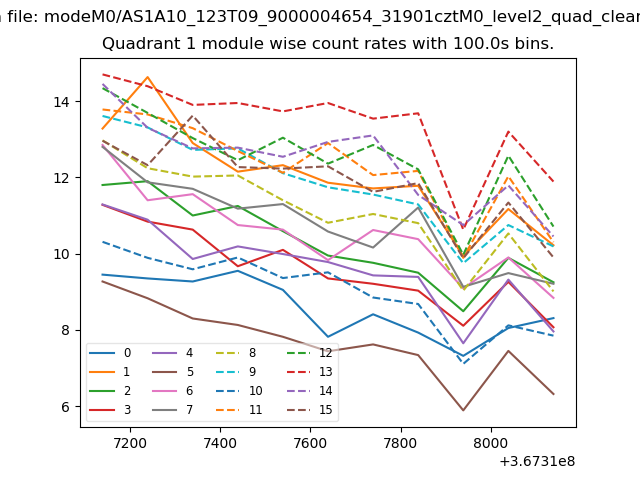
| Module-wise count rates for Quadrant A Data is divided into 100 sec bins |
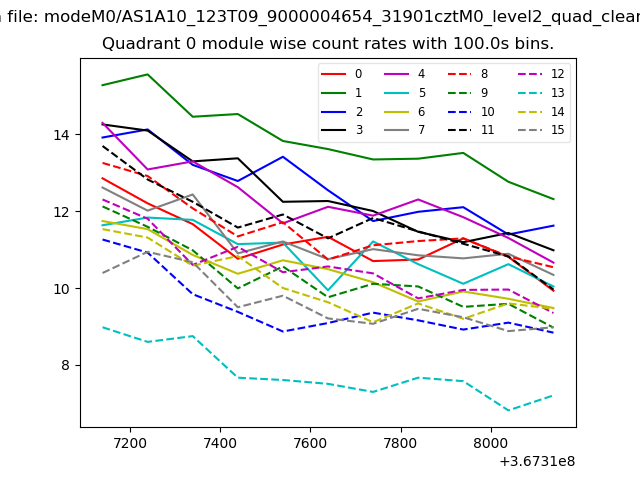 |
 |
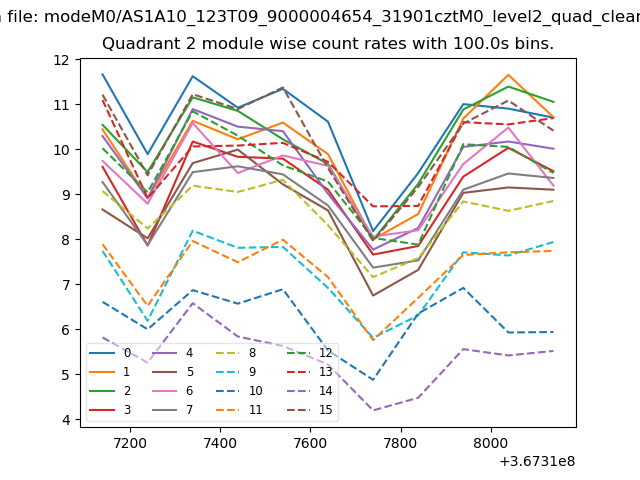
| Module-wise count rates for Quadrant B Data is divided into 100 sec bins |
 |
 |
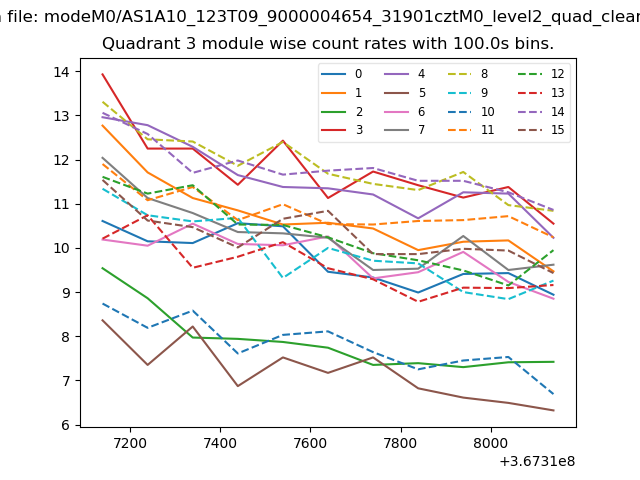
| Module-wise count rates for Quadrant C Data is divided into 100 sec bins |
 |
 |
| Module-wise count rates for Quadrant D Data is divided into 100 sec bins |
 |
 |
| Parameter | Plot |
|---|---|
| CZT HV Monitor | 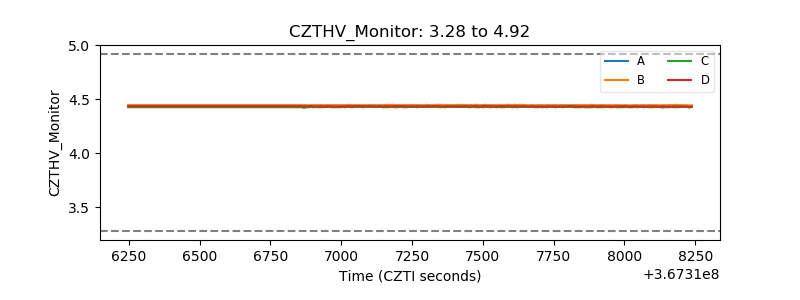 |
| D_VDD | 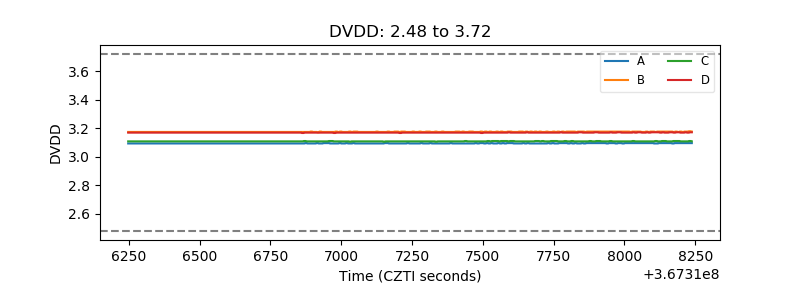 |
| Temperature 1 | 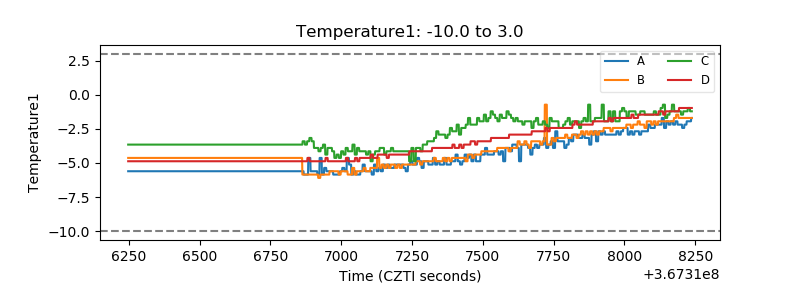 |
| Veto HV Monitor | 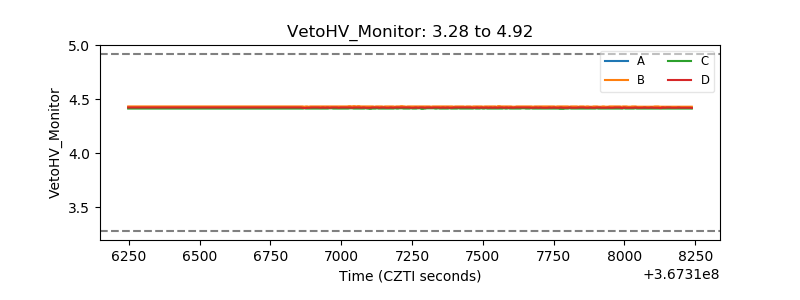 |
| Veto LLD | 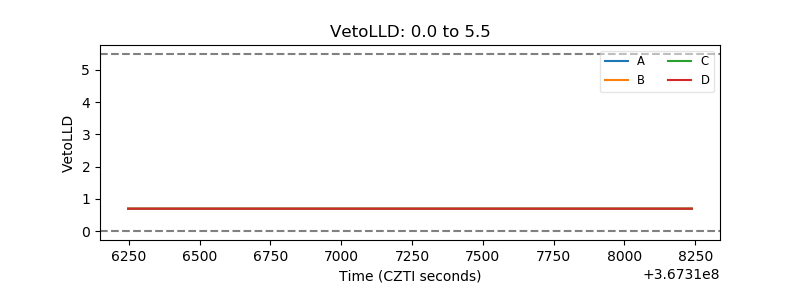 |
| Alpha Counter | 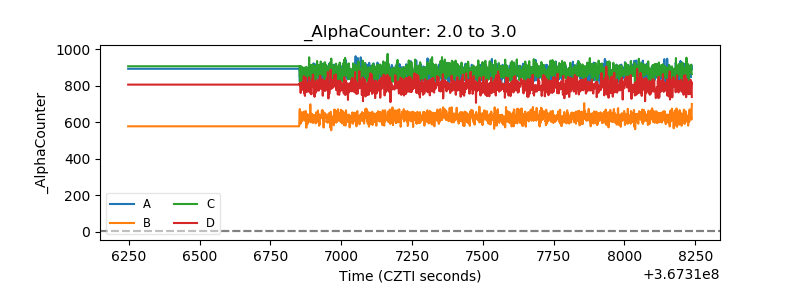 |
| _CPM_Rate | 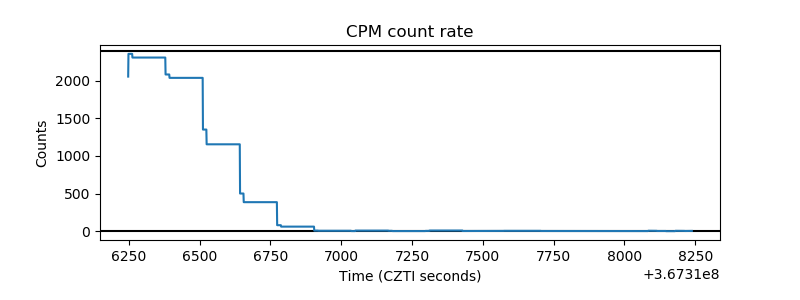 |
| CZT Counter | 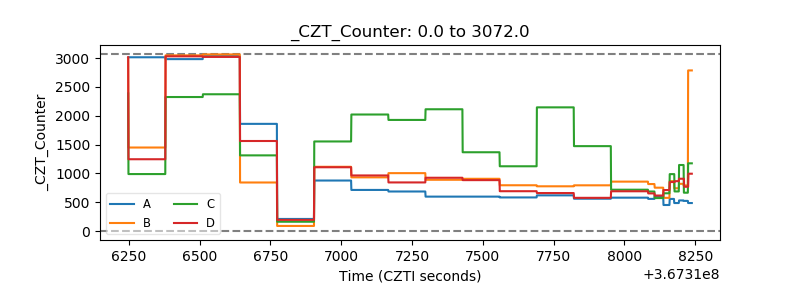 |
| +2.5 Volts monitor |  |
| +5 Volts monitor |  |
| _ROLL_ROT | 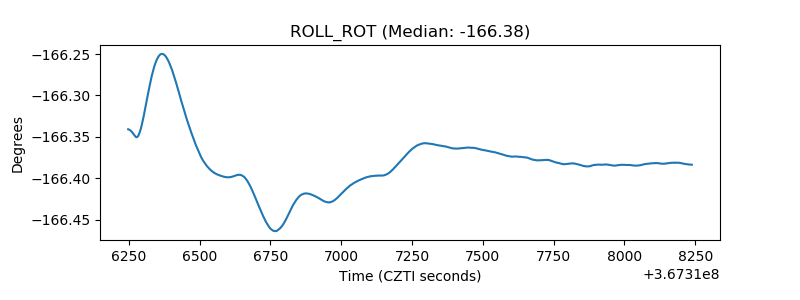 |
| _Roll_DEC |  |
| _Roll_RA | 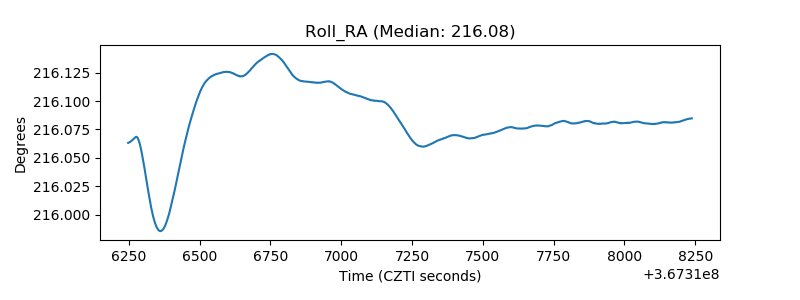 |
| Veto Counter | 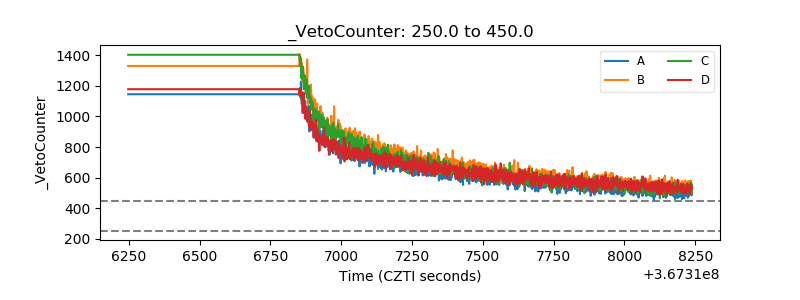 |