| Param | Original file | Final file |
|---|---|---|
| Filename | modeM0/AS1A10_123T09_9000004654_31902cztM0_level2.evt | modeM0/AS1A10_123T09_9000004654_31902cztM0_level2_quad_clean.evt |
| Size (bytes) | 719,530,560 | 120,530,880 |
| Size | 686.2 MB | 114.9 MB |
| Events in quadrant A | 3,485,021 | 865,053 |
| Events in quadrant B | 5,677,640 | 833,290 |
| Events in quadrant C | 5,730,923 | 758,513 |
| Events in quadrant D | 6,471,642 | 752,509 |
| Mode M0 | |||
|---|---|---|---|
| Quadrant | BADHDUFLAG | Total packets | Discarded packets |
| A | 0 | 14360 | 9 |
| B | 0 | 21081 | 10 |
| C | 0 | 21604 | 3 |
| D | 0 | 23821 | 2 |
| Mode SS | |||
|---|---|---|---|
| Quadrant | BADHDUFLAG | Total packets | Discarded packets |
| A | 0 | 128 | 0 |
| B | 0 | 128 | 0 |
| C | 0 | 128 | 0 |
| D | 0 | 128 | 0 |
| Mode M9 | |||
|---|---|---|---|
| Quadrant | BADHDUFLAG | Total packets | Discarded packets |
| A | 0 | 19 | 0 |
| B | 0 | 19 | 0 |
| C | 0 | 19 | 0 |
| D | 0 | 19 | 0 |
| Quadrant | Total seconds | Saturated seconds | Saturation percentage |
|---|---|---|---|
| A | 6312 | 117 | 1.853612% |
| B | 6311 | 389 | 6.163841% |
| C | 6314 | 857 | 13.573012% |
| D | 6314 | 873 | 13.826417% |
Noise dominated data is calculated using 1-second bins in cleaned event files. If a bin has >2000 counts, and if more than 50% of those come from <1% of pixels, then it is considered to be noise-dominated and hence unusable.
| Quadrant | # 1 sec bins | Bins with >0 counts | Bins with >2000 counts | High rate bins dominated by noise | Noise dominated (total time) | Noise dominated (detector-on time) | Marked lightcurve |
|---|---|---|---|---|---|---|---|
| A | 7579 | 6314 | 0 | 0 | 0.00% | 0.00% |  |
| B | 7579 | 6314 | 178 | 178 | 2.35% | 2.82% |  |
| C | 7579 | 6315 | 378 | 378 | 4.99% | 5.99% |  |
| D | 7579 | 6315 | 835 | 835 | 11.02% | 13.22% |  |
Top three noisy pixels from each quadrant. If the there are fewer than three noisy pixels in the level2.evt file, extra rows are filled as -1
| Pixel properties | Quadrant properties | ||||||
|---|---|---|---|---|---|---|---|
| Quadrant | DetID | PixID | Counts | Sigma | Mean | Median | Sigma |
| A | 13 | 254 | 10820 | 56.05 | 900 | 886 | 177.2 |
| A | 3 | 137 | 7980 | 40.02 | 900 | 886 | 177.2 |
| A | 0 | 226 | 7853 | 39.31 | 900 | 886 | 177.2 |
| B | 6 | 159 | 1648841 | 10253.78 | 862 | 844 | 160.7 |
| B | 5 | 172 | 383211 | 2379.07 | 862 | 844 | 160.7 |
| B | 10 | 245 | 104025 | 641.99 | 862 | 844 | 160.7 |
| C | 3 | 233 | 1671106 | 9220.77 | 790 | 795 | 181.1 |
| C | 0 | 10 | 767954 | 4235.02 | 790 | 795 | 181.1 |
| C | 14 | 238 | 148900 | 817.6 | 790 | 795 | 181.1 |
| D | 12 | 218 | 1731733 | 8789.91 | 834 | 814 | 196.9 |
| D | 8 | 195 | 1285792 | 6525.34 | 834 | 814 | 196.9 |
| D | 12 | 233 | 94131 | 473.88 | 834 | 814 | 196.9 |
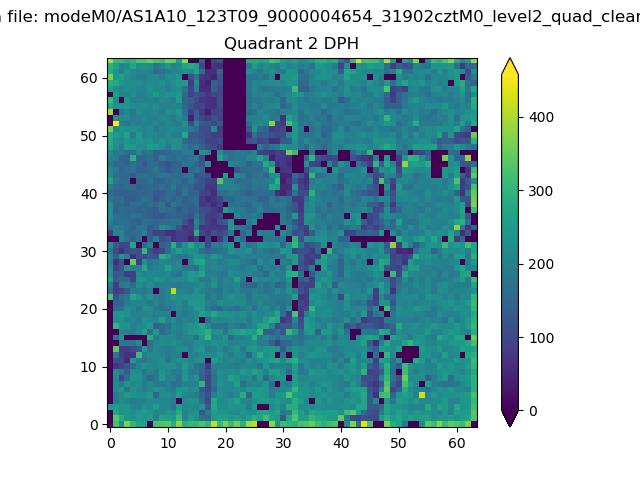
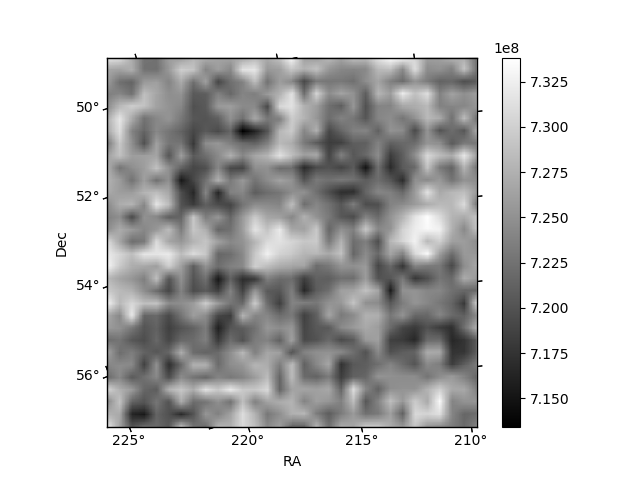
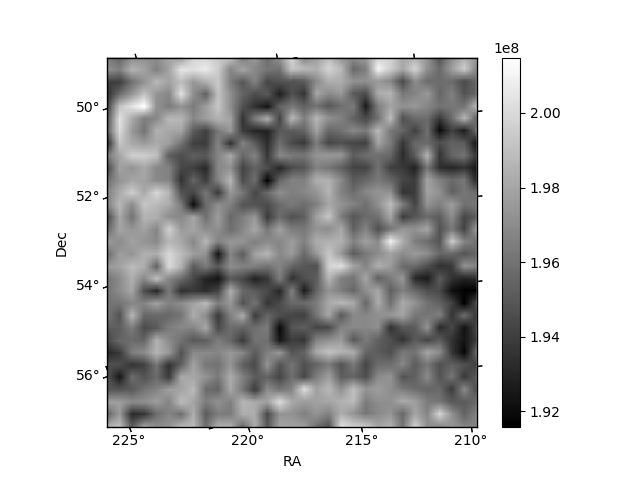
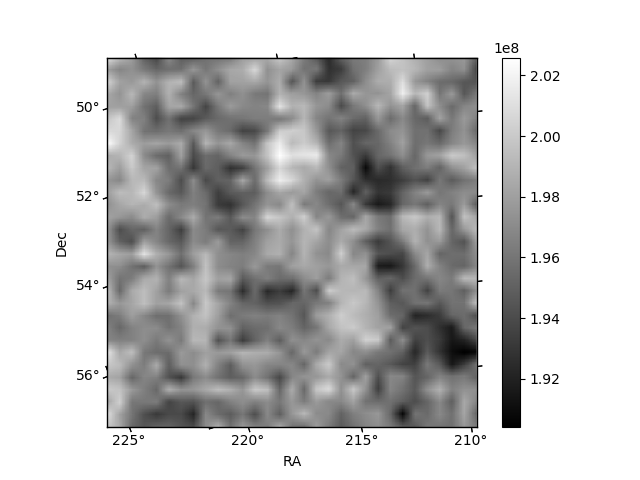
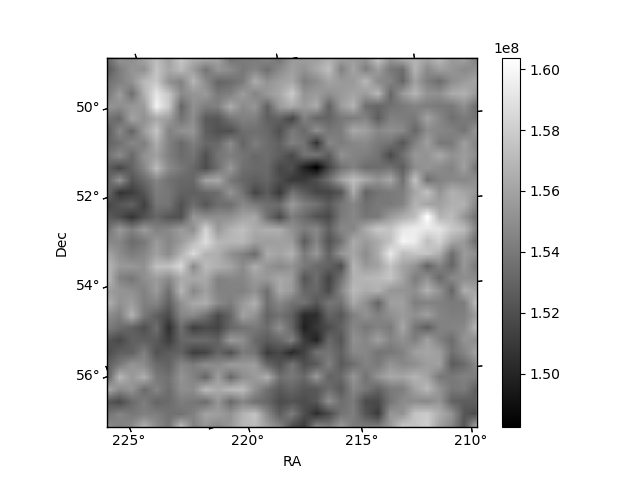
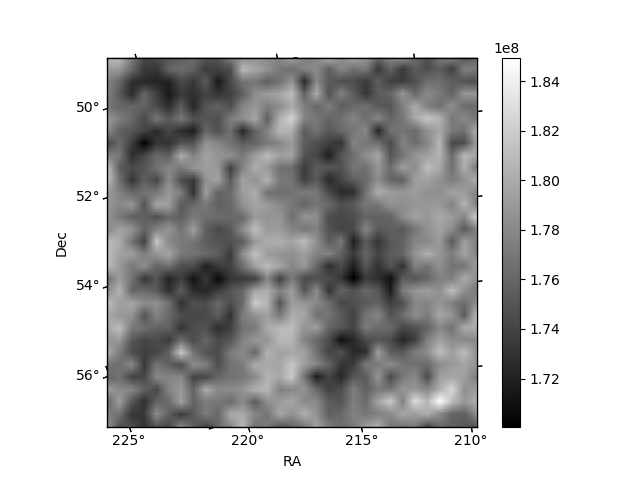
Histogram calculated using DETX and DETY for each event in the final _common_clean file
| Quadrant A | 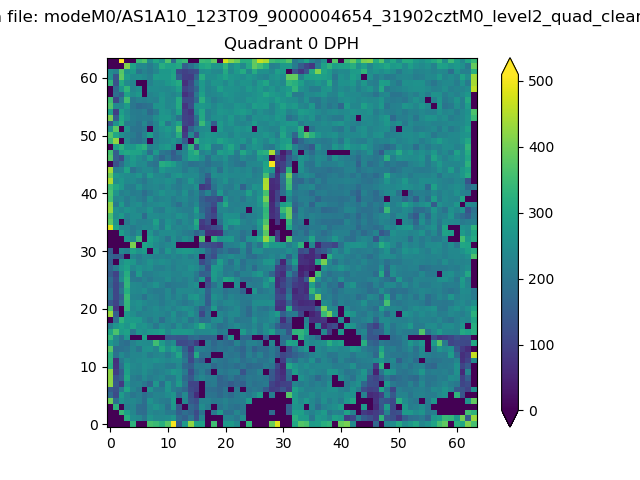 |
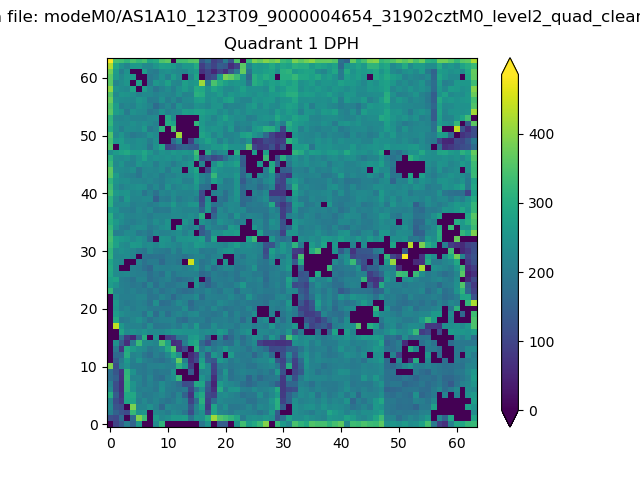 |
Quadrant B |
|---|---|---|---|
| Quadrant D | 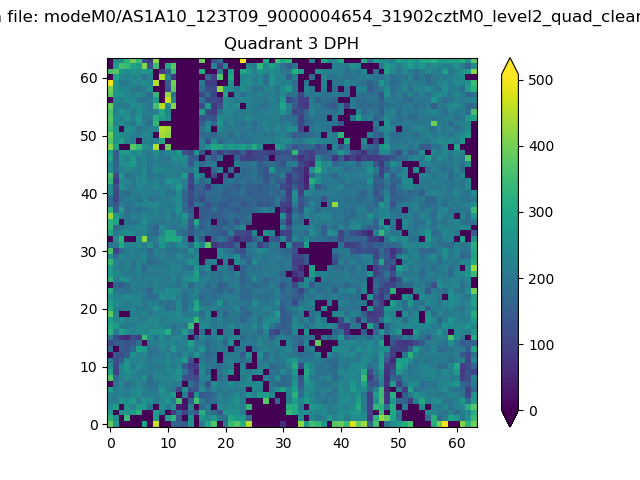 |
 |
Quadrant C |
| Plot type | Count rate plots | Images |
|---|---|---|
| Comparison with Poisson distribution Blue bars denote a histogram of data divided into 1 sec bins. Red curve is a Poisson curve with rate = median count rate of data. |
 |
 |
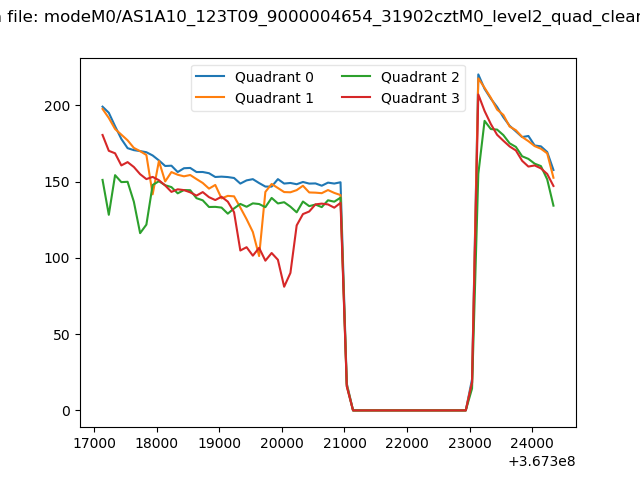
| Quadrant-wise count rates Data is divided into 100 sec bins |
 |
|
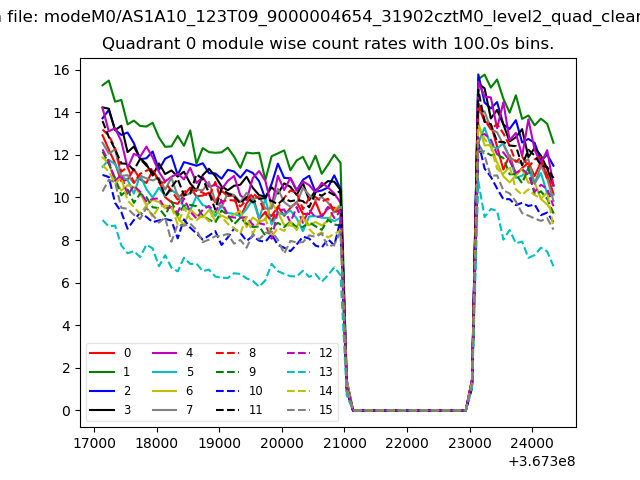
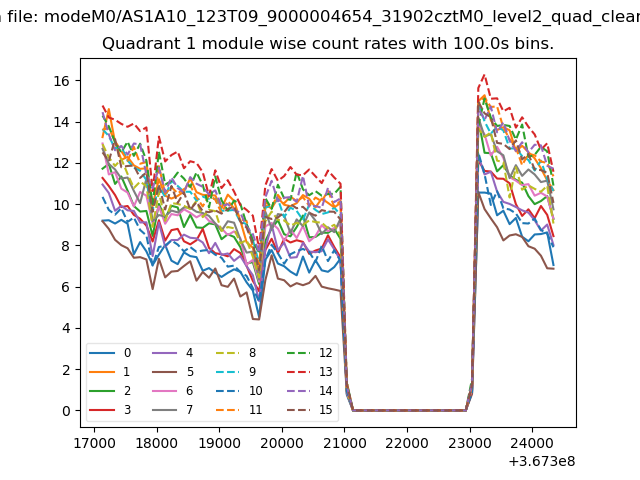
| Module-wise count rates for Quadrant A Data is divided into 100 sec bins |
 |
 |
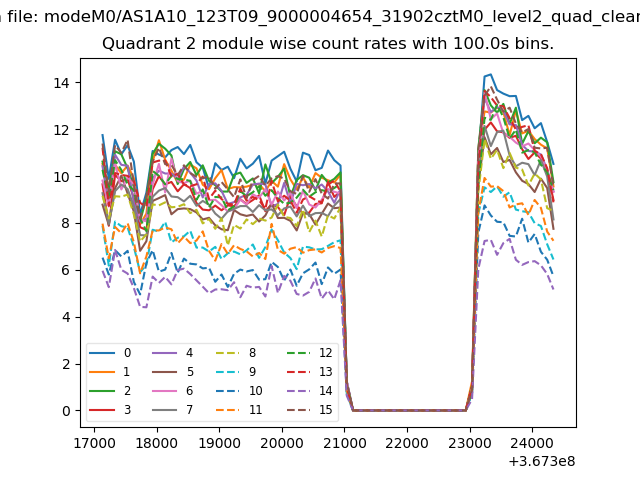
| Module-wise count rates for Quadrant B Data is divided into 100 sec bins |
 |
 |
| Module-wise count rates for Quadrant C Data is divided into 100 sec bins |
 |
 |
| Module-wise count rates for Quadrant D Data is divided into 100 sec bins |
 |
 |
| Parameter | Plot |
|---|---|
| CZT HV Monitor | 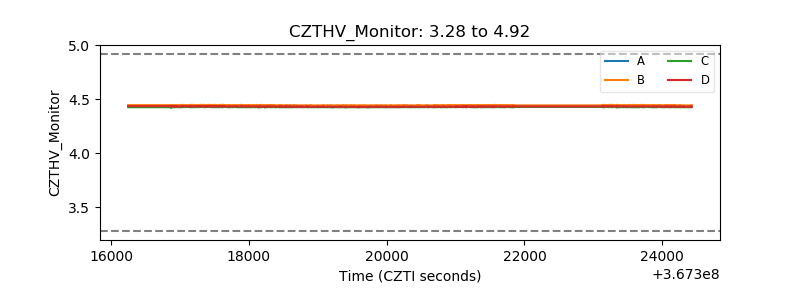 |
| D_VDD | 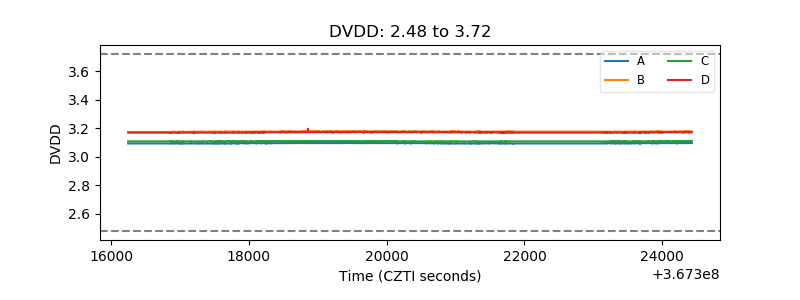 |
| Temperature 1 | 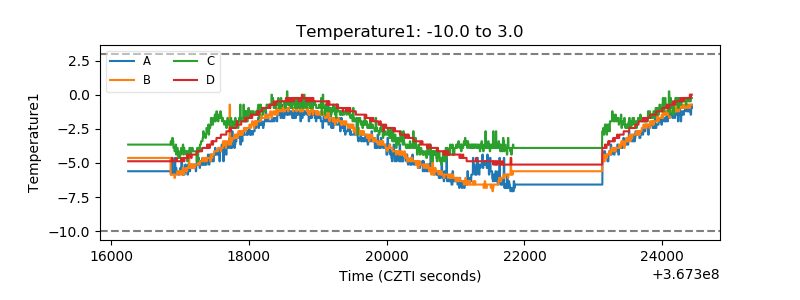 |
| Veto HV Monitor | 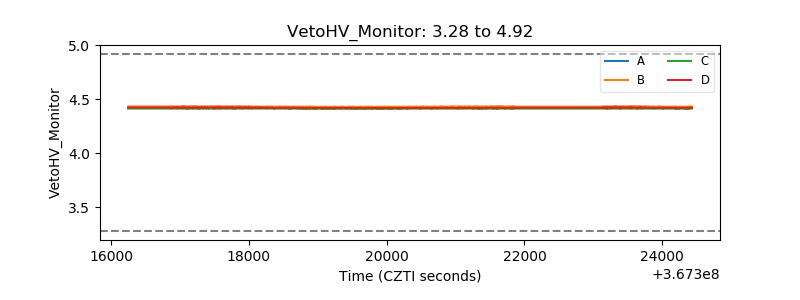 |
| Veto LLD | 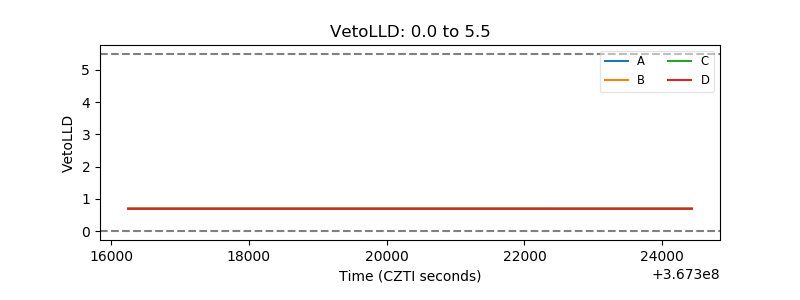 |
| Alpha Counter | 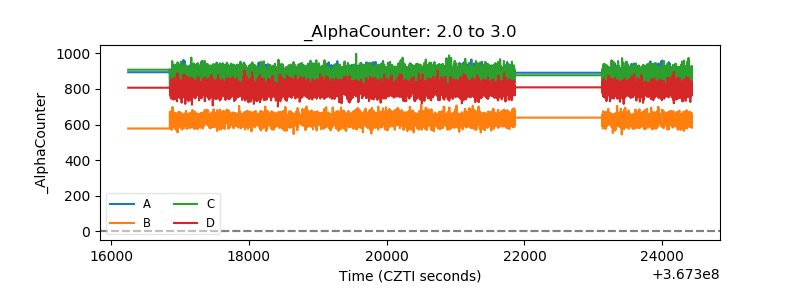 |
| _CPM_Rate | 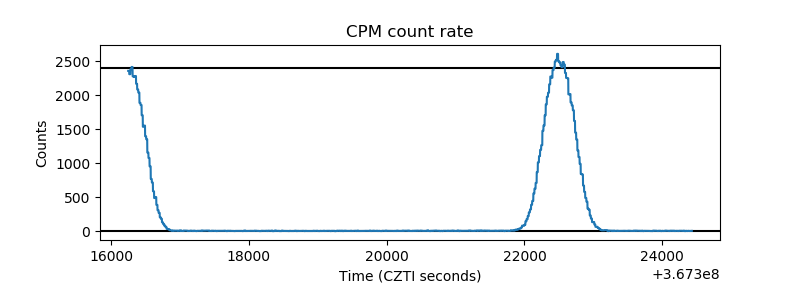 |
| CZT Counter | 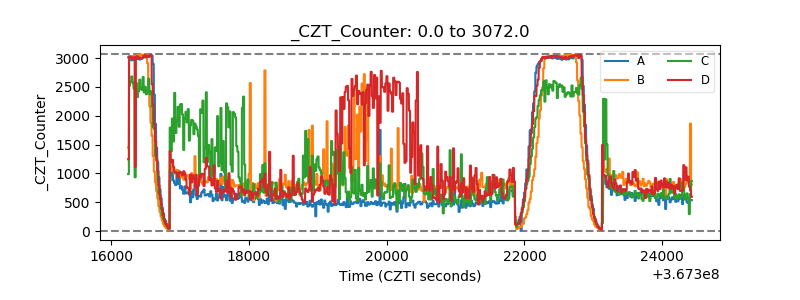 |
| +2.5 Volts monitor |  |
| +5 Volts monitor |  |
| _ROLL_ROT |  |
| _Roll_DEC |  |
| _Roll_RA | 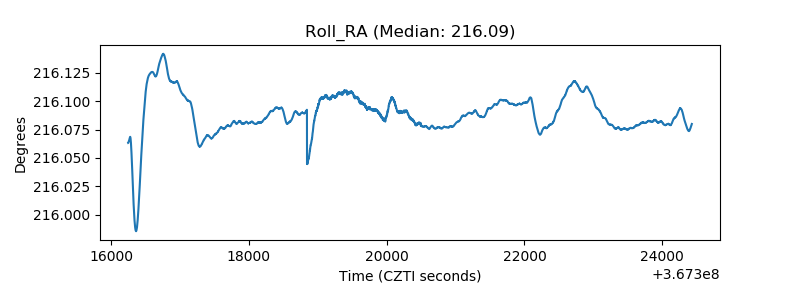 |
| Veto Counter | 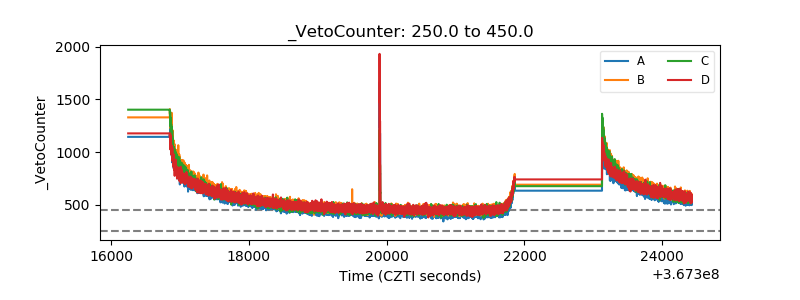 |