| Param | Original file | Final file |
|---|---|---|
| Filename | modeM0/AS1A10_123T09_9000004654_31904cztM0_level2.evt | modeM0/AS1A10_123T09_9000004654_31904cztM0_level2_quad_clean.evt |
| Size (bytes) | 820,353,600 | 86,198,400 |
| Size | 782.4 MB | 82.2 MB |
| Events in quadrant A | 3,019,205 | 673,433 |
| Events in quadrant B | 6,321,853 | 602,348 |
| Events in quadrant C | 3,661,301 | 603,909 |
| Events in quadrant D | 11,447,002 | 319,567 |
| Mode M0 | |||
|---|---|---|---|
| Quadrant | BADHDUFLAG | Total packets | Discarded packets |
| A | 0 | 12357 | 1 |
| B | 0 | 22779 | 1 |
| C | 0 | 14729 | 1 |
| D | 0 | 37979 | 1 |
| Mode SS | |||
|---|---|---|---|
| Quadrant | BADHDUFLAG | Total packets | Discarded packets |
| A | 0 | 120 | 0 |
| B | 0 | 120 | 0 |
| C | 0 | 120 | 0 |
| D | 0 | 120 | 0 |
| Mode M9 | |||
|---|---|---|---|
| Quadrant | BADHDUFLAG | Total packets | Discarded packets |
| A | 0 | 12 | 0 |
| B | 0 | 12 | 0 |
| C | 0 | 12 | 0 |
| D | 0 | 12 | 0 |
| Quadrant | Total seconds | Saturated seconds | Saturation percentage |
|---|---|---|---|
| A | 5852 | 93 | 1.589200% |
| B | 5852 | 766 | 13.089542% |
| C | 5852 | 404 | 6.903623% |
| D | 5852 | 3874 | 66.199590% |
Noise dominated data is calculated using 1-second bins in cleaned event files. If a bin has >2000 counts, and if more than 50% of those come from <1% of pixels, then it is considered to be noise-dominated and hence unusable.
| Quadrant | # 1 sec bins | Bins with >0 counts | Bins with >2000 counts | High rate bins dominated by noise | Noise dominated (total time) | Noise dominated (detector-on time) | Marked lightcurve |
|---|---|---|---|---|---|---|---|
| A | 7127 | 5853 | 0 | 0 | 0.00% | 0.00% | 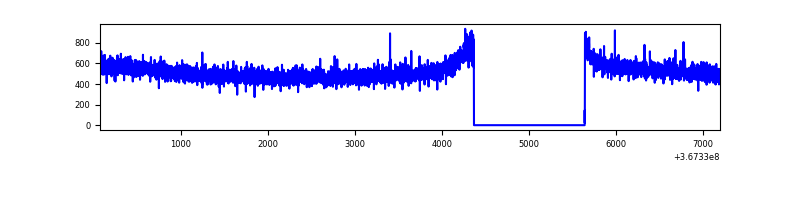 |
| B | 7127 | 5853 | 588 | 588 | 8.25% | 10.05% | 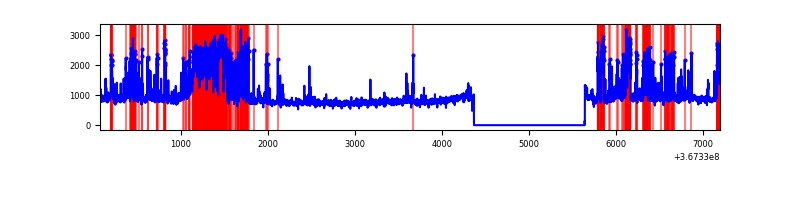 |
| C | 7127 | 5853 | 20 | 20 | 0.28% | 0.34% | 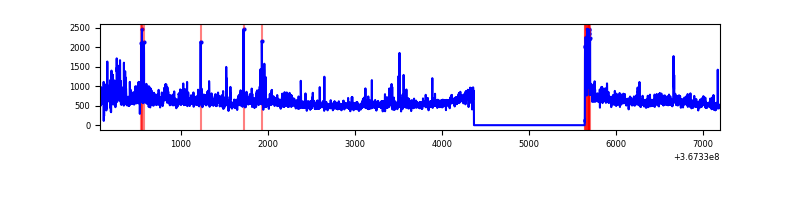 |
| D | 7127 | 5853 | 3663 | 3663 | 51.40% | 62.58% | 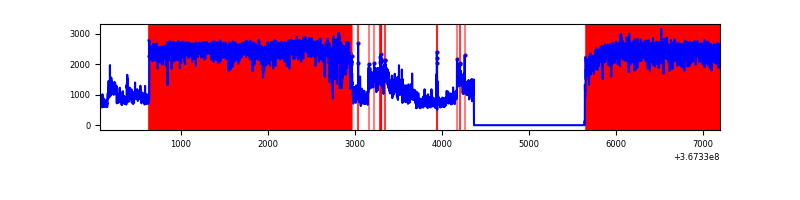 |
Top three noisy pixels from each quadrant. If the there are fewer than three noisy pixels in the level2.evt file, extra rows are filled as -1
| Pixel properties | Quadrant properties | ||||||
|---|---|---|---|---|---|---|---|
| Quadrant | DetID | PixID | Counts | Sigma | Mean | Median | Sigma |
| A | 13 | 254 | 12027 | 73.09 | 781 | 767 | 154.0 |
| A | 3 | 137 | 7018 | 40.58 | 781 | 767 | 154.0 |
| A | 0 | 226 | 6742 | 38.79 | 781 | 767 | 154.0 |
| B | 6 | 159 | 1608466 | 11857.36 | 727 | 711 | 135.6 |
| B | 5 | 172 | 969826 | 7147.32 | 727 | 711 | 135.6 |
| B | 15 | 222 | 431933 | 3180.31 | 727 | 711 | 135.6 |
| C | 3 | 233 | 349758 | 2096.98 | 723 | 732 | 166.4 |
| C | 14 | 238 | 184796 | 1105.88 | 723 | 732 | 166.4 |
| C | 0 | 10 | 168818 | 1009.88 | 723 | 732 | 166.4 |
| D | 12 | 33 | 8293755 | 68060.15 | 516 | 504 | 121.9 |
| D | 8 | 195 | 716099 | 5872.67 | 516 | 504 | 121.9 |
| D | 13 | 249 | 150110 | 1227.77 | 516 | 504 | 121.9 |
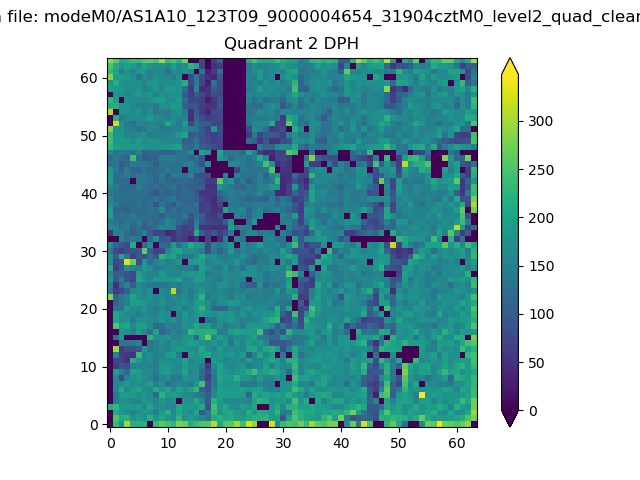
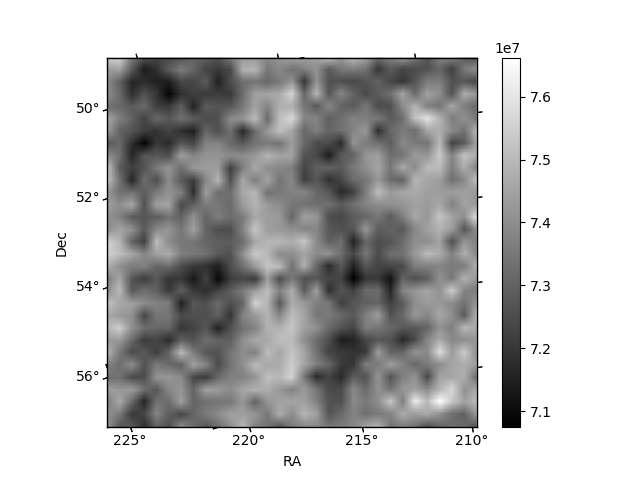
Histogram calculated using DETX and DETY for each event in the final _common_clean file
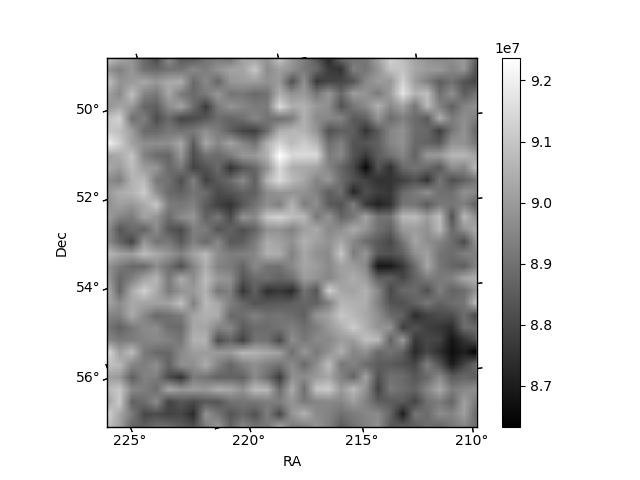
| Quadrant A | 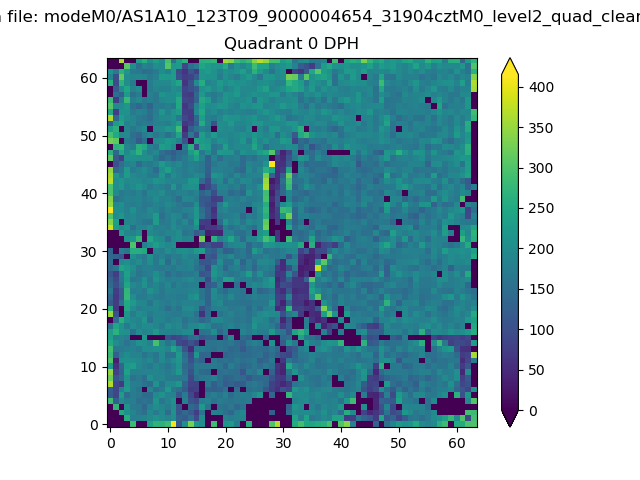 |
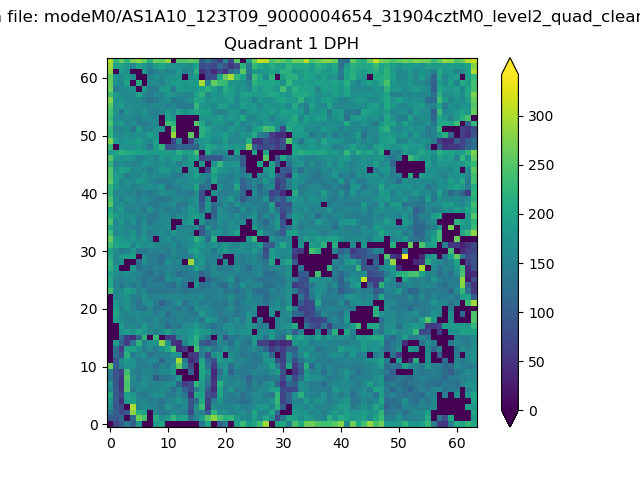 |
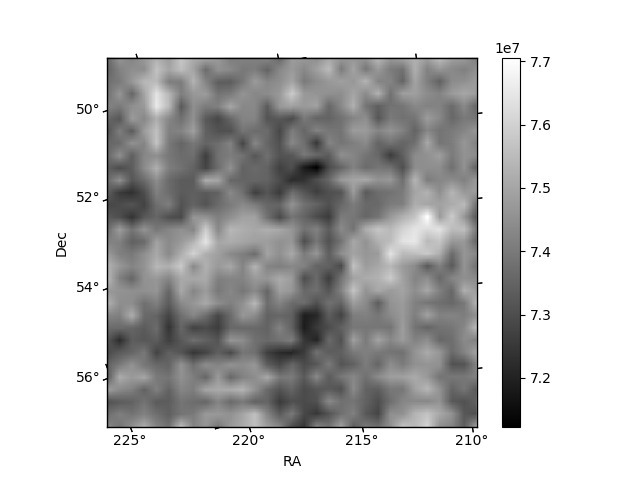
Quadrant B |
|---|---|---|---|
| Quadrant D | 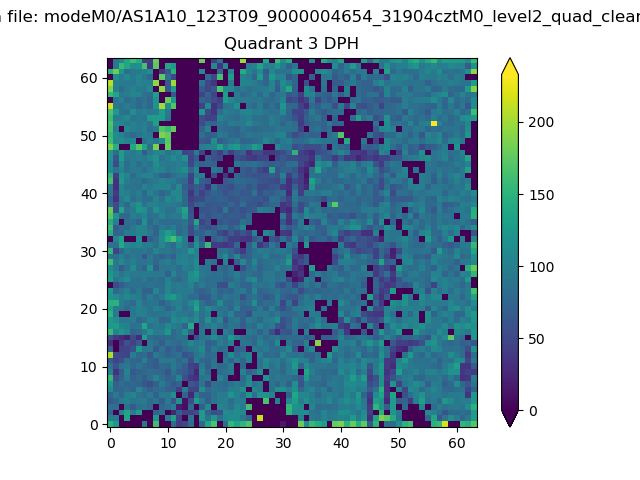 |
 |
Quadrant C |
| Plot type | Count rate plots | Images |
|---|---|---|
| Comparison with Poisson distribution Blue bars denote a histogram of data divided into 1 sec bins. Red curve is a Poisson curve with rate = median count rate of data. |
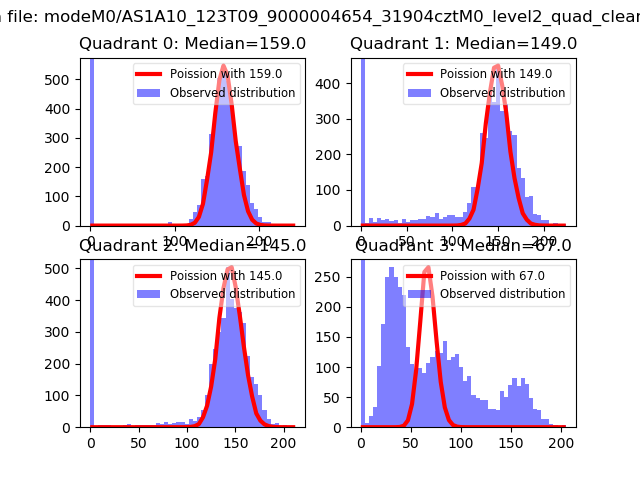 |
 |
| Quadrant-wise count rates Data is divided into 100 sec bins |
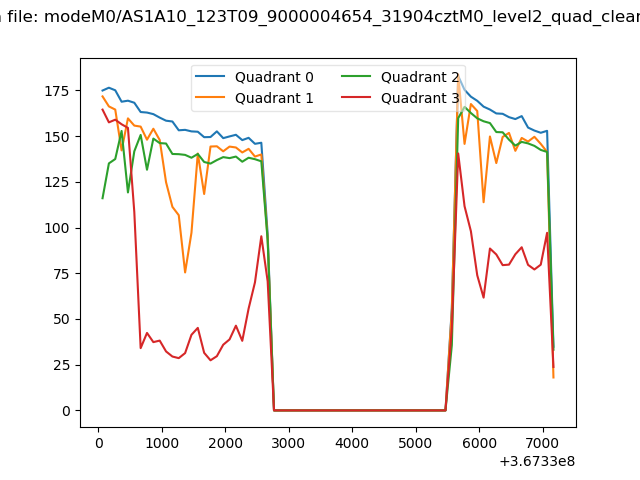 |
|
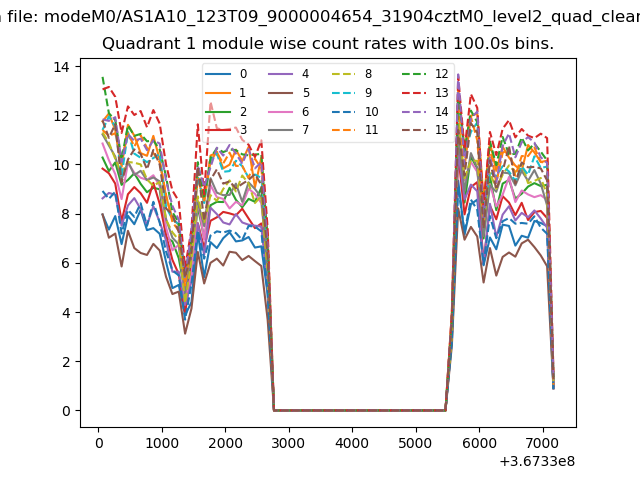
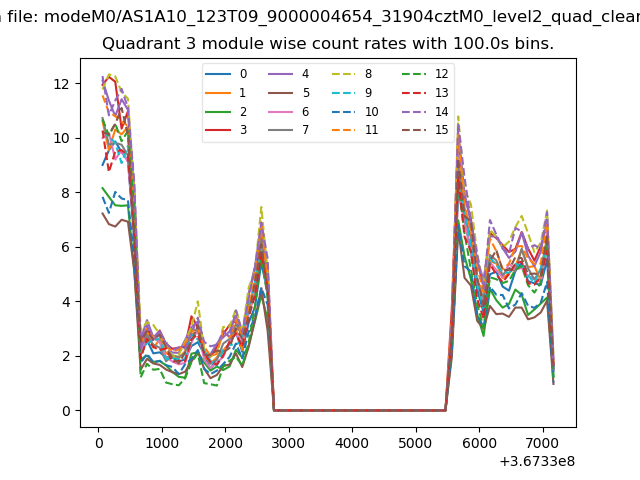
| Module-wise count rates for Quadrant A Data is divided into 100 sec bins |
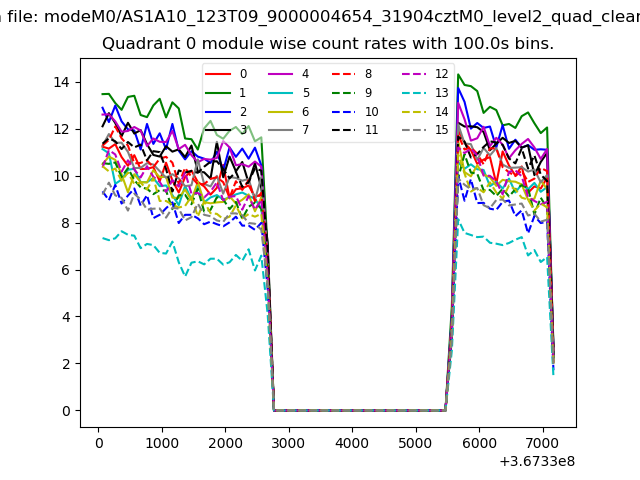 |
 |
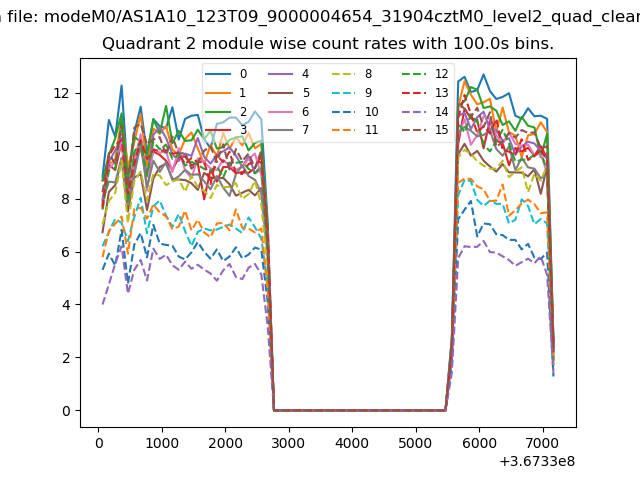
| Module-wise count rates for Quadrant B Data is divided into 100 sec bins |
 |
 |
| Module-wise count rates for Quadrant C Data is divided into 100 sec bins |
 |
 |
| Module-wise count rates for Quadrant D Data is divided into 100 sec bins |
 |
 |
| Parameter | Plot |
|---|---|
| CZT HV Monitor | 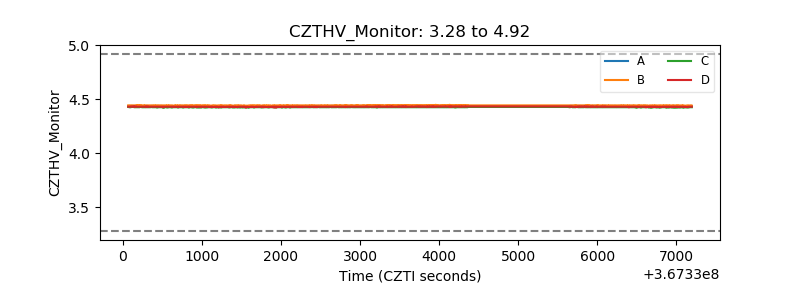 |
| D_VDD |  |
| Temperature 1 | 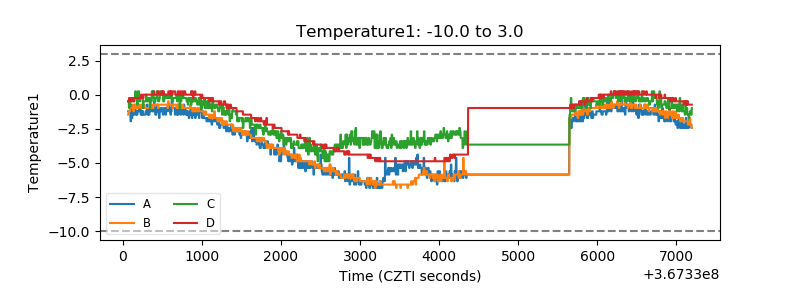 |
| Veto HV Monitor | 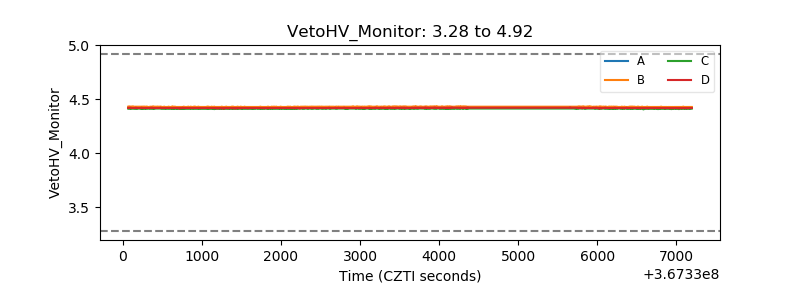 |
| Veto LLD | 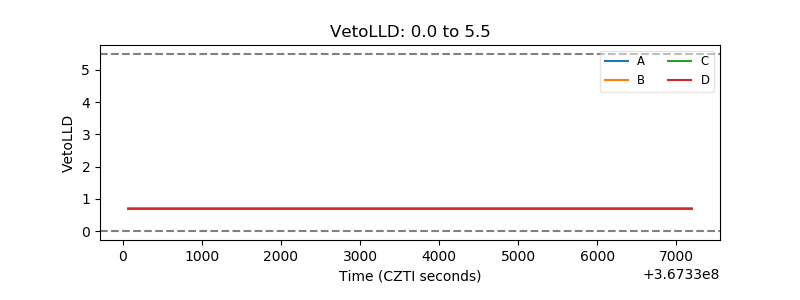 |
| Alpha Counter | 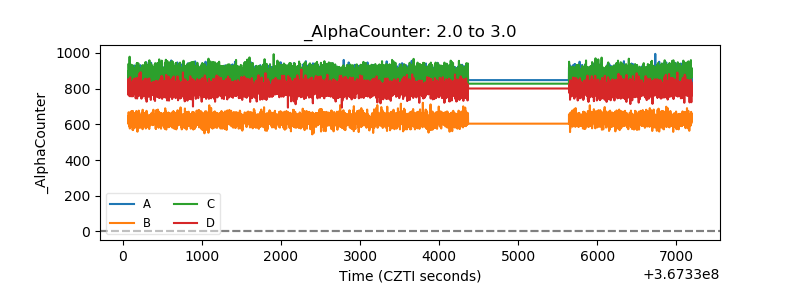 |
| _CPM_Rate | 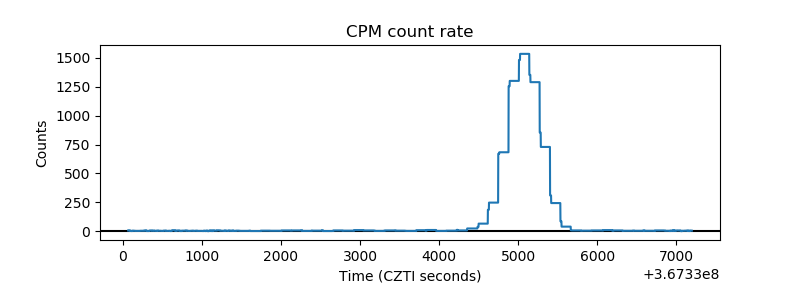 |
| CZT Counter | 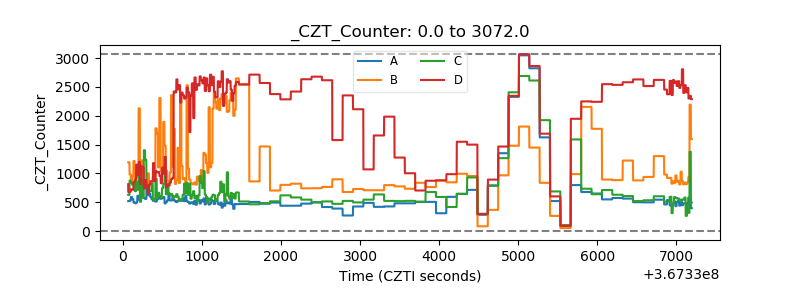 |
| +2.5 Volts monitor |  |
| +5 Volts monitor |  |
| _ROLL_ROT | 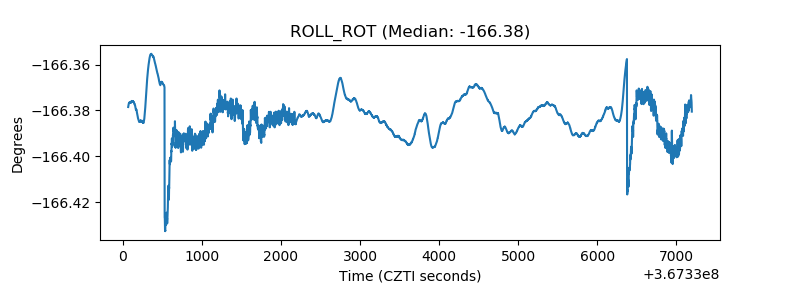 |
| _Roll_DEC | 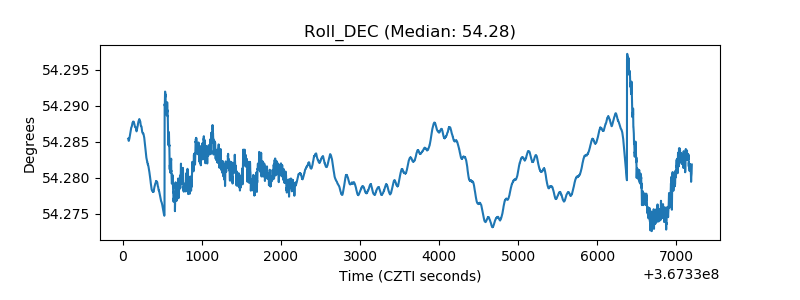 |
| _Roll_RA |  |
| Veto Counter |  |