| Param | Original file | Final file |
|---|---|---|
| Filename | modeM0/AS1A10_123T09_9000004654_31905cztM0_level2.evt | modeM0/AS1A10_123T09_9000004654_31905cztM0_level2_quad_clean.evt |
| Size (bytes) | 805,340,160 | 84,257,280 |
| Size | 768.0 MB | 80.4 MB |
| Events in quadrant A | 3,036,065 | 619,973 |
| Events in quadrant B | 7,357,047 | 507,148 |
| Events in quadrant C | 3,638,520 | 573,878 |
| Events in quadrant D | 9,947,091 | 423,536 |
| Mode M0 | |||
|---|---|---|---|
| Quadrant | BADHDUFLAG | Total packets | Discarded packets |
| A | 0 | 12683 | 1 |
| B | 0 | 26159 | 1 |
| C | 0 | 14608 | 4 |
| D | 0 | 33670 | 1 |
| Mode SS | |||
|---|---|---|---|
| Quadrant | BADHDUFLAG | Total packets | Discarded packets |
| A | 0 | 126 | 0 |
| B | 0 | 126 | 0 |
| C | 0 | 126 | 0 |
| D | 0 | 126 | 0 |
| Mode M9 | |||
|---|---|---|---|
| Quadrant | BADHDUFLAG | Total packets | Discarded packets |
| A | 0 | 11 | 0 |
| B | 0 | 11 | 0 |
| C | 0 | 11 | 0 |
| D | 0 | 11 | 0 |
| Quadrant | Total seconds | Saturated seconds | Saturation percentage |
|---|---|---|---|
| A | 6079 | 79 | 1.299556% |
| B | 6079 | 1512 | 24.872512% |
| C | 6078 | 410 | 6.745640% |
| D | 6079 | 2907 | 47.820365% |
Noise dominated data is calculated using 1-second bins in cleaned event files. If a bin has >2000 counts, and if more than 50% of those come from <1% of pixels, then it is considered to be noise-dominated and hence unusable.
| Quadrant | # 1 sec bins | Bins with >0 counts | Bins with >2000 counts | High rate bins dominated by noise | Noise dominated (total time) | Noise dominated (detector-on time) | Marked lightcurve |
|---|---|---|---|---|---|---|---|
| A | 7204 | 6080 | 0 | 0 | 0.00% | 0.00% |  |
| B | 7204 | 6080 | 1124 | 1124 | 15.60% | 18.49% | 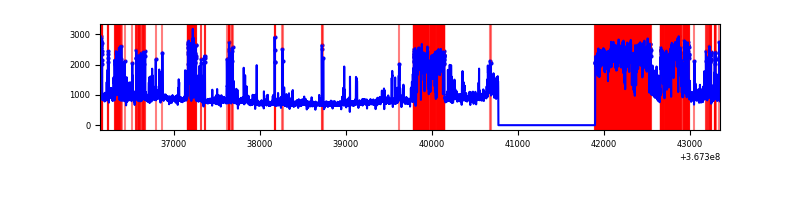 |
| C | 7203 | 6079 | 16 | 16 | 0.22% | 0.26% | 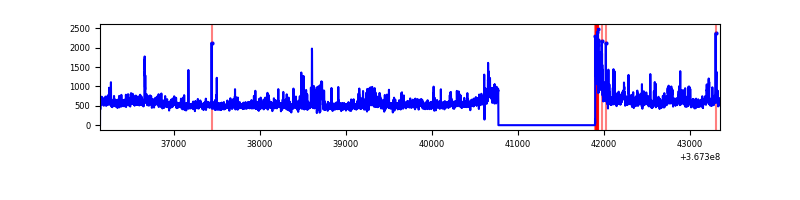 |
| D | 7204 | 6080 | 2876 | 2876 | 39.92% | 47.30% | 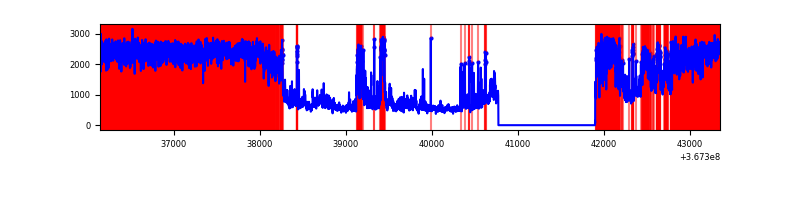 |
Top three noisy pixels from each quadrant. If the there are fewer than three noisy pixels in the level2.evt file, extra rows are filled as -1
| Pixel properties | Quadrant properties | ||||||
|---|---|---|---|---|---|---|---|
| Quadrant | DetID | PixID | Counts | Sigma | Mean | Median | Sigma |
| A | 15 | 174 | 16060 | 99.14 | 781 | 765 | 154.3 |
| A | 13 | 254 | 12440 | 75.68 | 781 | 765 | 154.3 |
| A | 3 | 137 | 7351 | 42.69 | 781 | 765 | 154.3 |
| B | 6 | 159 | 1632370 | 12969.32 | 672 | 654 | 125.8 |
| B | 5 | 172 | 1494486 | 11873.38 | 672 | 654 | 125.8 |
| B | 4 | 80 | 1330708 | 10571.63 | 672 | 654 | 125.8 |
| C | 3 | 233 | 271846 | 1596.47 | 731 | 736 | 169.8 |
| C | 14 | 238 | 193390 | 1134.47 | 731 | 736 | 169.8 |
| C | 0 | 10 | 182168 | 1068.39 | 731 | 736 | 169.8 |
| D | 12 | 33 | 5484224 | 35640.83 | 647 | 630 | 153.9 |
| D | 8 | 195 | 816347 | 5301.78 | 647 | 630 | 153.9 |
| D | 12 | 233 | 604751 | 3926.51 | 647 | 630 | 153.9 |
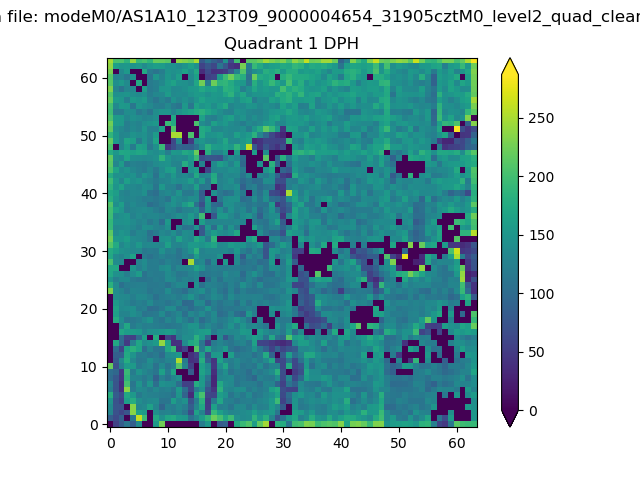
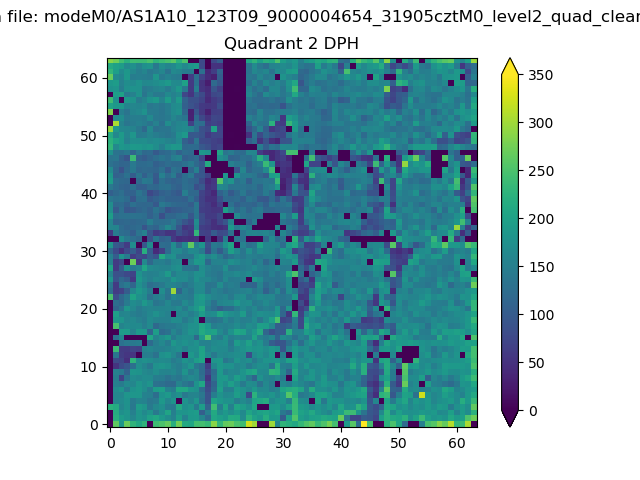
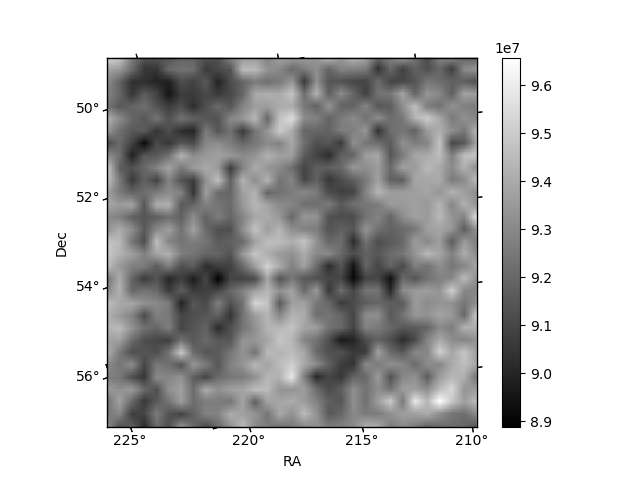
Histogram calculated using DETX and DETY for each event in the final _common_clean file
| Quadrant A | 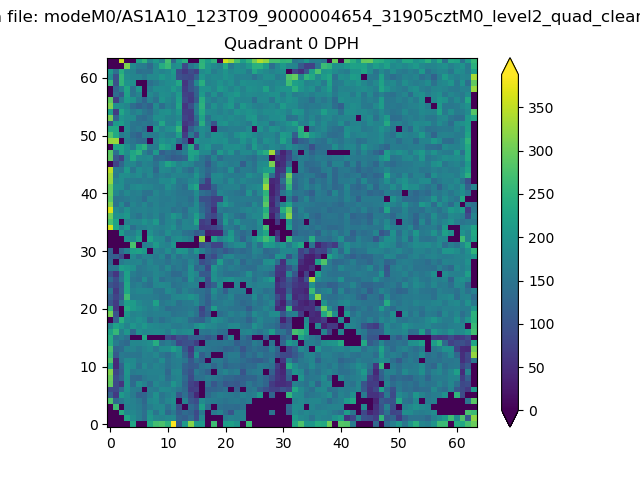 |
 |
Quadrant B |
|---|---|---|---|
| Quadrant D | 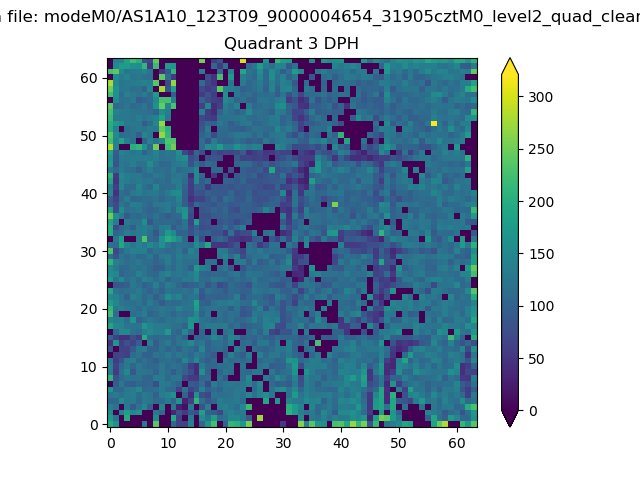 |
 |
Quadrant C |
| Plot type | Count rate plots | Images |
|---|---|---|
| Comparison with Poisson distribution Blue bars denote a histogram of data divided into 1 sec bins. Red curve is a Poisson curve with rate = median count rate of data. |
 |
 |
| Quadrant-wise count rates Data is divided into 100 sec bins |
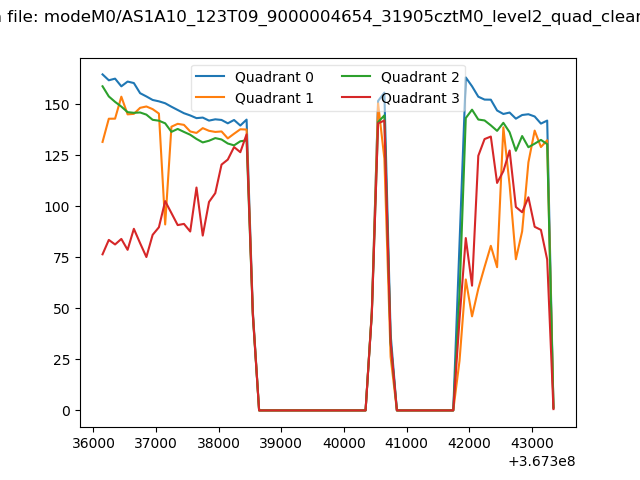 |
|
| Module-wise count rates for Quadrant A Data is divided into 100 sec bins |
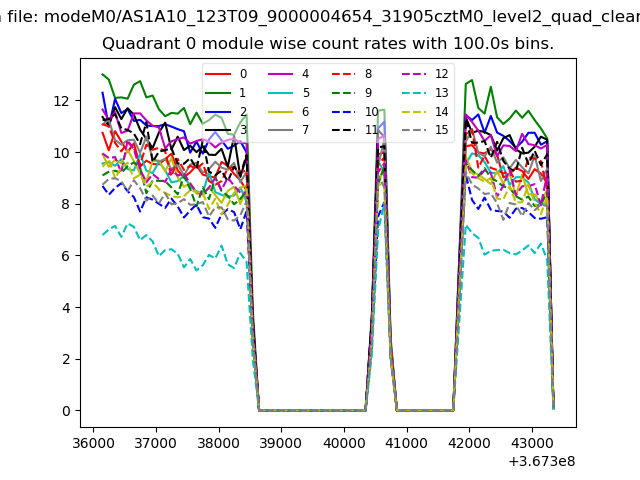 |
 |
| Module-wise count rates for Quadrant B Data is divided into 100 sec bins |
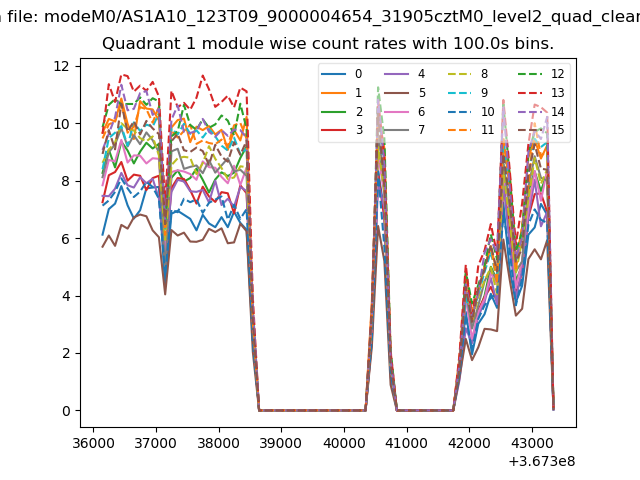 |
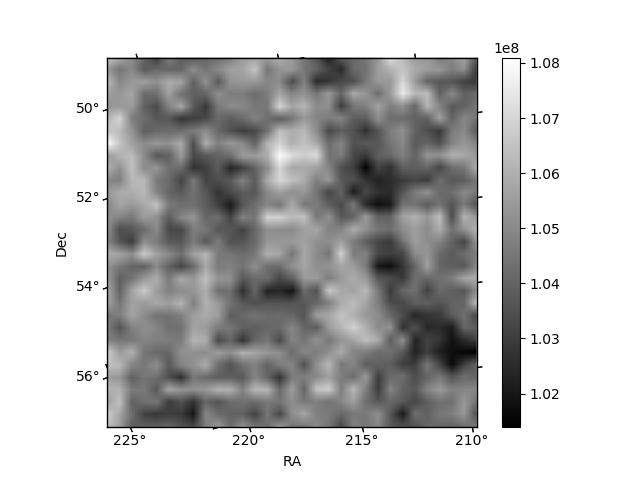 |
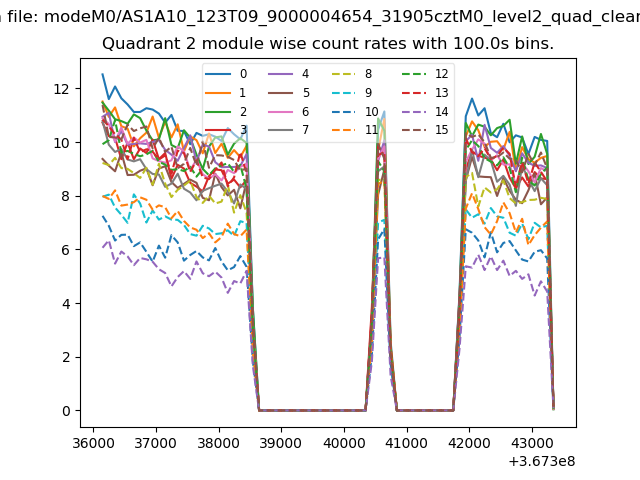
| Module-wise count rates for Quadrant C Data is divided into 100 sec bins |
 |
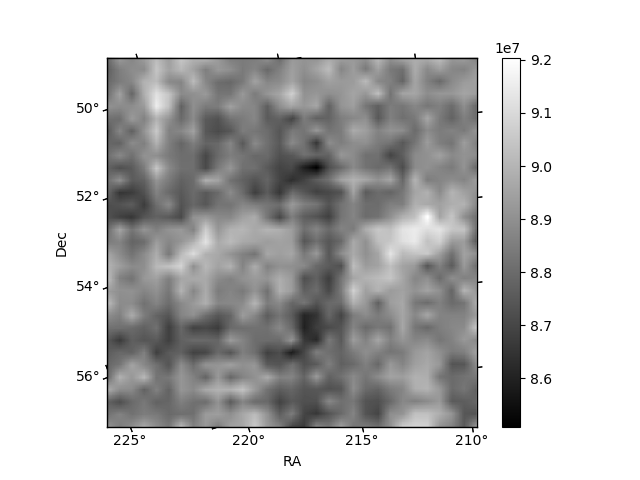 |
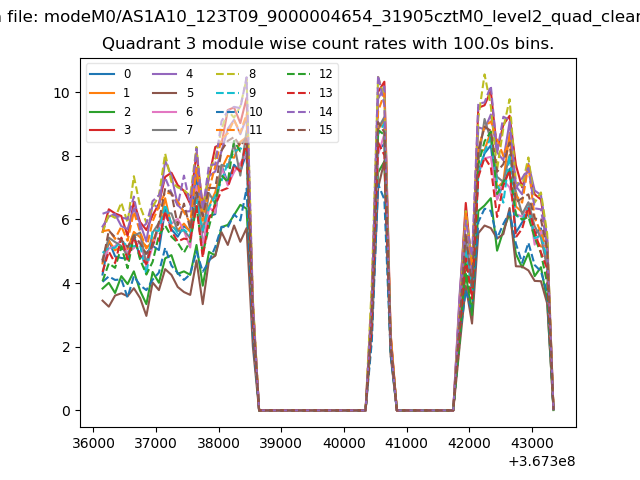
| Module-wise count rates for Quadrant D Data is divided into 100 sec bins |
 |
 |
| Parameter | Plot |
|---|---|
| CZT HV Monitor | 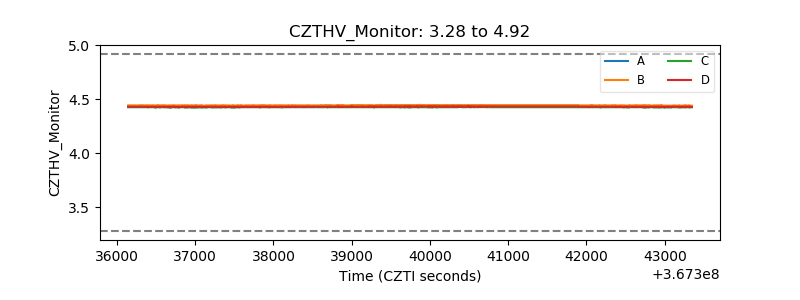 |
| D_VDD | 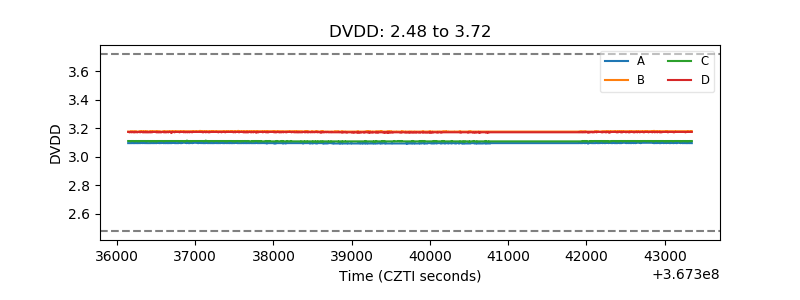 |
| Temperature 1 | 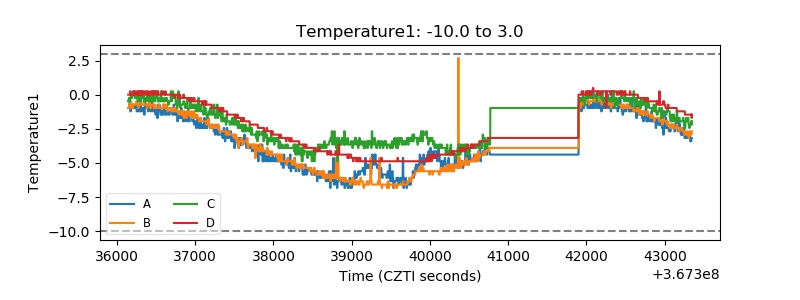 |
| Veto HV Monitor |  |
| Veto LLD | 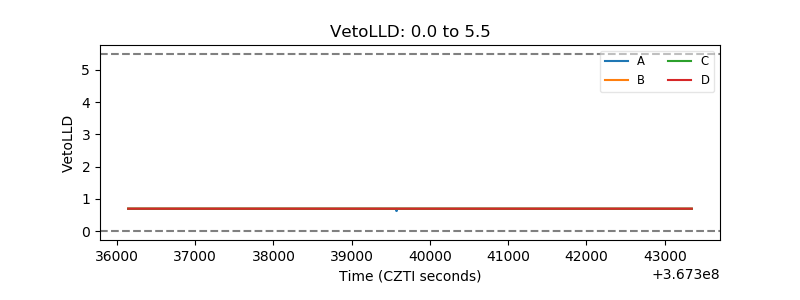 |
| Alpha Counter | 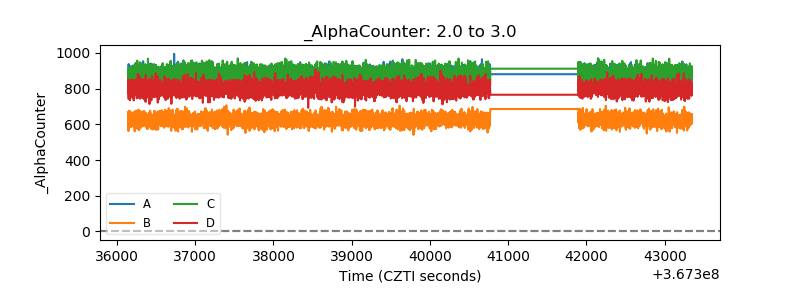 |
| _CPM_Rate | 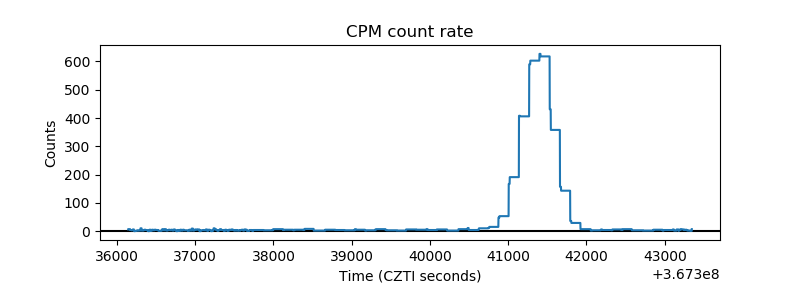 |
| CZT Counter | 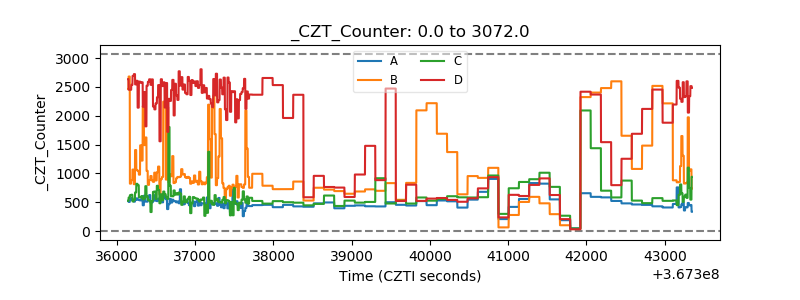 |
| +2.5 Volts monitor |  |
| +5 Volts monitor |  |
| _ROLL_ROT |  |
| _Roll_DEC | 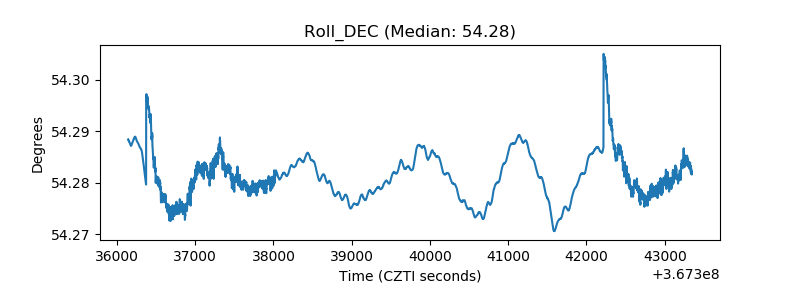 |
| _Roll_RA | 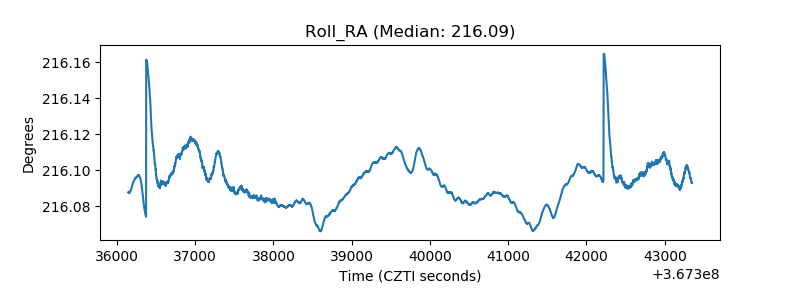 |
| Veto Counter | 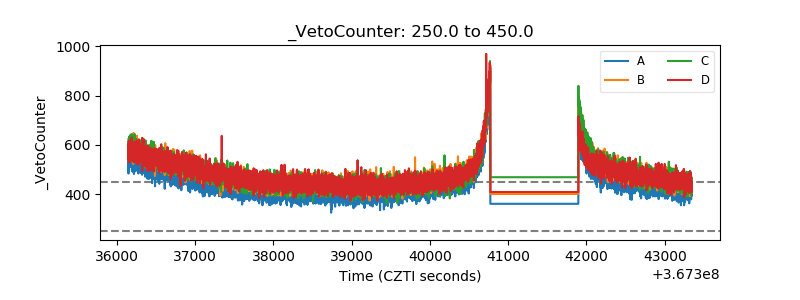 |