| Param | Original file | Final file |
|---|---|---|
| Filename | modeM0/AS1A10_123T09_9000004654_31906cztM0_level2.evt | modeM0/AS1A10_123T09_9000004654_31906cztM0_level2_quad_clean.evt |
| Size (bytes) | 1,057,694,400 | 84,041,280 |
| Size | 1008.7 MB | 80.1 MB |
| Events in quadrant A | 3,135,788 | 644,708 |
| Events in quadrant B | 11,501,321 | 454,008 |
| Events in quadrant C | 3,935,146 | 598,644 |
| Events in quadrant D | 13,021,657 | 390,127 |
| Mode M0 | |||
|---|---|---|---|
| Quadrant | BADHDUFLAG | Total packets | Discarded packets |
| A | 0 | 13452 | 1 |
| B | 0 | 38773 | 1 |
| C | 0 | 15828 | 1 |
| D | 0 | 43159 | 1 |
| Mode SS | |||
|---|---|---|---|
| Quadrant | BADHDUFLAG | Total packets | Discarded packets |
| A | 0 | 132 | 0 |
| B | 0 | 132 | 0 |
| C | 0 | 132 | 0 |
| D | 0 | 132 | 0 |
| Mode M9 | |||
|---|---|---|---|
| Quadrant | BADHDUFLAG | Total packets | Discarded packets |
| A | 0 | 8 | 0 |
| B | 0 | 8 | 0 |
| C | 0 | 8 | 0 |
| D | 0 | 8 | 0 |
| Quadrant | Total seconds | Saturated seconds | Saturation percentage |
|---|---|---|---|
| A | 6520 | 66 | 1.012270% |
| B | 6520 | 3629 | 55.659509% |
| C | 6521 | 276 | 4.232480% |
| D | 6521 | 3849 | 59.024689% |
Noise dominated data is calculated using 1-second bins in cleaned event files. If a bin has >2000 counts, and if more than 50% of those come from <1% of pixels, then it is considered to be noise-dominated and hence unusable.
| Quadrant | # 1 sec bins | Bins with >0 counts | Bins with >2000 counts | High rate bins dominated by noise | Noise dominated (total time) | Noise dominated (detector-on time) | Marked lightcurve |
|---|---|---|---|---|---|---|---|
| A | 7295 | 6521 | 0 | 0 | 0.00% | 0.00% |  |
| B | 7295 | 6521 | 3282 | 3282 | 44.99% | 50.33% | 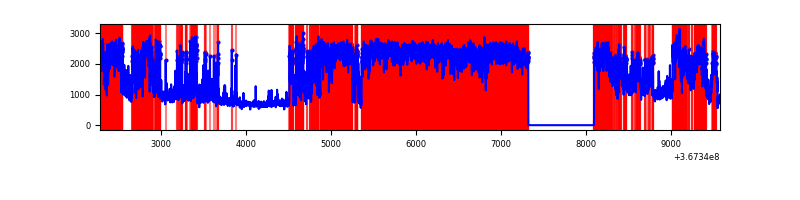 |
| C | 7296 | 6522 | 29 | 29 | 0.40% | 0.44% | 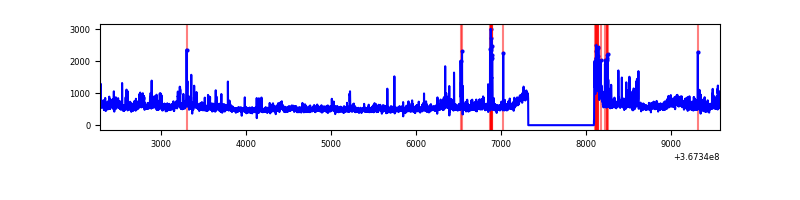 |
| D | 7296 | 6522 | 3813 | 3813 | 52.26% | 58.46% | 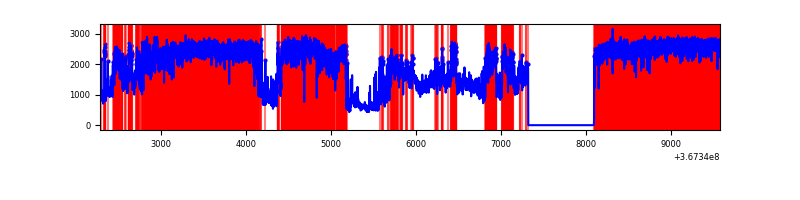 |
Top three noisy pixels from each quadrant. If the there are fewer than three noisy pixels in the level2.evt file, extra rows are filled as -1
| Pixel properties | Quadrant properties | ||||||
|---|---|---|---|---|---|---|---|
| Quadrant | DetID | PixID | Counts | Sigma | Mean | Median | Sigma |
| A | 13 | 254 | 12242 | 70.81 | 809 | 794 | 161.7 |
| A | 13 | 6 | 9957 | 56.67 | 809 | 794 | 161.7 |
| A | 3 | 137 | 7874 | 43.79 | 809 | 794 | 161.7 |
| B | 4 | 80 | 6109079 | 58708.65 | 561 | 547 | 104.0 |
| B | 6 | 159 | 1492017 | 14334.41 | 561 | 547 | 104.0 |
| B | 5 | 172 | 1154229 | 11087.95 | 561 | 547 | 104.0 |
| C | 3 | 233 | 393878 | 2178.88 | 771 | 776 | 180.4 |
| C | 0 | 10 | 334482 | 1849.66 | 771 | 776 | 180.4 |
| C | 14 | 238 | 140217 | 772.89 | 771 | 776 | 180.4 |
| D | 12 | 33 | 8844437 | 62400.7 | 593 | 578 | 141.7 |
| D | 8 | 195 | 872620 | 6152.97 | 593 | 578 | 141.7 |
| D | 7 | 38 | 276035 | 1943.58 | 593 | 578 | 141.7 |
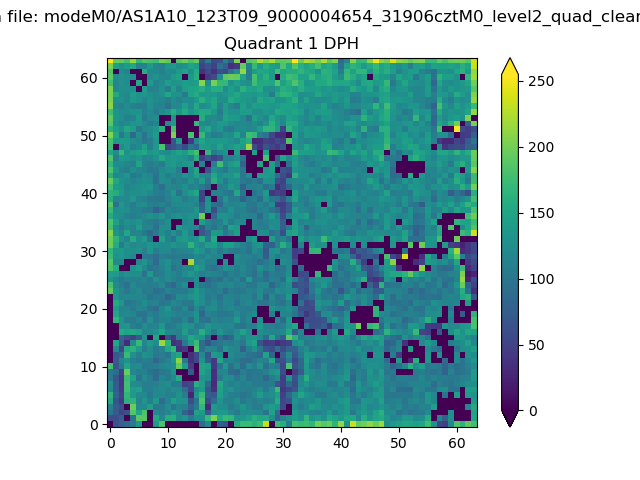
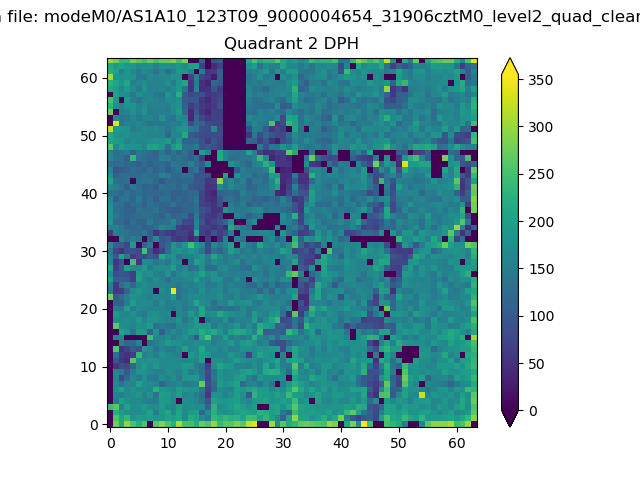
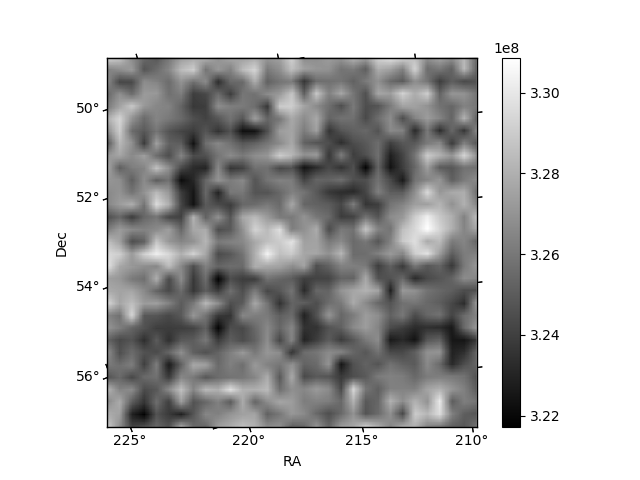
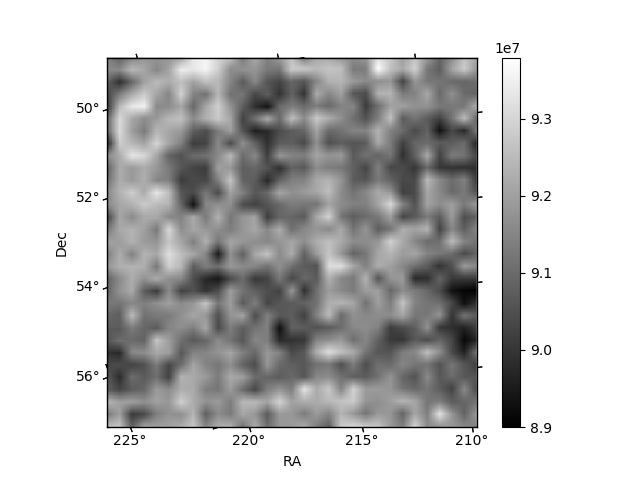
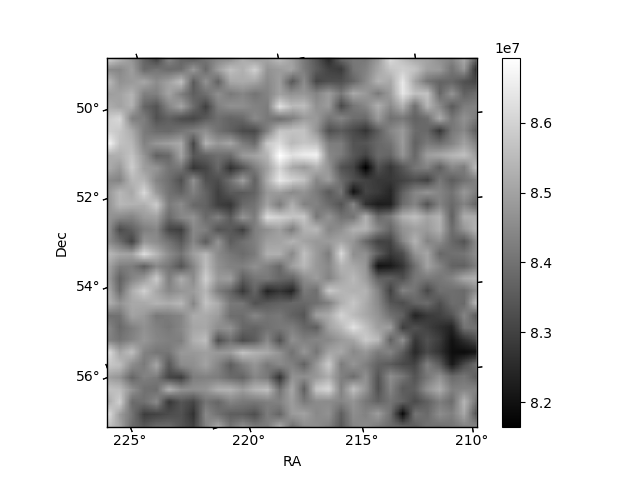
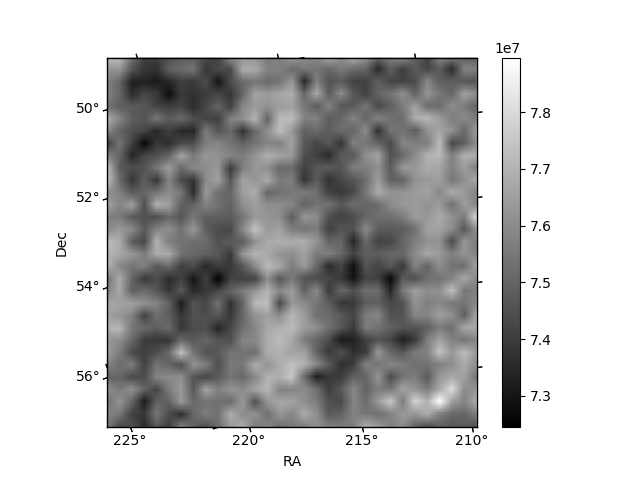
Histogram calculated using DETX and DETY for each event in the final _common_clean file
| Quadrant A | 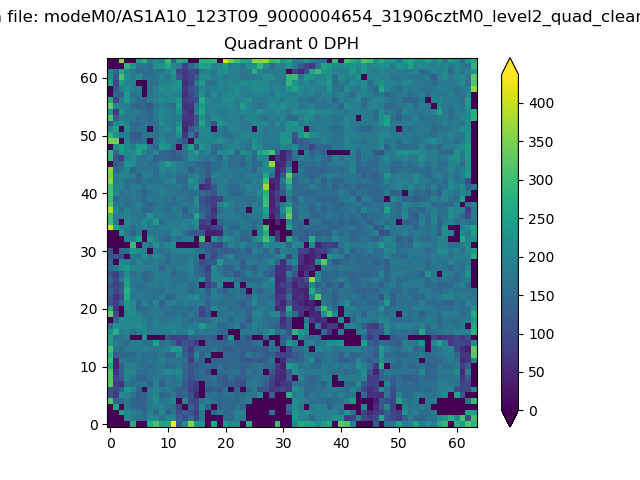 |
 |
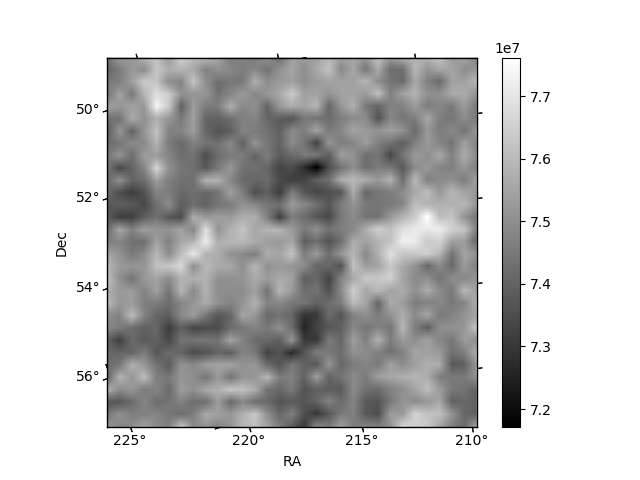
Quadrant B |
|---|---|---|---|
| Quadrant D | 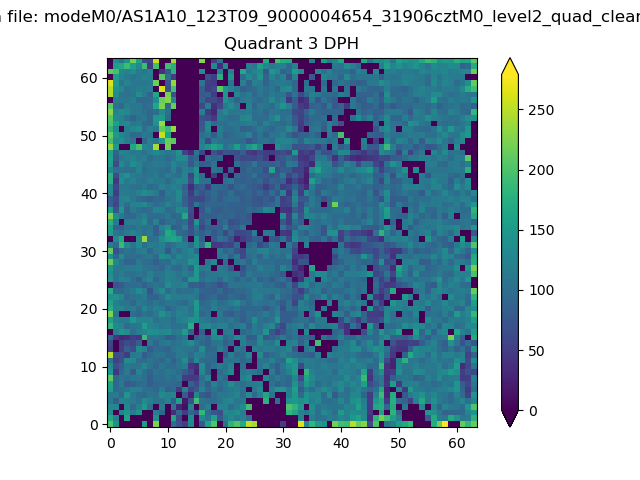 |
 |
Quadrant C |
| Plot type | Count rate plots | Images |
|---|---|---|
| Comparison with Poisson distribution Blue bars denote a histogram of data divided into 1 sec bins. Red curve is a Poisson curve with rate = median count rate of data. |
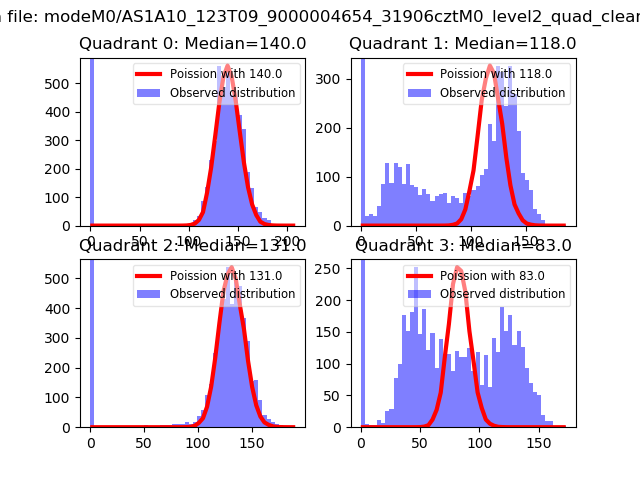 |
 |
| Quadrant-wise count rates Data is divided into 100 sec bins |
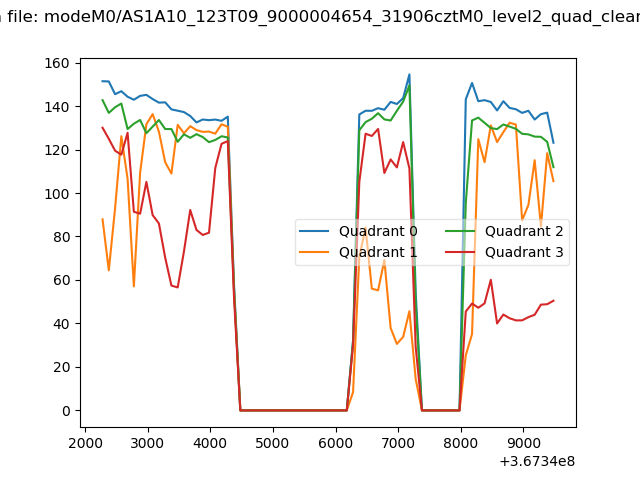 |
|
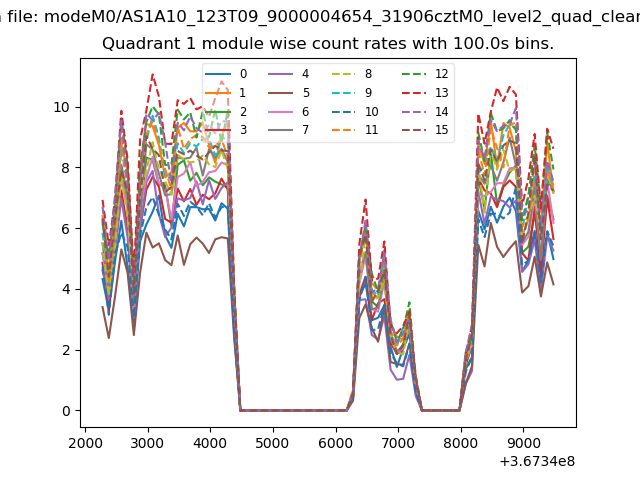
| Module-wise count rates for Quadrant A Data is divided into 100 sec bins |
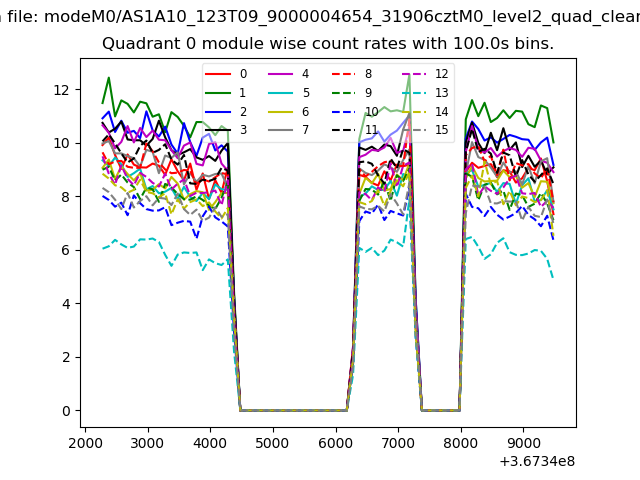 |
 |
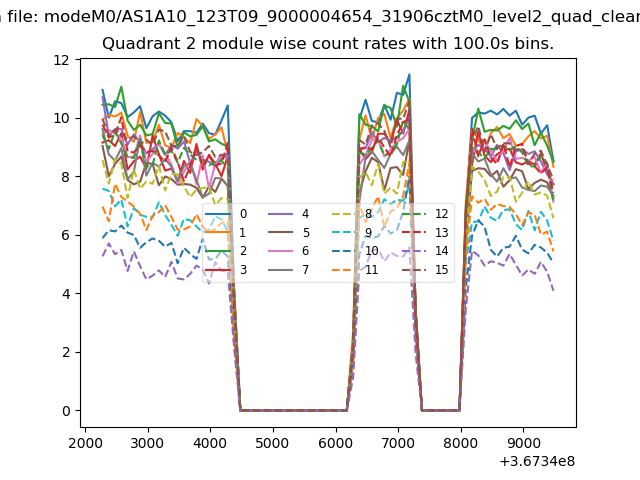
| Module-wise count rates for Quadrant B Data is divided into 100 sec bins |
 |
 |
| Module-wise count rates for Quadrant C Data is divided into 100 sec bins |
 |
 |
| Module-wise count rates for Quadrant D Data is divided into 100 sec bins |
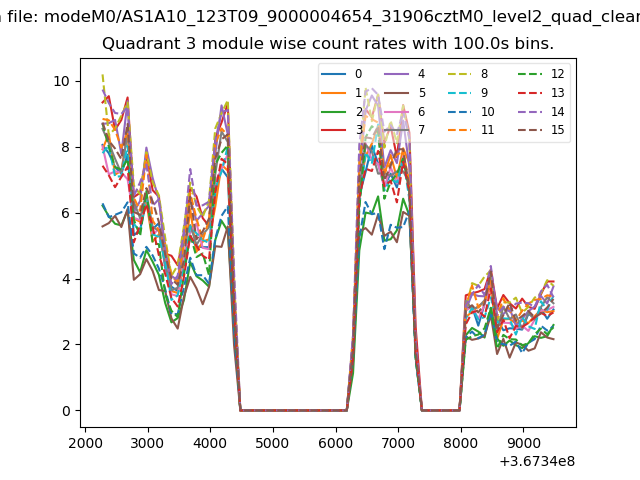 |
 |
| Parameter | Plot |
|---|---|
| CZT HV Monitor | 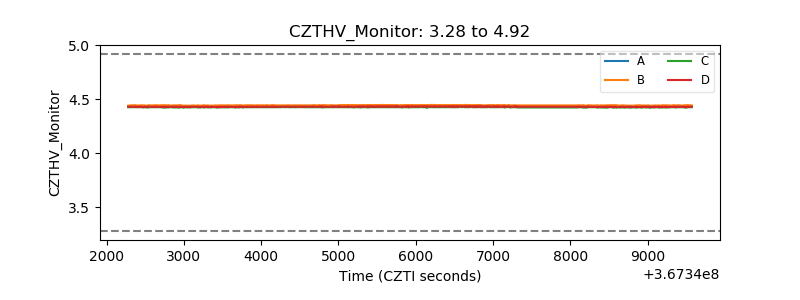 |
| D_VDD | 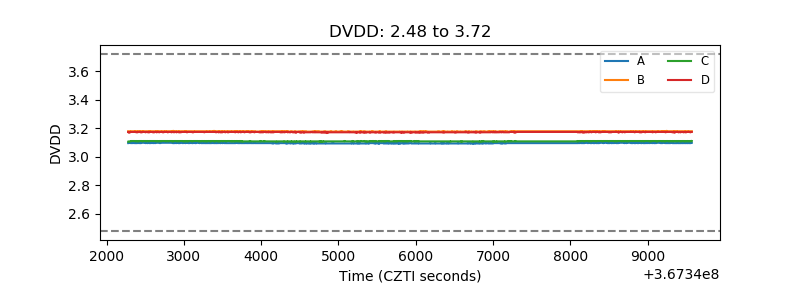 |
| Temperature 1 | 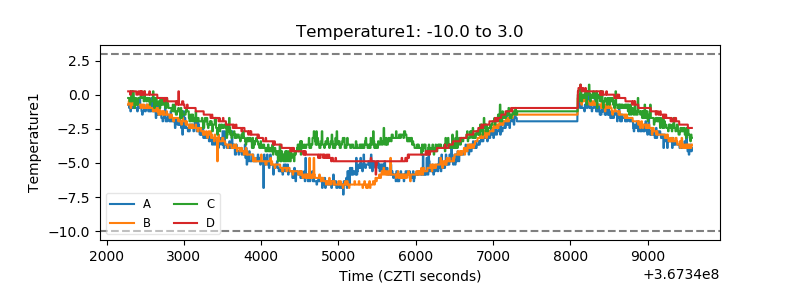 |
| Veto HV Monitor | 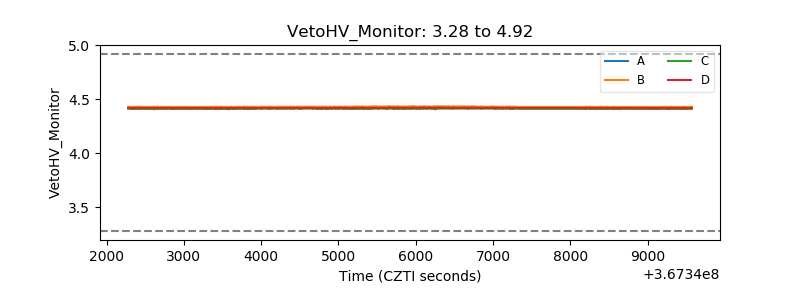 |
| Veto LLD | 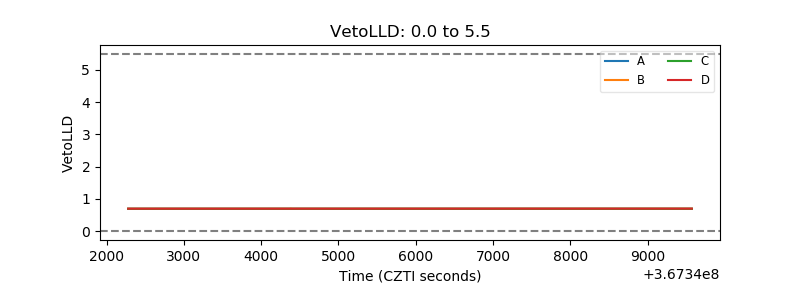 |
| Alpha Counter | 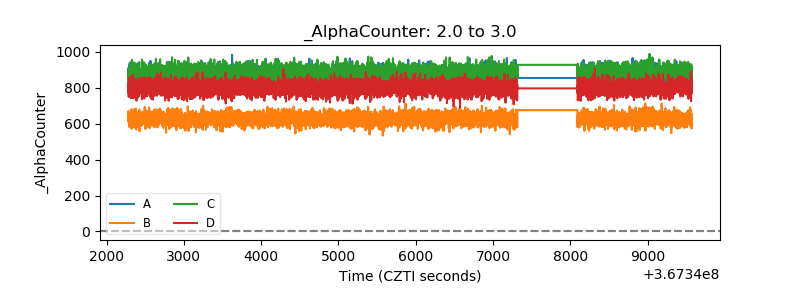 |
| _CPM_Rate | 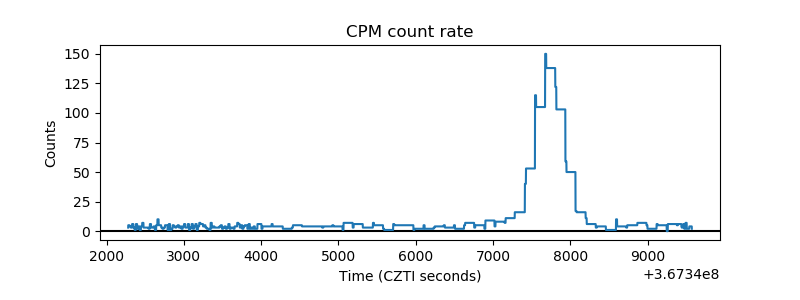 |
| CZT Counter | 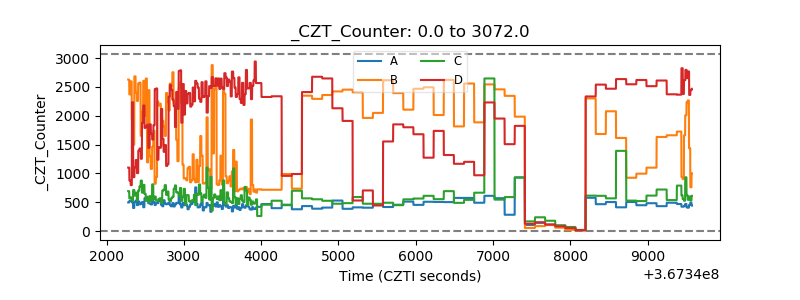 |
| +2.5 Volts monitor | 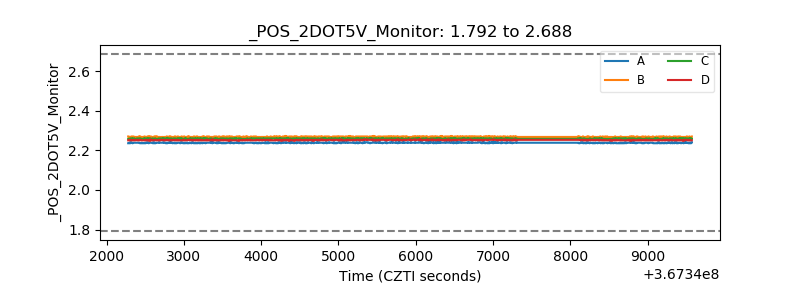 |
| +5 Volts monitor |  |
| _ROLL_ROT | 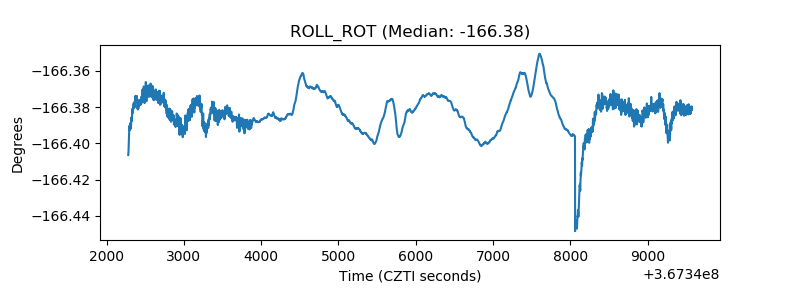 |
| _Roll_DEC | 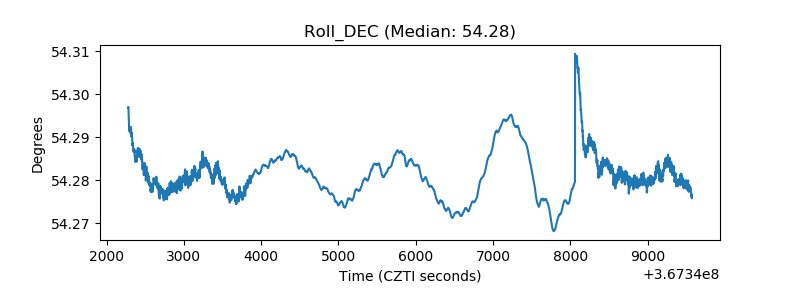 |
| _Roll_RA | 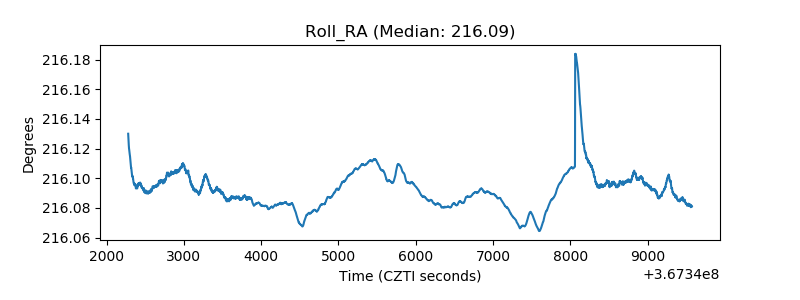 |
| Veto Counter | 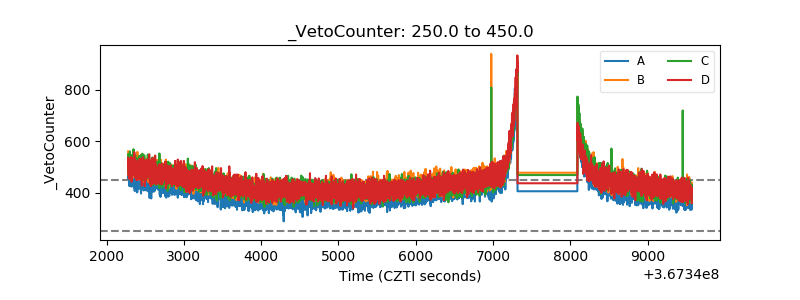 |