| Param | Original file | Final file |
|---|---|---|
| Filename | modeM0/AS1A10_123T09_9000004654_31908cztM0_level2.evt | modeM0/AS1A10_123T09_9000004654_31908cztM0_level2_quad_clean.evt |
| Size (bytes) | 995,166,720 | 102,047,040 |
| Size | 949.1 MB | 97.3 MB |
| Events in quadrant A | 3,657,073 | 726,904 |
| Events in quadrant B | 6,998,286 | 682,356 |
| Events in quadrant C | 5,542,008 | 659,041 |
| Events in quadrant D | 13,435,424 | 496,939 |
| Mode M0 | |||
|---|---|---|---|
| Quadrant | BADHDUFLAG | Total packets | Discarded packets |
| A | 0 | 15800 | 2 |
| B | 0 | 26412 | 2 |
| C | 0 | 21517 | 2 |
| D | 0 | 45144 | 3 |
| Mode SS | |||
|---|---|---|---|
| Quadrant | BADHDUFLAG | Total packets | Discarded packets |
| A | 0 | 154 | 0 |
| B | 0 | 154 | 0 |
| C | 0 | 154 | 0 |
| D | 0 | 154 | 0 |
| Mode M9 | |||
|---|---|---|---|
| Quadrant | BADHDUFLAG | Total packets | Discarded packets |
| A | 0 | 4 | 0 |
| B | 0 | 5 | 0 |
| C | 0 | 5 | 0 |
| D | 0 | 5 | 0 |
| Quadrant | Total seconds | Saturated seconds | Saturation percentage |
|---|---|---|---|
| A | 7512 | 65 | 0.865282% |
| B | 7512 | 600 | 7.987220% |
| C | 7512 | 647 | 8.612886% |
| D | 7511 | 3825 | 50.925310% |
Noise dominated data is calculated using 1-second bins in cleaned event files. If a bin has >2000 counts, and if more than 50% of those come from <1% of pixels, then it is considered to be noise-dominated and hence unusable.
| Quadrant | # 1 sec bins | Bins with >0 counts | Bins with >2000 counts | High rate bins dominated by noise | Noise dominated (total time) | Noise dominated (detector-on time) | Marked lightcurve |
|---|---|---|---|---|---|---|---|
| A | 7807 | 7514 | 34 | 34 | 0.44% | 0.45% |  |
| B | 7807 | 7514 | 291 | 291 | 3.73% | 3.87% | 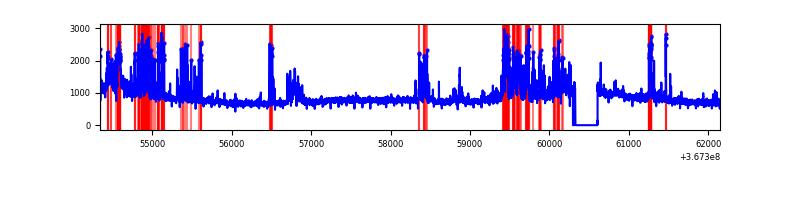 |
| C | 7807 | 7514 | 200 | 200 | 2.56% | 2.66% | 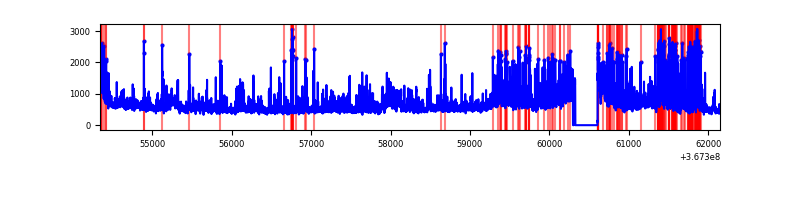 |
| D | 7806 | 7513 | 3846 | 3846 | 49.27% | 51.19% | 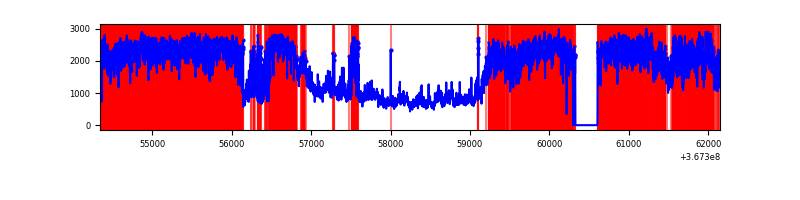 |
Top three noisy pixels from each quadrant. If the there are fewer than three noisy pixels in the level2.evt file, extra rows are filled as -1
| Pixel properties | Quadrant properties | ||||||
|---|---|---|---|---|---|---|---|
| Quadrant | DetID | PixID | Counts | Sigma | Mean | Median | Sigma |
| A | 15 | 174 | 120127 | 651.23 | 913 | 890 | 183.1 |
| A | 13 | 254 | 15679 | 80.77 | 913 | 890 | 183.1 |
| A | 13 | 6 | 9393 | 46.44 | 913 | 890 | 183.1 |
| B | 6 | 159 | 2238645 | 13388.65 | 882 | 860 | 167.1 |
| B | 5 | 172 | 584398 | 3491.3 | 882 | 860 | 167.1 |
| B | 4 | 80 | 285199 | 1701.2 | 882 | 860 | 167.1 |
| C | 0 | 10 | 1611436 | 7999.19 | 853 | 856 | 201.3 |
| C | 3 | 233 | 370710 | 1836.94 | 853 | 856 | 201.3 |
| C | 14 | 238 | 148433 | 732.96 | 853 | 856 | 201.3 |
| D | 12 | 33 | 6108449 | 35402.19 | 722 | 704 | 172.5 |
| D | 8 | 195 | 2751308 | 15943.26 | 722 | 704 | 172.5 |
| D | 7 | 38 | 869166 | 5033.84 | 722 | 704 | 172.5 |
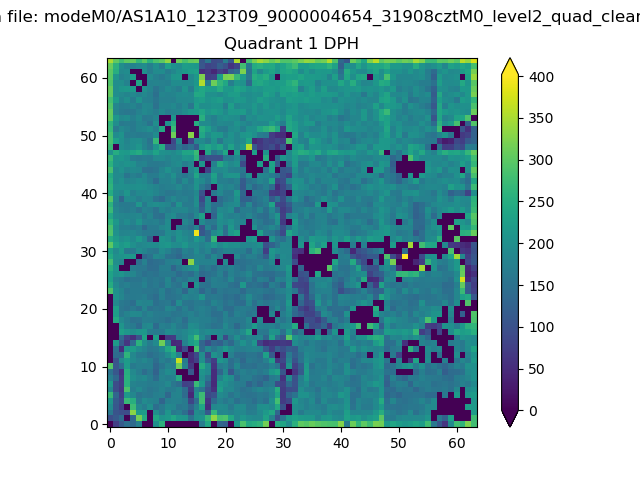
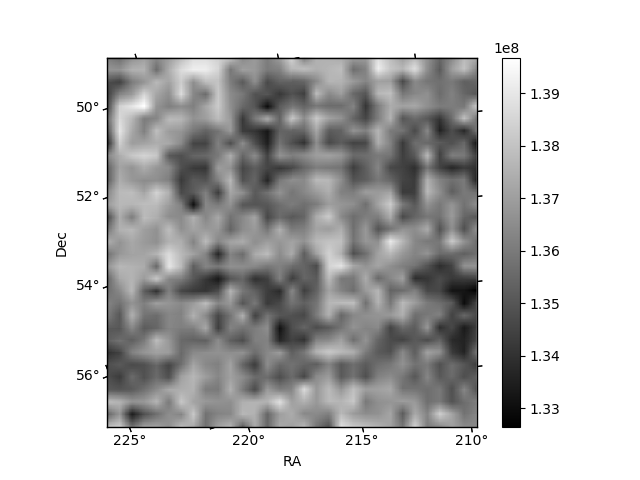
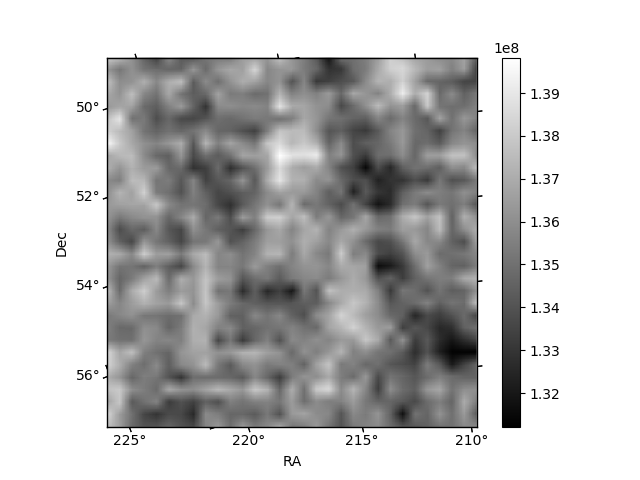
Histogram calculated using DETX and DETY for each event in the final _common_clean file
| Quadrant A | 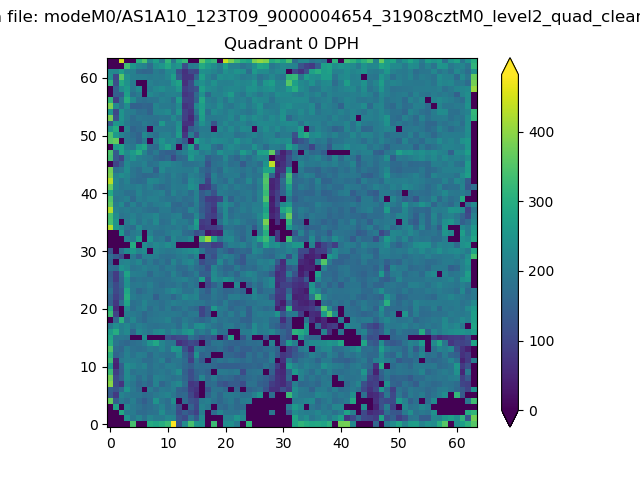 |
 |
Quadrant B |
|---|---|---|---|
| Quadrant D | 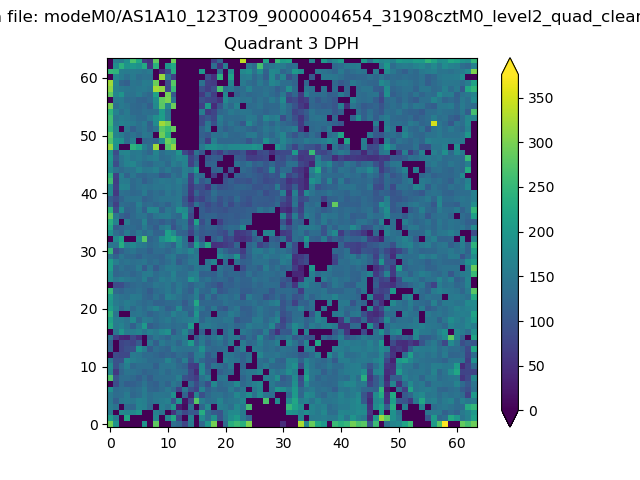 |
 |
Quadrant C |
| Plot type | Count rate plots | Images |
|---|---|---|
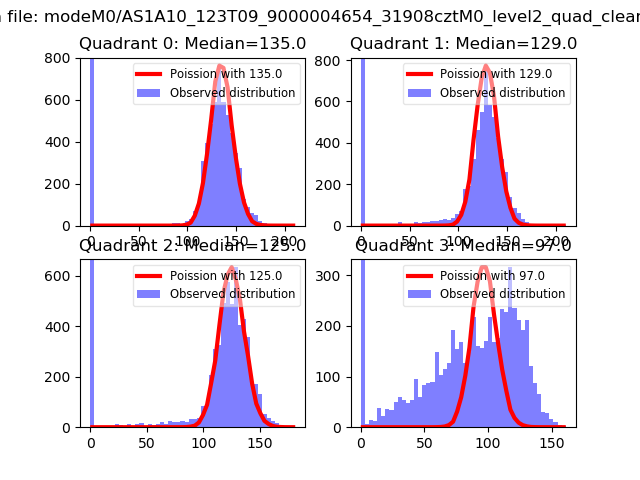
| Comparison with Poisson distribution Blue bars denote a histogram of data divided into 1 sec bins. Red curve is a Poisson curve with rate = median count rate of data. |
 |
 |
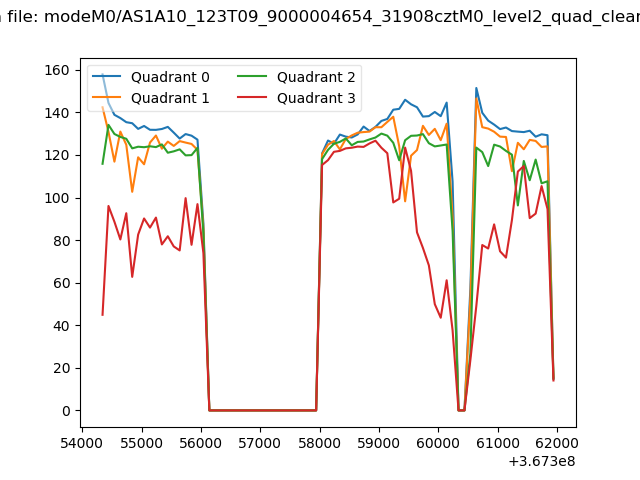
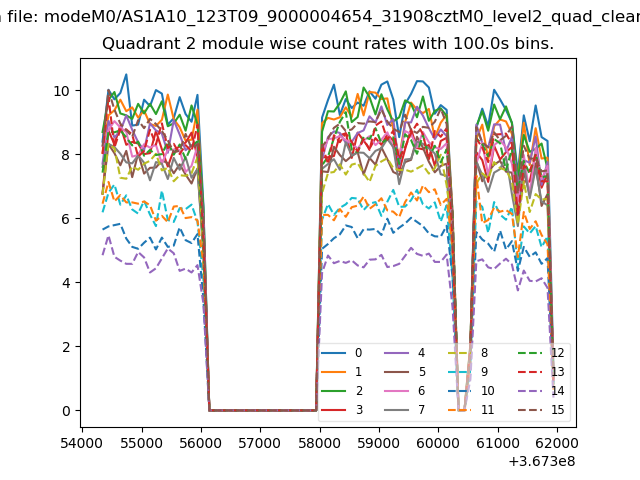
| Quadrant-wise count rates Data is divided into 100 sec bins |
 |
|
| Module-wise count rates for Quadrant A Data is divided into 100 sec bins |
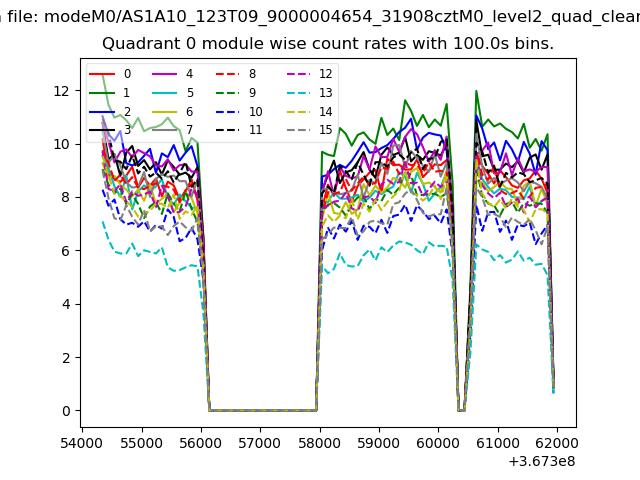 |
 |
| Module-wise count rates for Quadrant B Data is divided into 100 sec bins |
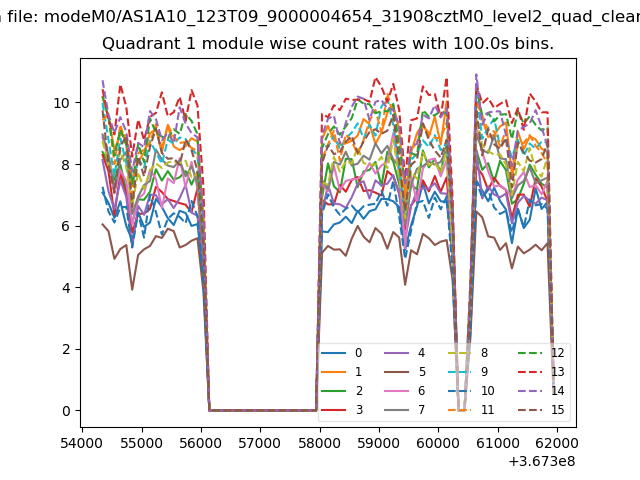 |
 |
| Module-wise count rates for Quadrant C Data is divided into 100 sec bins |
 |
 |
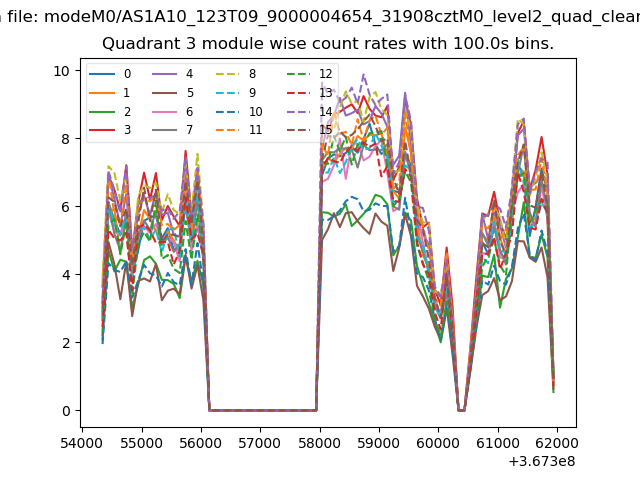
| Module-wise count rates for Quadrant D Data is divided into 100 sec bins |
 |
 |
| Parameter | Plot |
|---|---|
| CZT HV Monitor | 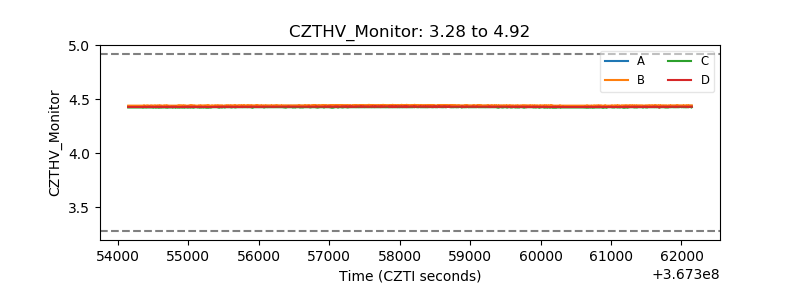 |
| D_VDD | 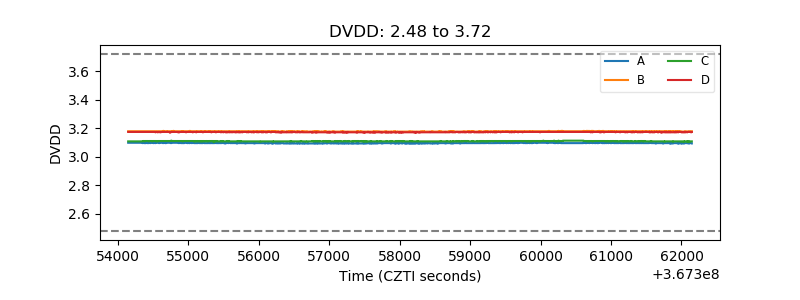 |
| Temperature 1 | 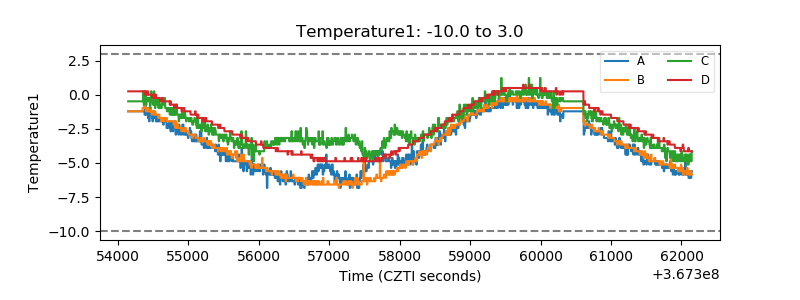 |
| Veto HV Monitor | 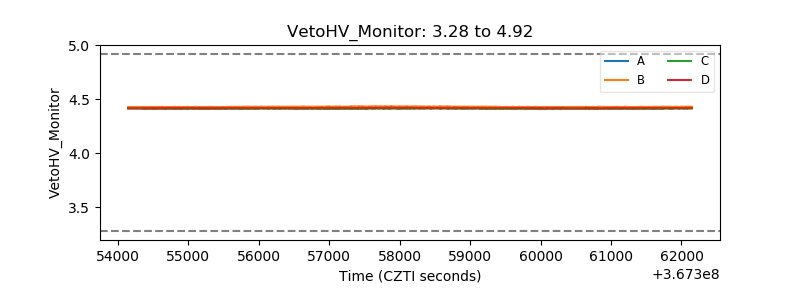 |
| Veto LLD | 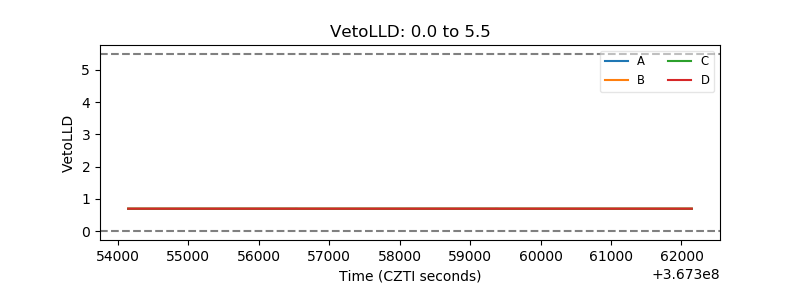 |
| Alpha Counter | 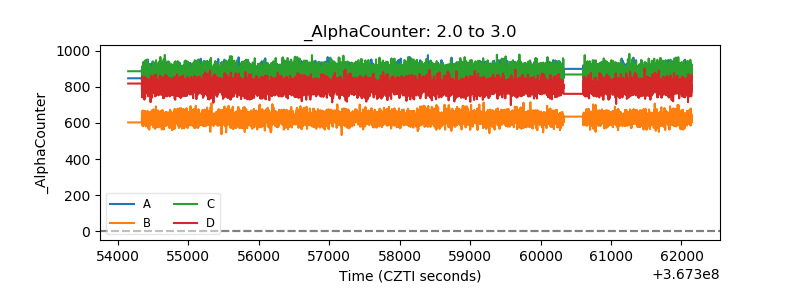 |
| _CPM_Rate | 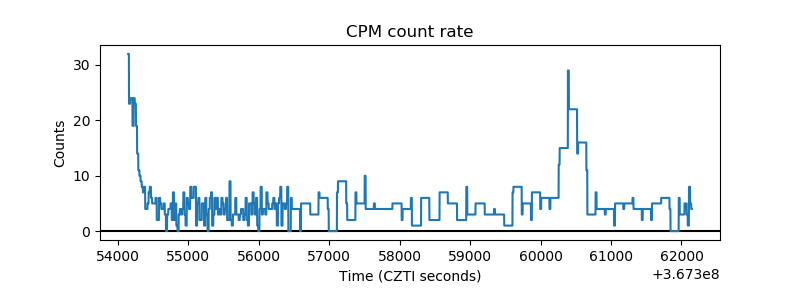 |
| CZT Counter | 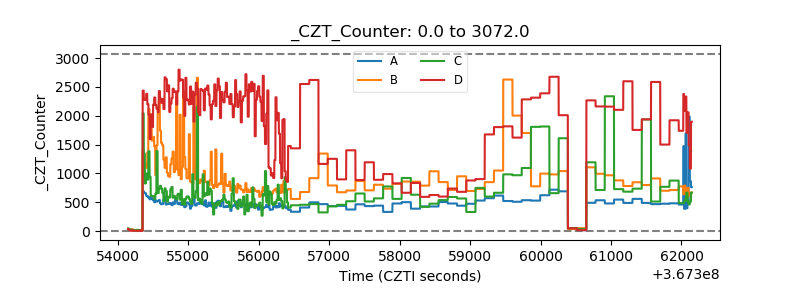 |
| +2.5 Volts monitor |  |
| +5 Volts monitor |  |
| _ROLL_ROT | 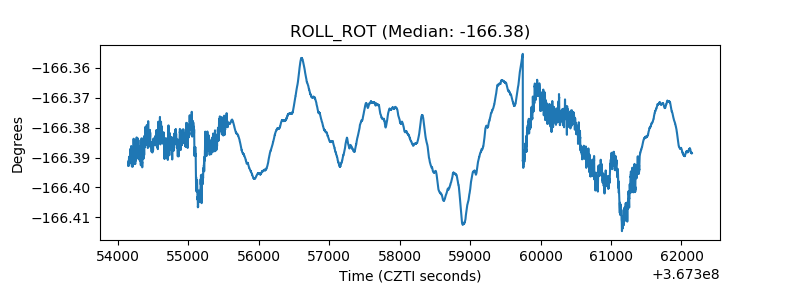 |
| _Roll_DEC | 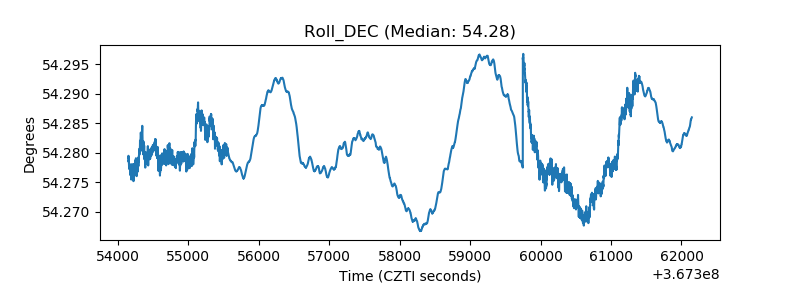 |
| _Roll_RA |  |
| Veto Counter | 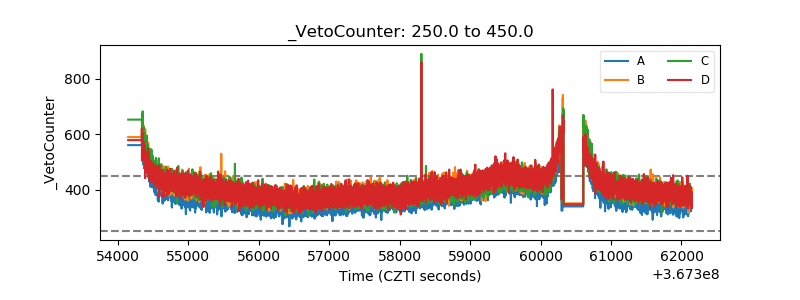 |