| Param | Original file | Final file |
|---|---|---|
| Filename | modeM0/AS1A10_123T09_9000004654_31911cztM0_level2.evt | modeM0/AS1A10_123T09_9000004654_31911cztM0_level2_quad_clean.evt |
| Size (bytes) | 957,263,040 | 105,333,120 |
| Size | 912.9 MB | 100.5 MB |
| Events in quadrant A | 4,110,274 | 708,652 |
| Events in quadrant B | 9,779,480 | 629,163 |
| Events in quadrant C | 5,171,538 | 659,007 |
| Events in quadrant D | 9,368,818 | 613,765 |
| Mode M0 | |||
|---|---|---|---|
| Quadrant | BADHDUFLAG | Total packets | Discarded packets |
| A | 0 | 20728 | 3218 |
| B | 0 | 39923 | 4848 |
| C | 0 | 24150 | 3330 |
| D | 0 | 41115 | 7470 |
| Mode SS | |||
|---|---|---|---|
| Quadrant | BADHDUFLAG | Total packets | Discarded packets |
| A | 0 | 205 | 35 |
| B | 0 | 197 | 25 |
| C | 0 | 208 | 36 |
| D | 0 | 204 | 30 |
| Mode M9 | |||
|---|---|---|---|
| Quadrant | BADHDUFLAG | Total packets | Discarded packets |
| A | 0 | 13 | 4 |
| B | 0 | 14 | 5 |
| C | 0 | 13 | 4 |
| D | 0 | 15 | 5 |
| Quadrant | Total seconds | Saturated seconds | Saturation percentage |
|---|---|---|---|
| A | 8360 | 57 | 0.681818% |
| B | 8309 | 1753 | 21.097605% |
| C | 8339 | 320 | 3.837391% |
| D | 8276 | 933 | 11.273562% |
Noise dominated data is calculated using 1-second bins in cleaned event files. If a bin has >2000 counts, and if more than 50% of those come from <1% of pixels, then it is considered to be noise-dominated and hence unusable.
| Quadrant | # 1 sec bins | Bins with >0 counts | Bins with >2000 counts | High rate bins dominated by noise | Noise dominated (total time) | Noise dominated (detector-on time) | Marked lightcurve |
|---|---|---|---|---|---|---|---|
| A | 18215 | 8431 | 4 | 4 | 0.02% | 0.05% | 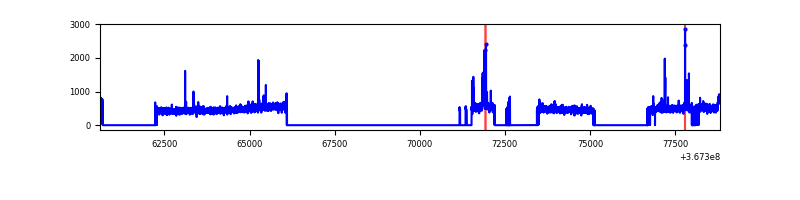 |
| B | 18215 | 8378 | 1177 | 1177 | 6.46% | 14.05% | 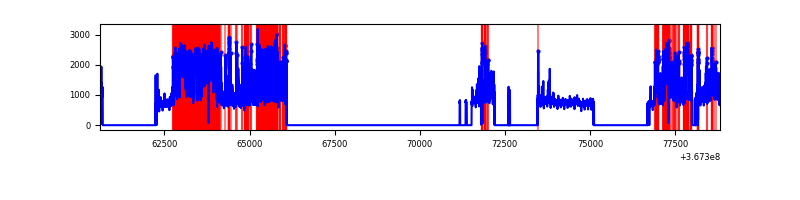 |
| C | 18215 | 8412 | 66 | 66 | 0.36% | 0.78% | 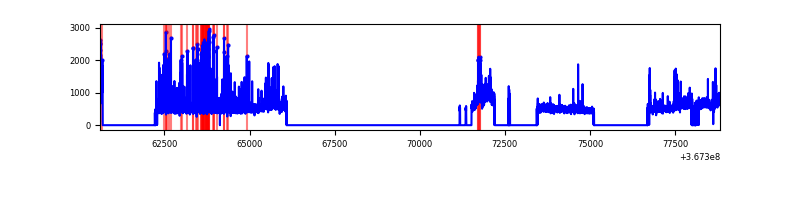 |
| D | 18215 | 8354 | 711 | 711 | 3.90% | 8.51% | 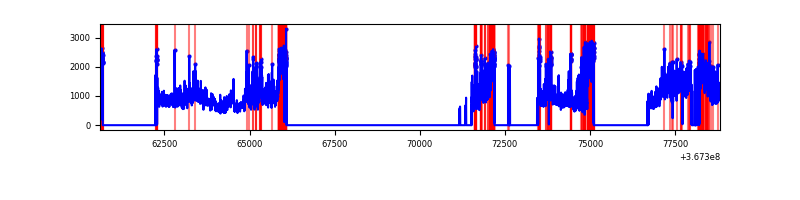 |
Top three noisy pixels from each quadrant. If the there are fewer than three noisy pixels in the level2.evt file, extra rows are filled as -1
| Pixel properties | Quadrant properties | ||||||
|---|---|---|---|---|---|---|---|
| Quadrant | DetID | PixID | Counts | Sigma | Mean | Median | Sigma |
| A | 15 | 174 | 131212 | 631.98 | 1028 | 1005 | 206.0 |
| A | 13 | 254 | 17175 | 78.48 | 1028 | 1005 | 206.0 |
| A | 3 | 137 | 10307 | 45.15 | 1028 | 1005 | 206.0 |
| B | 4 | 80 | 2314343 | 12926.66 | 935 | 910 | 179.0 |
| B | 6 | 159 | 2159892 | 12063.64 | 935 | 910 | 179.0 |
| B | 5 | 172 | 631004 | 3520.75 | 935 | 910 | 179.0 |
| C | 0 | 10 | 728143 | 3205.7 | 969 | 974 | 226.8 |
| C | 3 | 233 | 432608 | 1902.85 | 969 | 974 | 226.8 |
| C | 14 | 238 | 165079 | 723.45 | 969 | 974 | 226.8 |
| D | 12 | 33 | 2469061 | 10883.41 | 945 | 921 | 226.8 |
| D | 8 | 195 | 2032263 | 8957.32 | 945 | 921 | 226.8 |
| D | 7 | 238 | 803827 | 3540.46 | 945 | 921 | 226.8 |
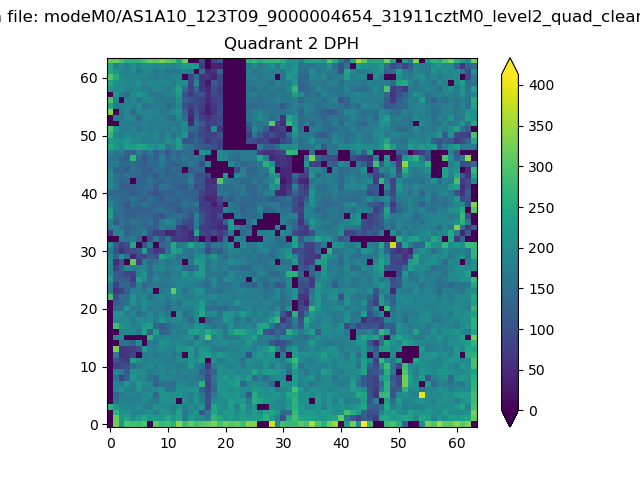
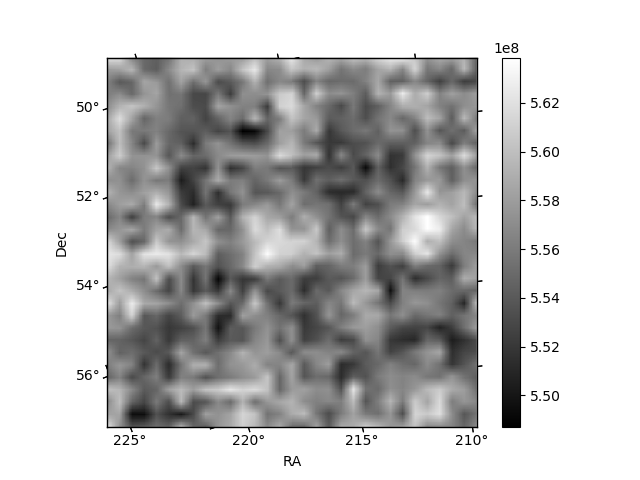
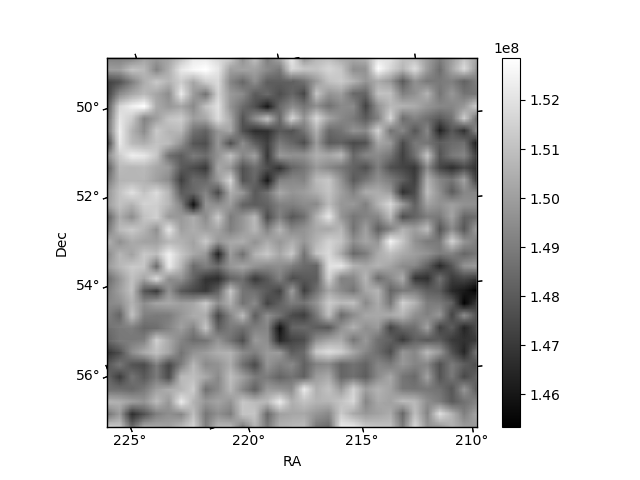
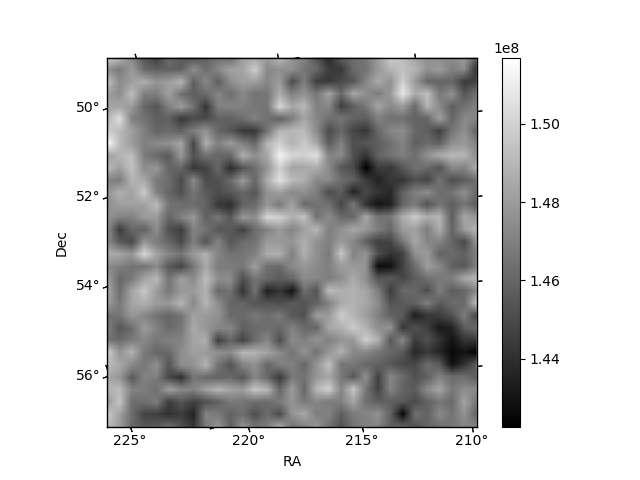
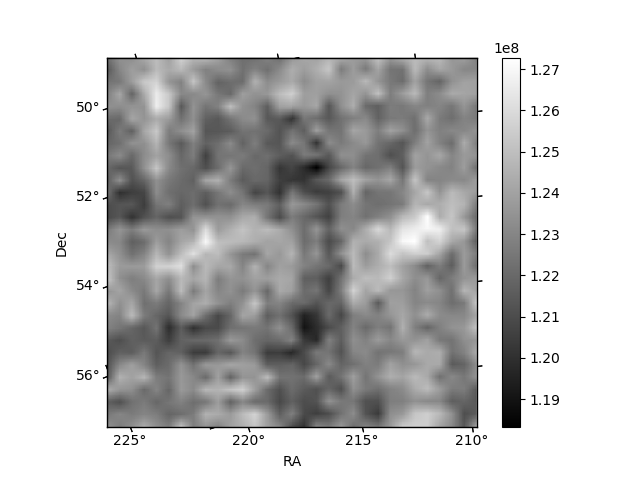
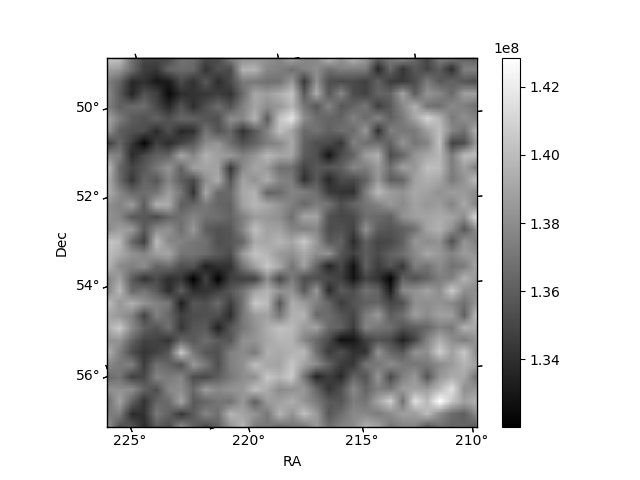
Histogram calculated using DETX and DETY for each event in the final _common_clean file
| Quadrant A | 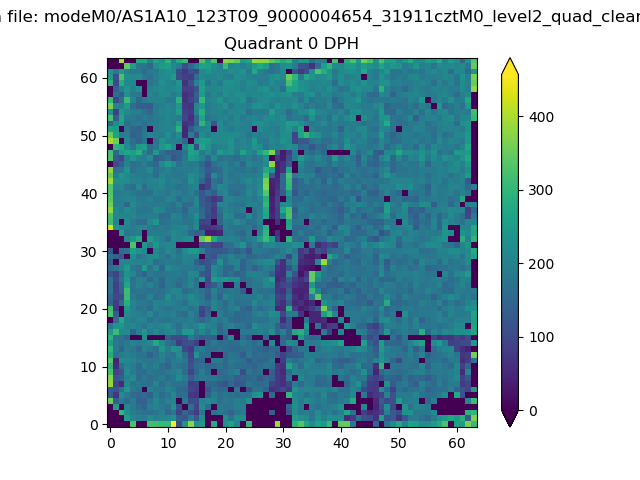 |
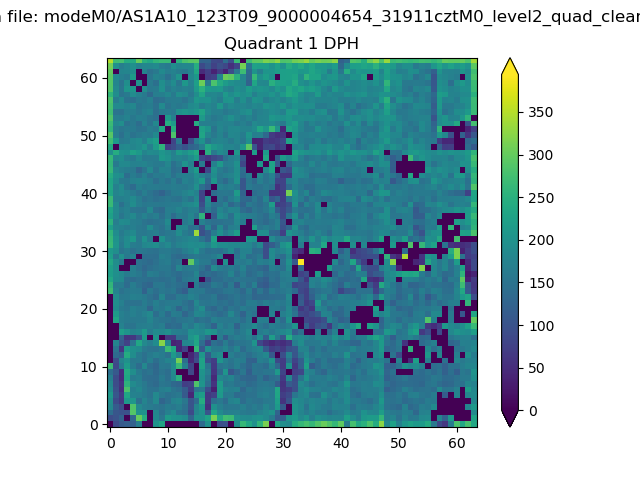 |
Quadrant B |
|---|---|---|---|
| Quadrant D | 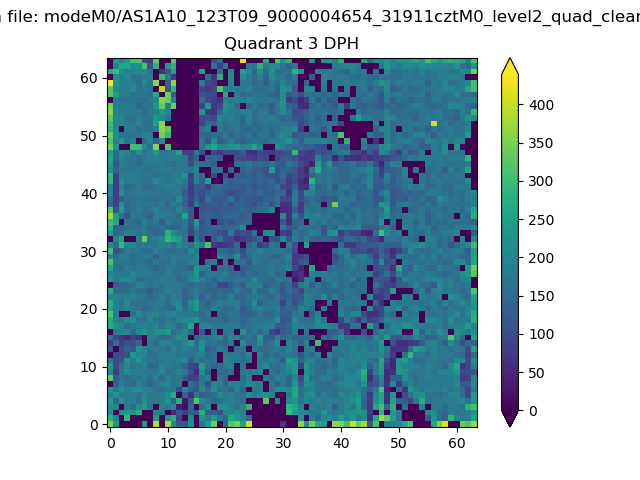 |
 |
Quadrant C |
| Plot type | Count rate plots | Images |
|---|---|---|
| Comparison with Poisson distribution Blue bars denote a histogram of data divided into 1 sec bins. Red curve is a Poisson curve with rate = median count rate of data. |
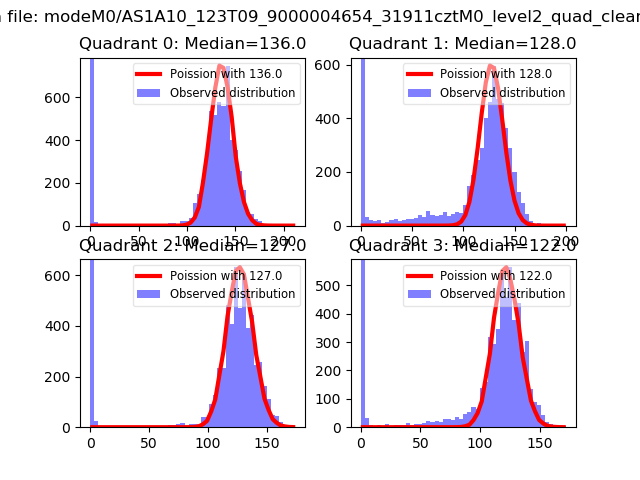 |
 |
| Quadrant-wise count rates Data is divided into 100 sec bins |
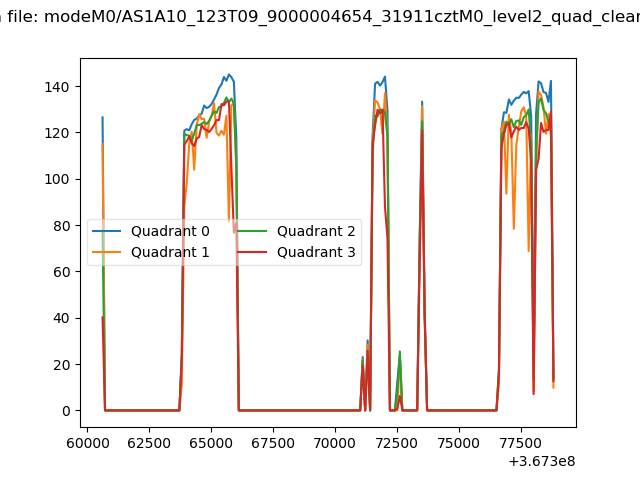 |
|
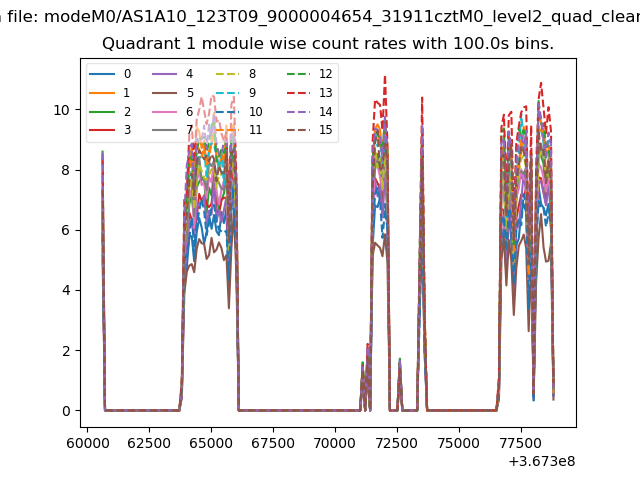
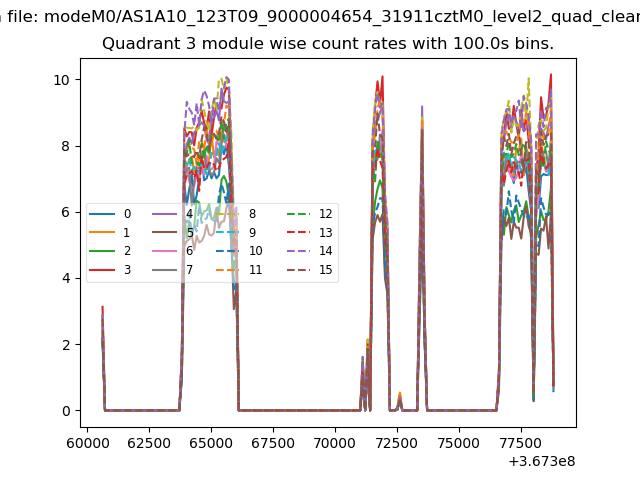
| Module-wise count rates for Quadrant A Data is divided into 100 sec bins |
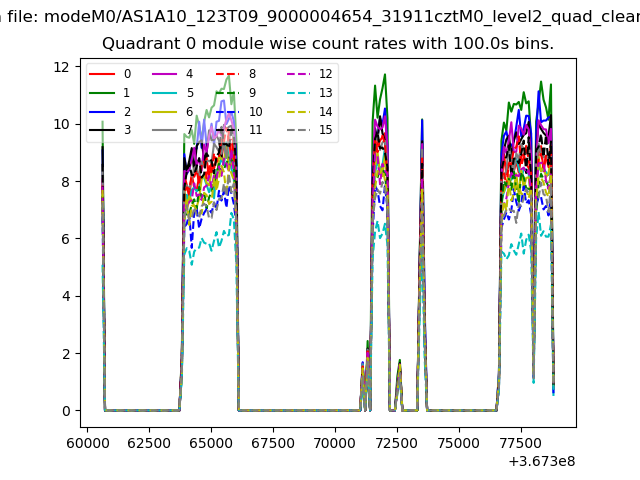 |
 |
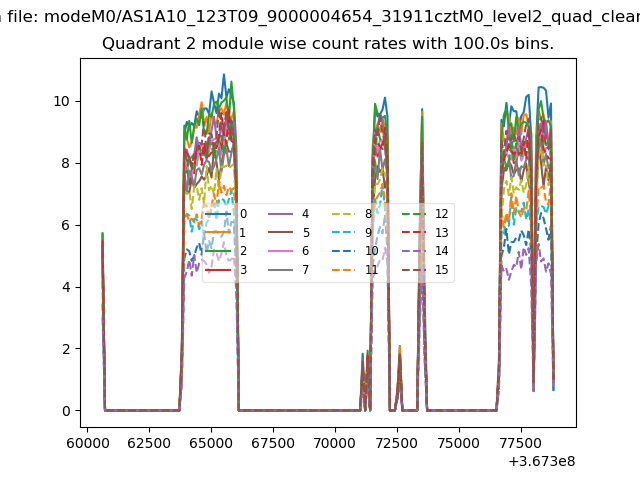
| Module-wise count rates for Quadrant B Data is divided into 100 sec bins |
 |
 |
| Module-wise count rates for Quadrant C Data is divided into 100 sec bins |
 |
 |
| Module-wise count rates for Quadrant D Data is divided into 100 sec bins |
 |
 |
| Parameter | Plot |
|---|---|
| CZT HV Monitor | 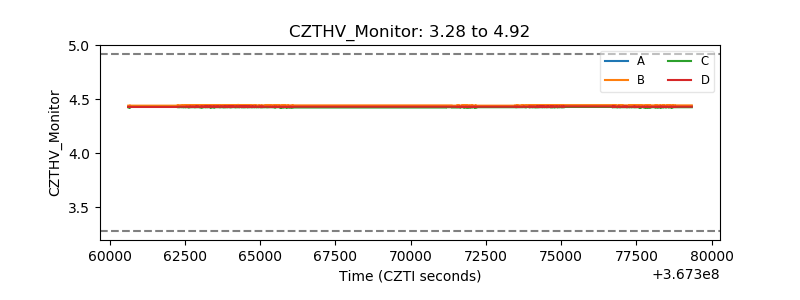 |
| D_VDD |  |
| Temperature 1 | 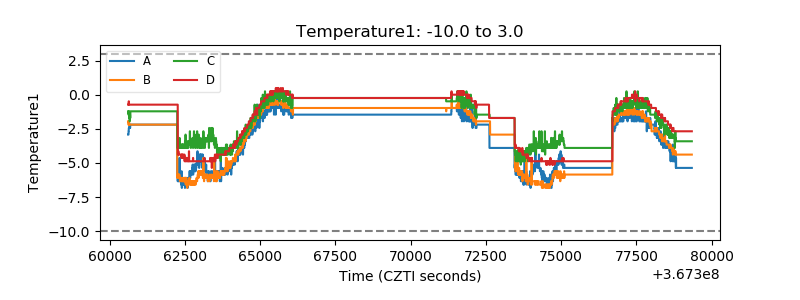 |
| Veto HV Monitor | 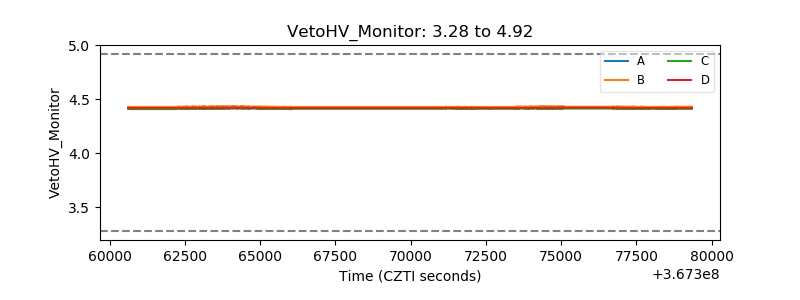 |
| Veto LLD | 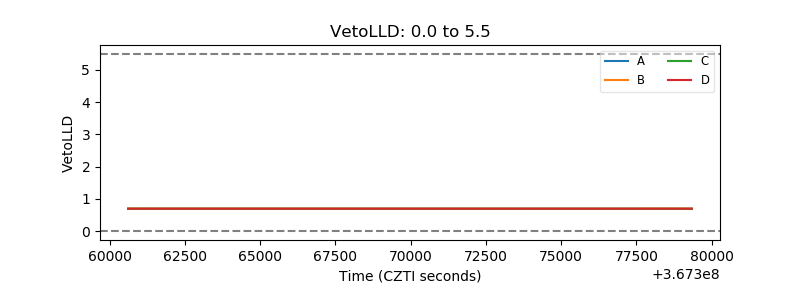 |
| Alpha Counter | 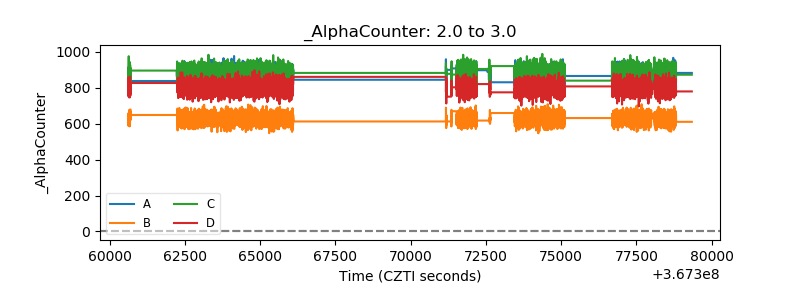 |
| _CPM_Rate | 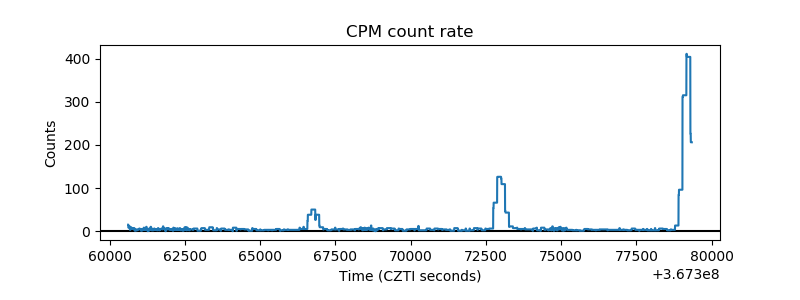 |
| CZT Counter | 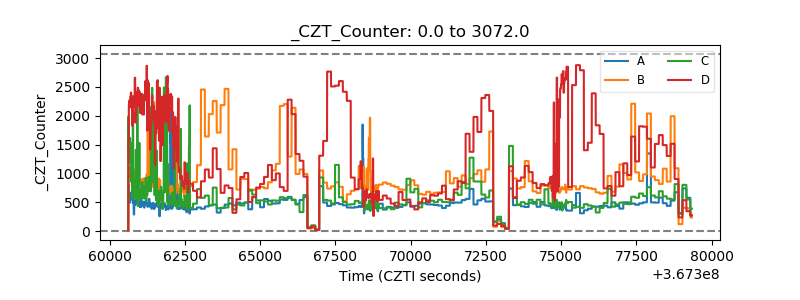 |
| +2.5 Volts monitor |  |
| +5 Volts monitor |  |
| _ROLL_ROT | 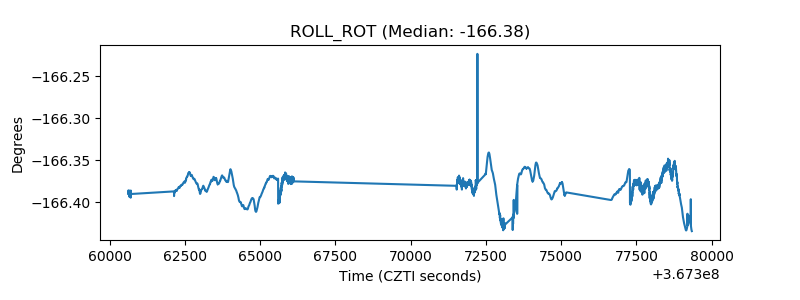 |
| _Roll_DEC | 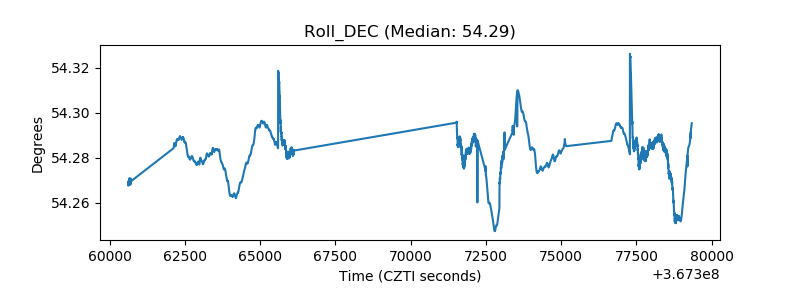 |
| _Roll_RA | 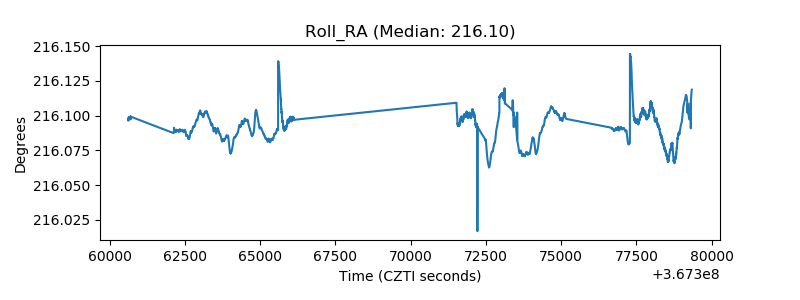 |
| Veto Counter | 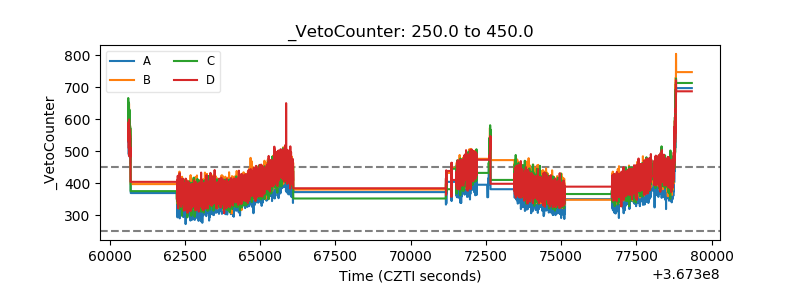 |