| Param | Original file | Final file |
|---|---|---|
| Filename | modeM0/AS1A10_123T09_9000004654_31912cztM0_level2.evt | modeM0/AS1A10_123T09_9000004654_31912cztM0_level2_quad_clean.evt |
| Size (bytes) | 1,449,034,560 | 200,580,480 |
| Size | 1.3 GB | 191.3 MB |
| Events in quadrant A | 6,887,319 | 1,376,768 |
| Events in quadrant B | 12,676,252 | 1,290,470 |
| Events in quadrant C | 8,607,830 | 1,288,723 |
| Events in quadrant D | 14,781,089 | 1,161,059 |
| Mode M0 | |||
|---|---|---|---|
| Quadrant | BADHDUFLAG | Total packets | Discarded packets |
| A | 0 | 31269 | 2253 |
| B | 0 | 51543 | 3746 |
| C | 0 | 37262 | 2693 |
| D | 0 | 58686 | 5363 |
| Mode SS | |||
|---|---|---|---|
| Quadrant | BADHDUFLAG | Total packets | Discarded packets |
| A | 0 | 312 | 24 |
| B | 0 | 307 | 17 |
| C | 0 | 310 | 26 |
| D | 0 | 310 | 22 |
| Mode M9 | |||
|---|---|---|---|
| Quadrant | BADHDUFLAG | Total packets | Discarded packets |
| A | 0 | 26 | 1 |
| B | 0 | 26 | 1 |
| C | 0 | 28 | 3 |
| D | 0 | 29 | 4 |
| Quadrant | Total seconds | Saturated seconds | Saturation percentage |
|---|---|---|---|
| A | 13913 | 125 | 0.898440% |
| B | 13842 | 1080 | 7.802341% |
| C | 13856 | 535 | 3.861143% |
| D | 13767 | 2058 | 14.948791% |
Noise dominated data is calculated using 1-second bins in cleaned event files. If a bin has >2000 counts, and if more than 50% of those come from <1% of pixels, then it is considered to be noise-dominated and hence unusable.
| Quadrant | # 1 sec bins | Bins with >0 counts | Bins with >2000 counts | High rate bins dominated by noise | Noise dominated (total time) | Noise dominated (detector-on time) | Marked lightcurve |
|---|---|---|---|---|---|---|---|
| A | 23414 | 14013 | 9 | 9 | 0.04% | 0.06% | 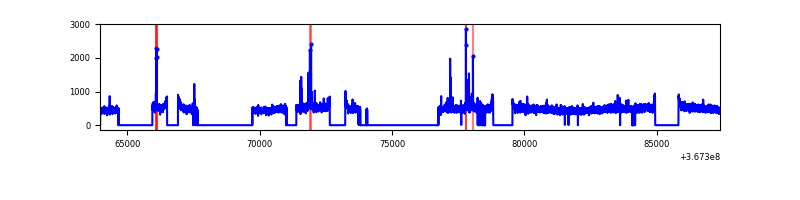 |
| B | 23411 | 13946 | 485 | 485 | 2.07% | 3.48% | 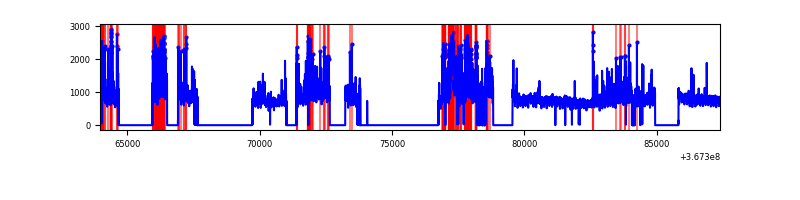 |
| C | 23412 | 13968 | 71 | 71 | 0.30% | 0.51% | 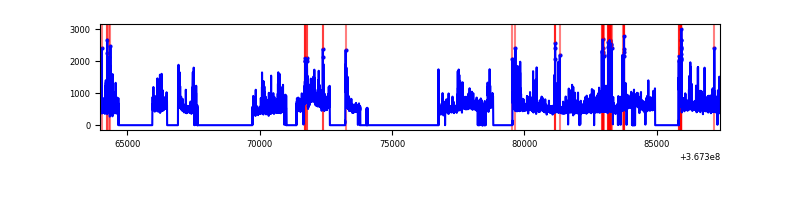 |
| D | 23410 | 13883 | 1741 | 1741 | 7.44% | 12.54% | 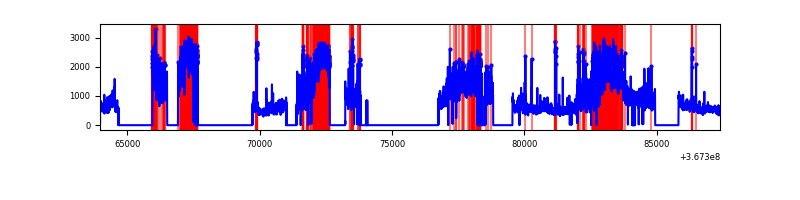 |
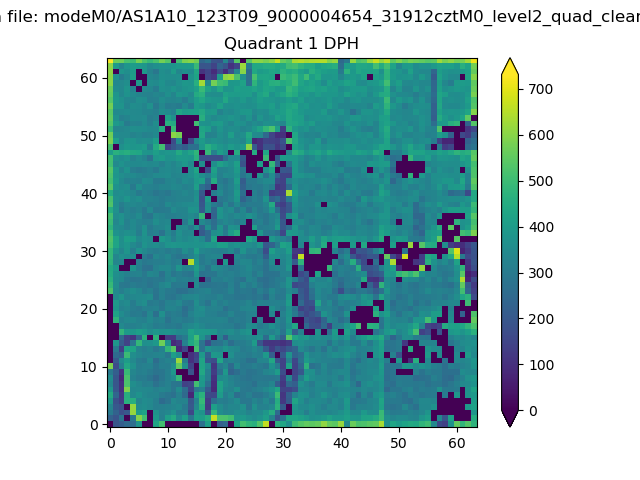
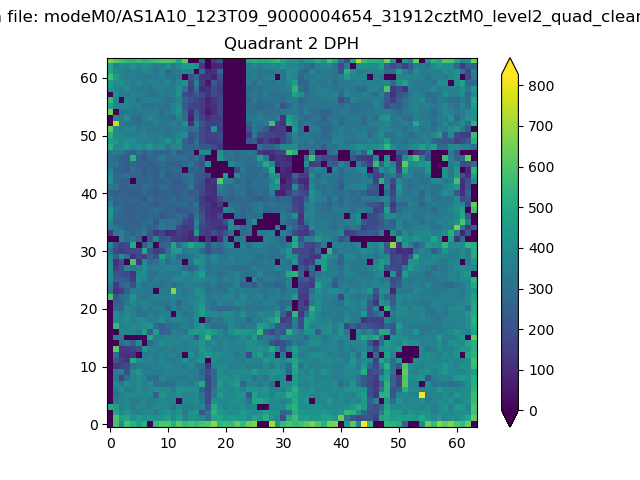
Top three noisy pixels from each quadrant. If the there are fewer than three noisy pixels in the level2.evt file, extra rows are filled as -1
| Pixel properties | Quadrant properties | ||||||
|---|---|---|---|---|---|---|---|
| Quadrant | DetID | PixID | Counts | Sigma | Mean | Median | Sigma |
| A | 15 | 174 | 137749 | 391.9 | 1742 | 1703 | 347.1 |
| A | 13 | 254 | 27718 | 74.94 | 1742 | 1703 | 347.1 |
| A | 13 | 6 | 20042 | 52.83 | 1742 | 1703 | 347.1 |
| B | 6 | 159 | 3754942 | 11756.64 | 1665 | 1620 | 319.3 |
| B | 4 | 80 | 884442 | 2765.29 | 1665 | 1620 | 319.3 |
| B | 5 | 172 | 458596 | 1431.4 | 1665 | 1620 | 319.3 |
| C | 0 | 10 | 911916 | 2362.68 | 1643 | 1648 | 385.3 |
| C | 3 | 233 | 851690 | 2206.36 | 1643 | 1648 | 385.3 |
| C | 14 | 238 | 295689 | 763.21 | 1643 | 1648 | 385.3 |
| D | 12 | 33 | 5767787 | 15272.68 | 1580 | 1538 | 377.6 |
| D | 8 | 195 | 2136558 | 5654.88 | 1580 | 1538 | 377.6 |
| D | 7 | 238 | 226746 | 596.49 | 1580 | 1538 | 377.6 |
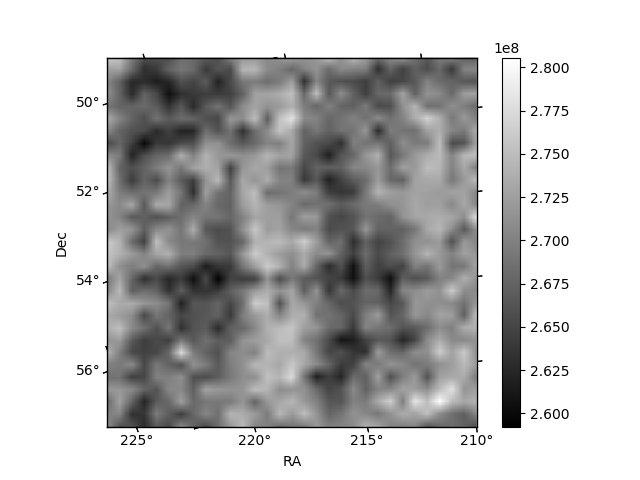
Histogram calculated using DETX and DETY for each event in the final _common_clean file
| Quadrant A | 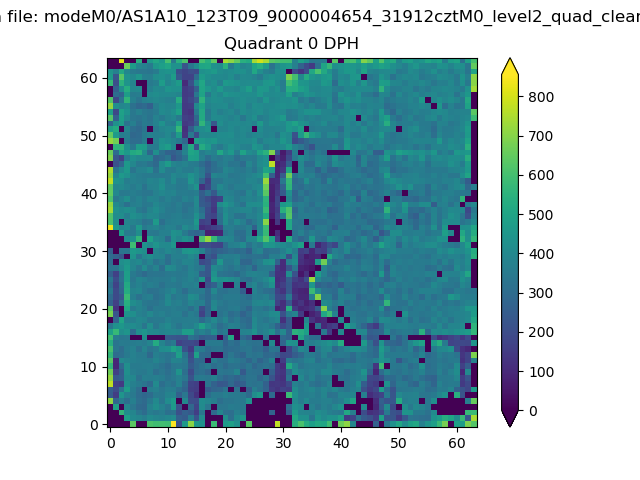 |
 |
Quadrant B |
|---|---|---|---|
| Quadrant D | 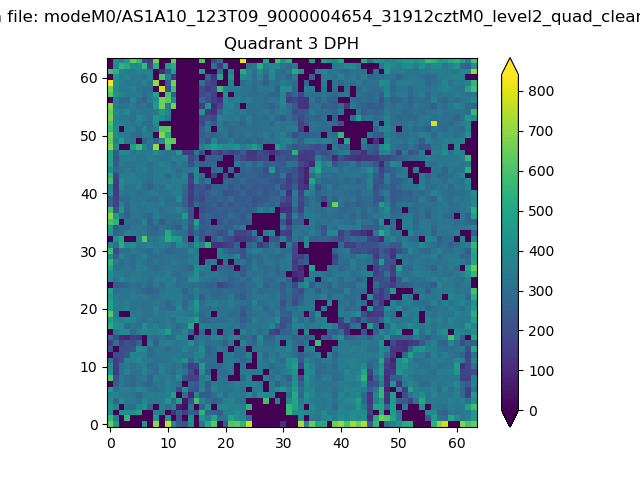 |
 |
Quadrant C |
| Plot type | Count rate plots | Images |
|---|---|---|
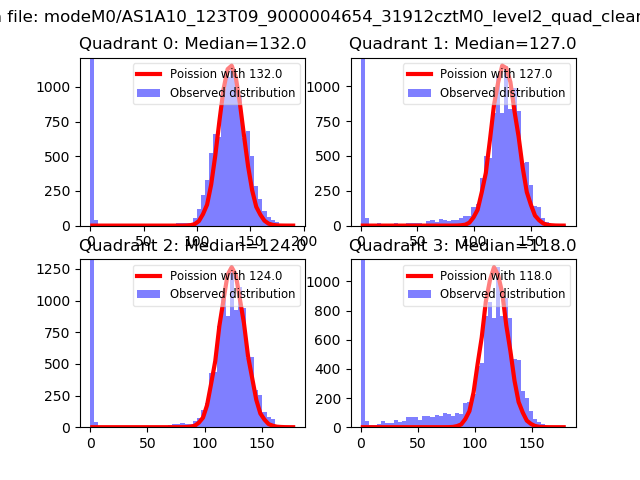
| Comparison with Poisson distribution Blue bars denote a histogram of data divided into 1 sec bins. Red curve is a Poisson curve with rate = median count rate of data. |
 |
 |
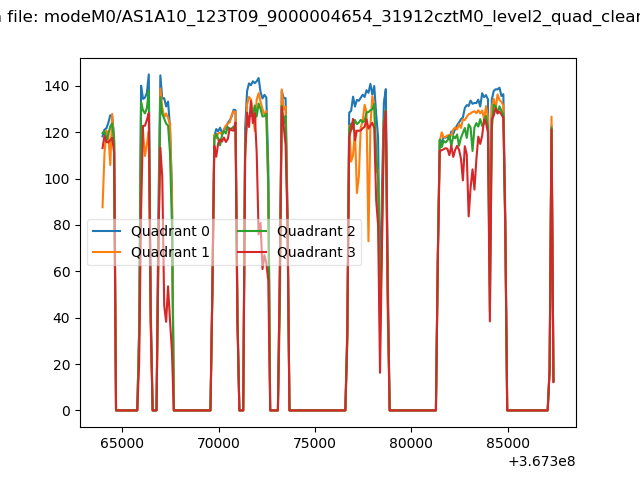
| Quadrant-wise count rates Data is divided into 100 sec bins |
 |
|
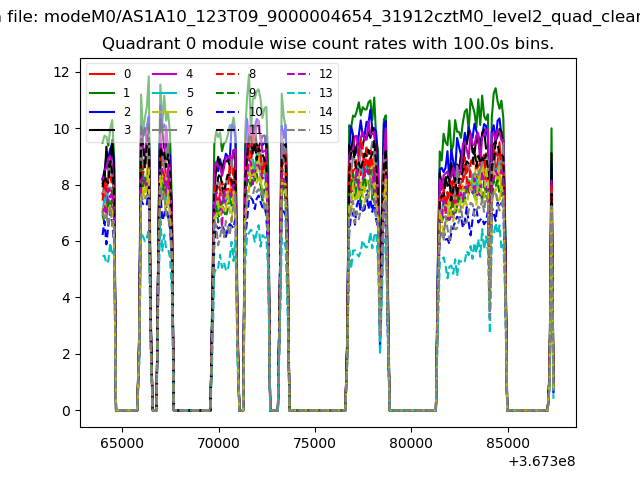
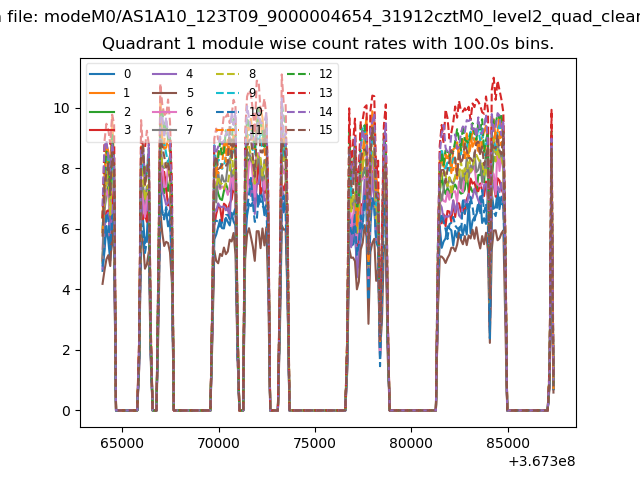
| Module-wise count rates for Quadrant A Data is divided into 100 sec bins |
 |
 |
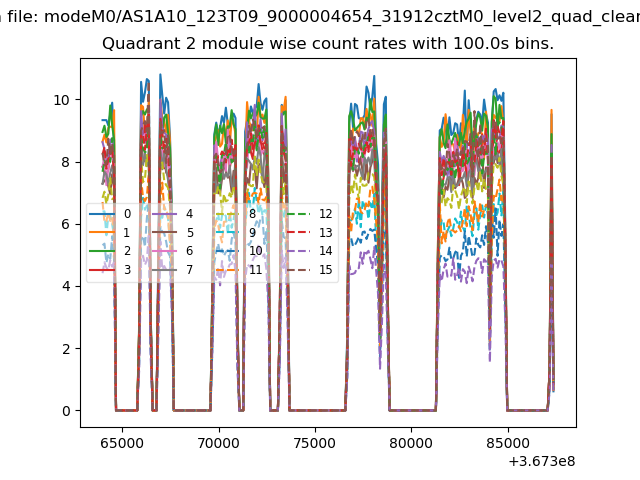
| Module-wise count rates for Quadrant B Data is divided into 100 sec bins |
 |
 |
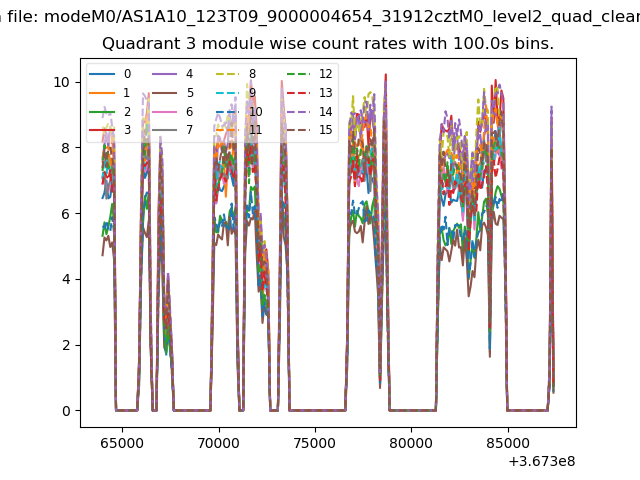
| Module-wise count rates for Quadrant C Data is divided into 100 sec bins |
 |
 |
| Module-wise count rates for Quadrant D Data is divided into 100 sec bins |
 |
 |
| Parameter | Plot |
|---|---|
| CZT HV Monitor | 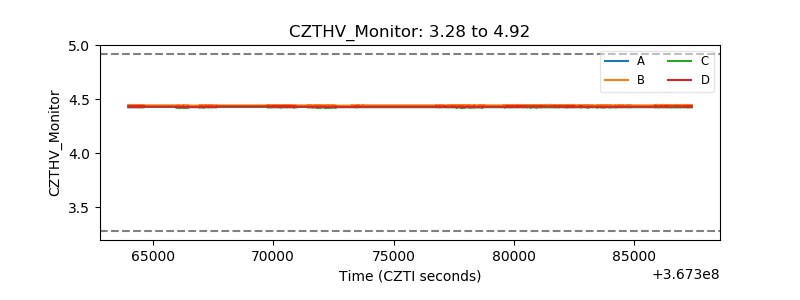 |
| D_VDD |  |
| Temperature 1 | 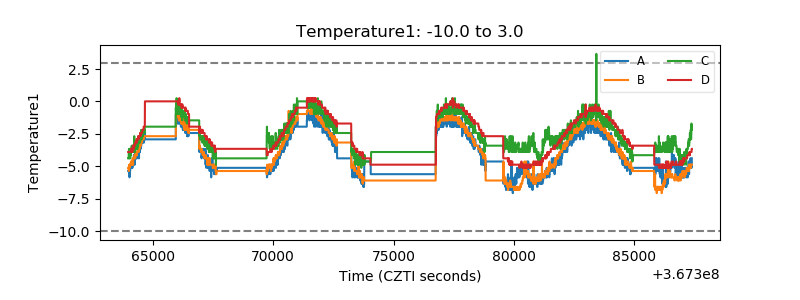 |
| Veto HV Monitor |  |
| Veto LLD | 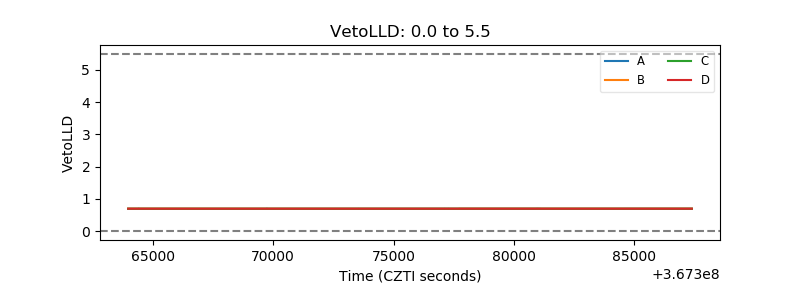 |
| Alpha Counter | 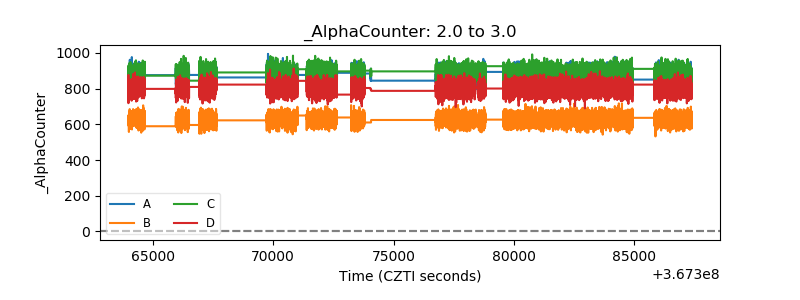 |
| _CPM_Rate | 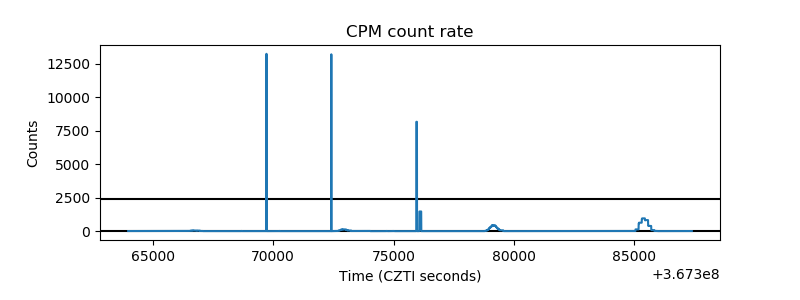 |
| CZT Counter | 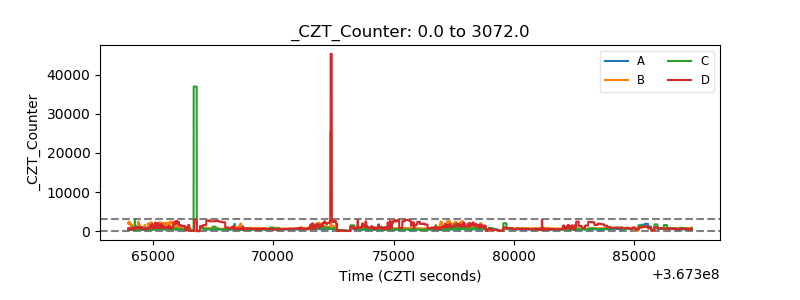 |
| +2.5 Volts monitor |  |
| +5 Volts monitor |  |
| _ROLL_ROT | 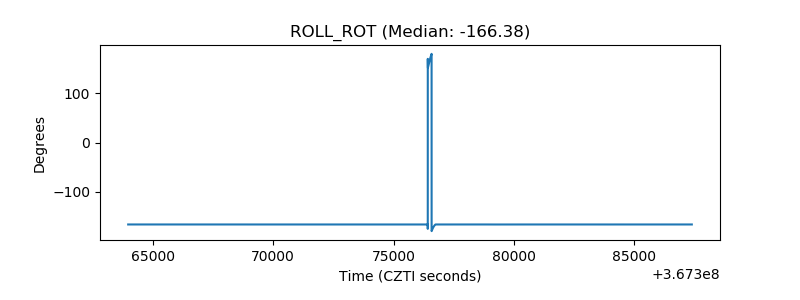 |
| _Roll_DEC |  |
| _Roll_RA |  |
| Veto Counter | 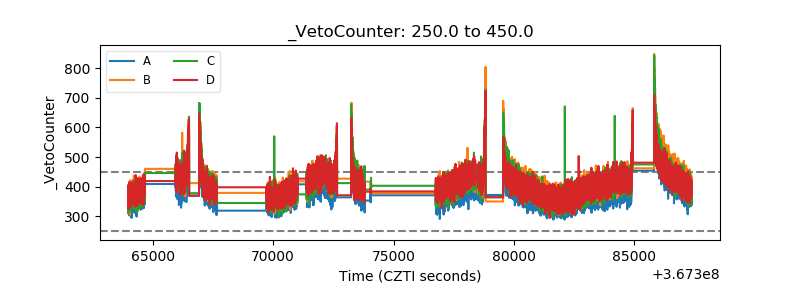 |