| Param | Original file | Final file |
|---|---|---|
| Filename | modeM0/AS1A10_123T09_9000004654_31913cztM0_level2.evt | modeM0/AS1A10_123T09_9000004654_31913cztM0_level2_quad_clean.evt |
| Size (bytes) | 346,561,920 | 48,329,280 |
| Size | 330.5 MB | 46.1 MB |
| Events in quadrant A | 1,718,624 | 325,579 |
| Events in quadrant B | 2,984,978 | 312,473 |
| Events in quadrant C | 2,381,050 | 301,721 |
| Events in quadrant D | 3,183,853 | 286,327 |
| Mode M0 | |||
|---|---|---|---|
| Quadrant | BADHDUFLAG | Total packets | Discarded packets |
| A | 0 | 7294 | 179 |
| B | 0 | 11313 | 330 |
| C | 0 | 9550 | 188 |
| D | 0 | 12471 | 590 |
| Mode SS | |||
|---|---|---|---|
| Quadrant | BADHDUFLAG | Total packets | Discarded packets |
| A | 0 | 71 | 1 |
| B | 0 | 71 | 1 |
| C | 0 | 72 | 4 |
| D | 0 | 71 | 1 |
| Mode M9 | |||
|---|---|---|---|
| Quadrant | BADHDUFLAG | Total packets | Discarded packets |
| A | 0 | 9 | 0 |
| B | 0 | 11 | 1 |
| C | 0 | 10 | 0 |
| D | 0 | 11 | 1 |
| Quadrant | Total seconds | Saturated seconds | Saturation percentage |
|---|---|---|---|
| A | 3351 | 45 | 1.342883% |
| B | 3332 | 156 | 4.681873% |
| C | 3343 | 190 | 5.683518% |
| D | 3321 | 348 | 10.478771% |
Noise dominated data is calculated using 1-second bins in cleaned event files. If a bin has >2000 counts, and if more than 50% of those come from <1% of pixels, then it is considered to be noise-dominated and hence unusable.
| Quadrant | # 1 sec bins | Bins with >0 counts | Bins with >2000 counts | High rate bins dominated by noise | Noise dominated (total time) | Noise dominated (detector-on time) | Marked lightcurve |
|---|---|---|---|---|---|---|---|
| A | 4530 | 3367 | 0 | 0 | 0.00% | 0.00% | 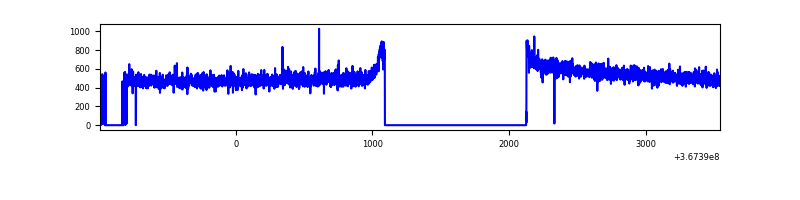 |
| B | 4537 | 3360 | 57 | 57 | 1.26% | 1.70% | 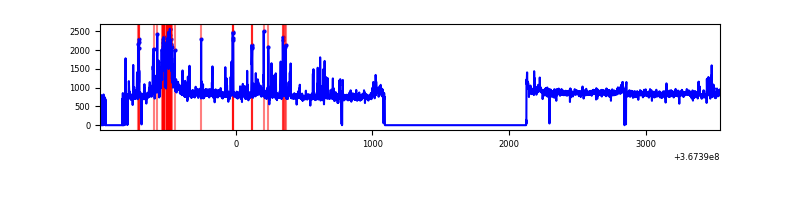 |
| C | 4531 | 3366 | 27 | 27 | 0.60% | 0.80% |  |
| D | 4532 | 3346 | 319 | 319 | 7.04% | 9.53% | 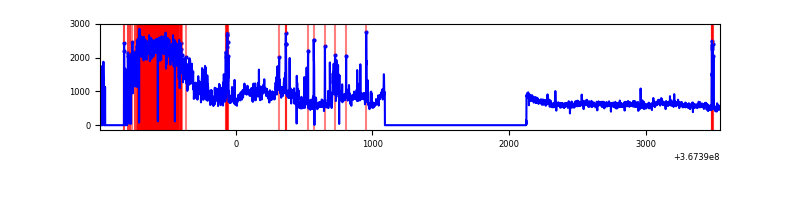 |
Top three noisy pixels from each quadrant. If the there are fewer than three noisy pixels in the level2.evt file, extra rows are filled as -1
| Pixel properties | Quadrant properties | ||||||
|---|---|---|---|---|---|---|---|
| Quadrant | DetID | PixID | Counts | Sigma | Mean | Median | Sigma |
| A | 13 | 254 | 6426 | 66.14 | 444 | 434 | 90.6 |
| A | 3 | 137 | 4248 | 42.1 | 444 | 434 | 90.6 |
| A | 0 | 226 | 3761 | 36.73 | 444 | 434 | 90.6 |
| B | 6 | 159 | 914981 | 11017.76 | 431 | 420 | 83.0 |
| B | 4 | 80 | 201122 | 2417.87 | 431 | 420 | 83.0 |
| B | 5 | 255 | 54819 | 655.35 | 431 | 420 | 83.0 |
| C | 3 | 233 | 428885 | 4405.67 | 413 | 417 | 97.3 |
| C | 0 | 10 | 229077 | 2351.17 | 413 | 417 | 97.3 |
| C | 14 | 238 | 74183 | 758.49 | 413 | 417 | 97.3 |
| D | 12 | 33 | 822814 | 8269.5 | 416 | 406 | 99.5 |
| D | 8 | 195 | 586290 | 5891.2 | 416 | 406 | 99.5 |
| D | 13 | 249 | 111602 | 1118.1 | 416 | 406 | 99.5 |
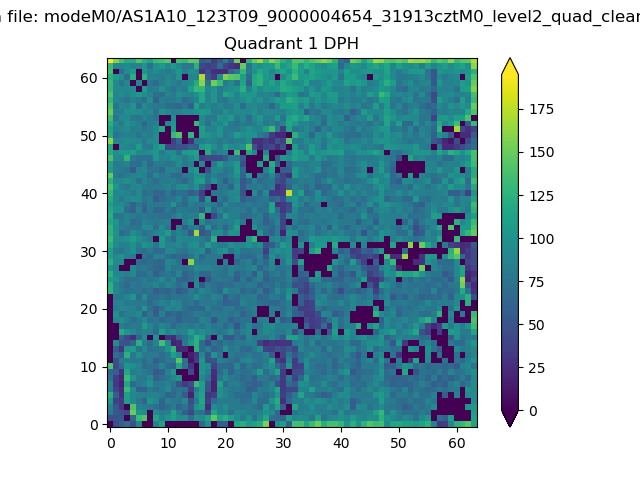
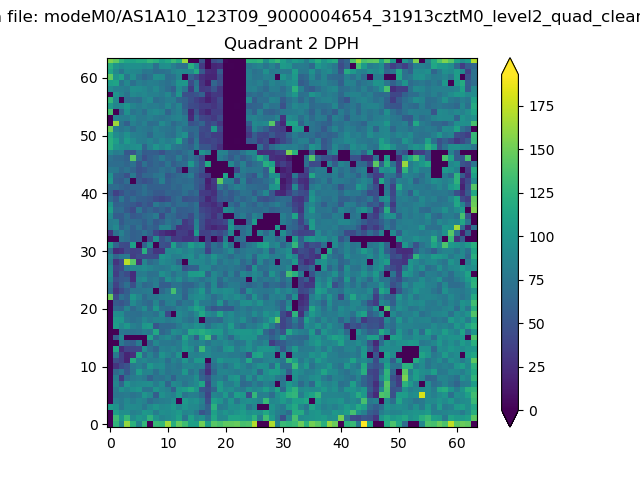
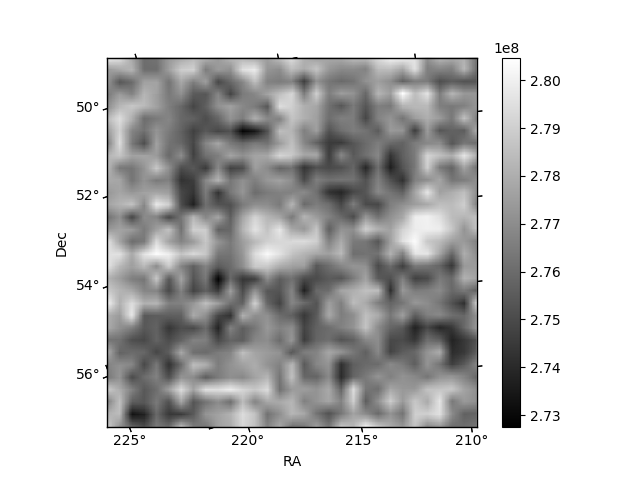
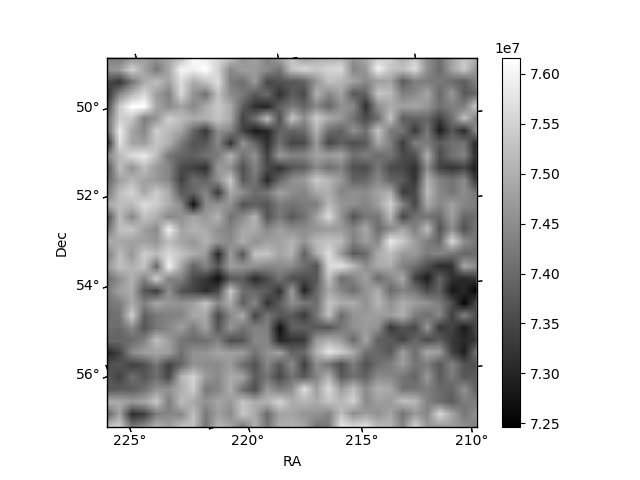
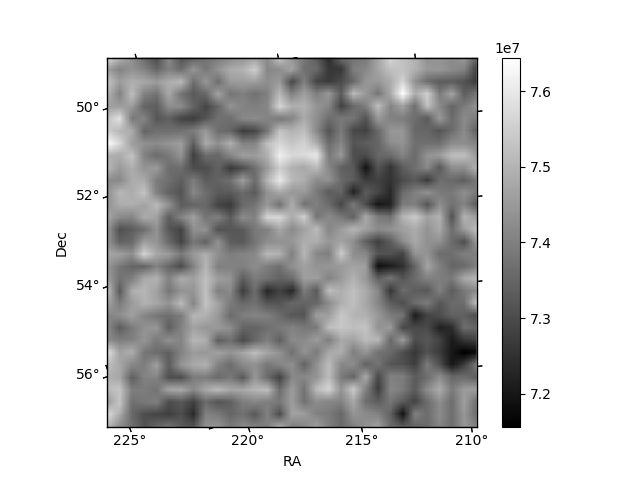
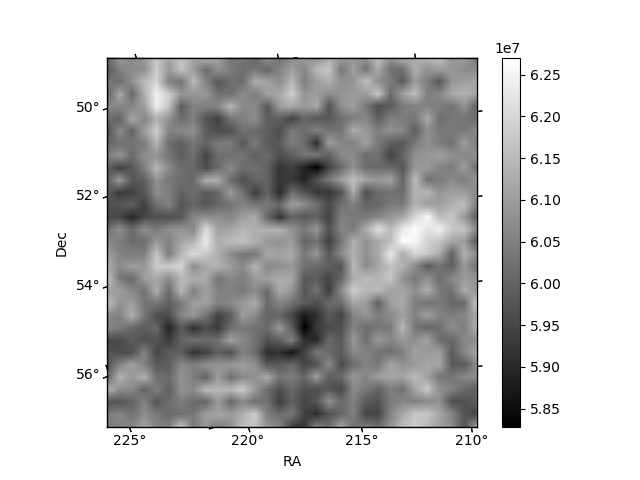
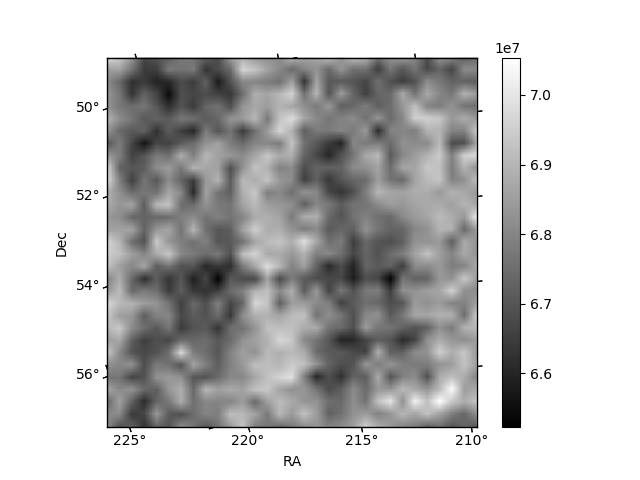
Histogram calculated using DETX and DETY for each event in the final _common_clean file
| Quadrant A | 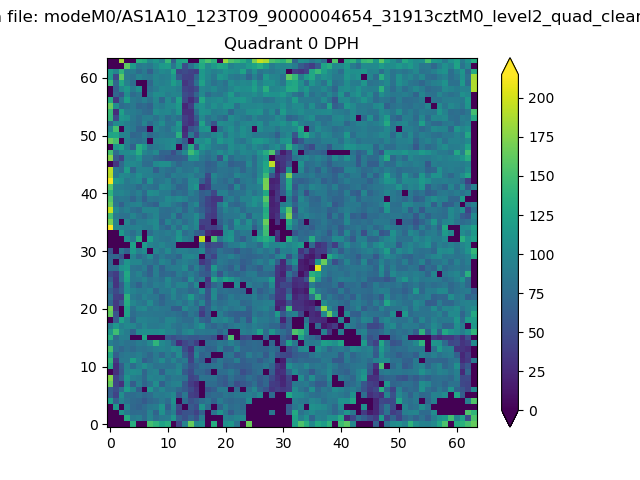 |
 |
Quadrant B |
|---|---|---|---|
| Quadrant D | 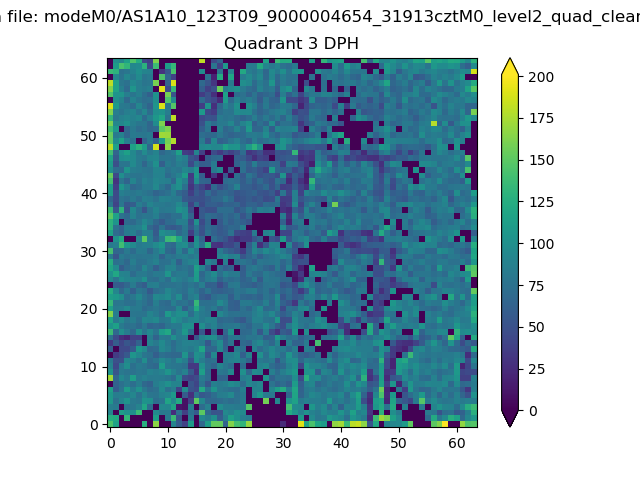 |
 |
Quadrant C |
| Plot type | Count rate plots | Images |
|---|---|---|
| Comparison with Poisson distribution Blue bars denote a histogram of data divided into 1 sec bins. Red curve is a Poisson curve with rate = median count rate of data. |
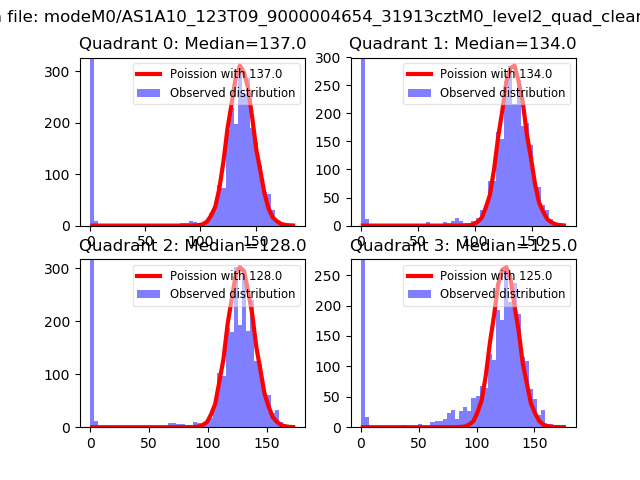 |
 |
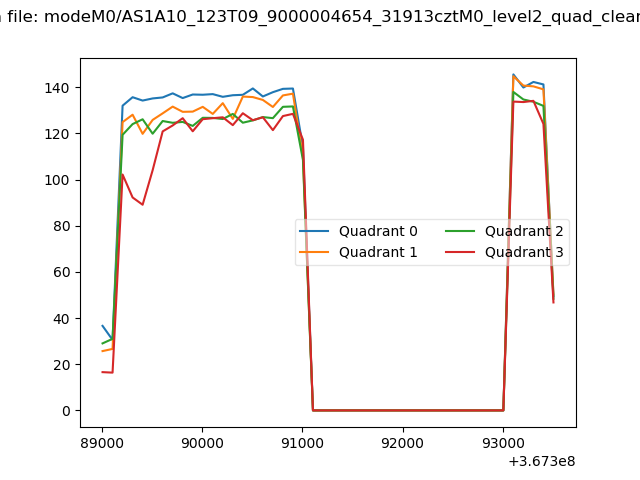
| Quadrant-wise count rates Data is divided into 100 sec bins |
 |
|
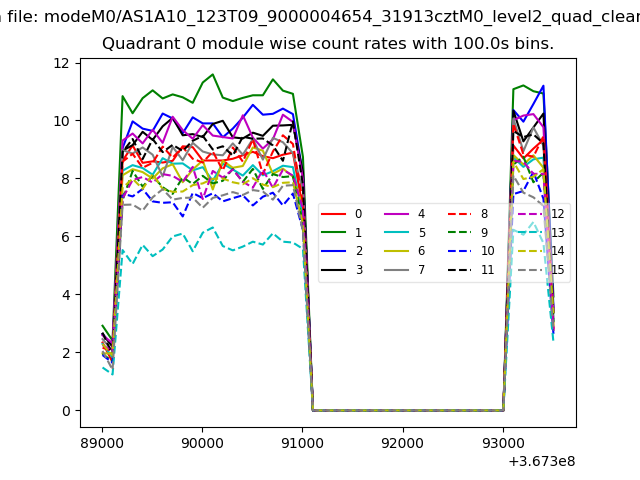
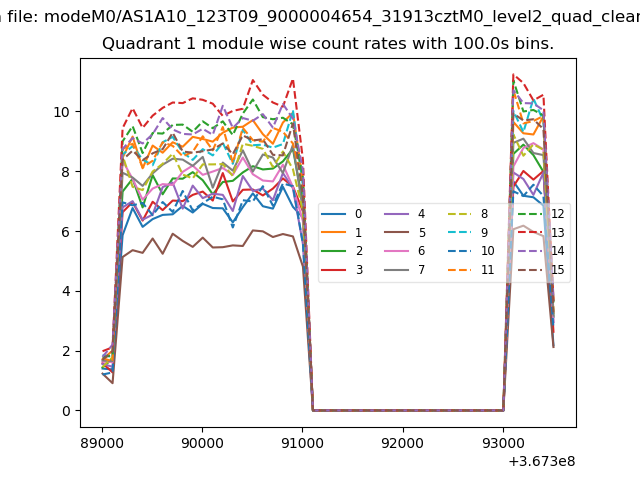
| Module-wise count rates for Quadrant A Data is divided into 100 sec bins |
 |
 |
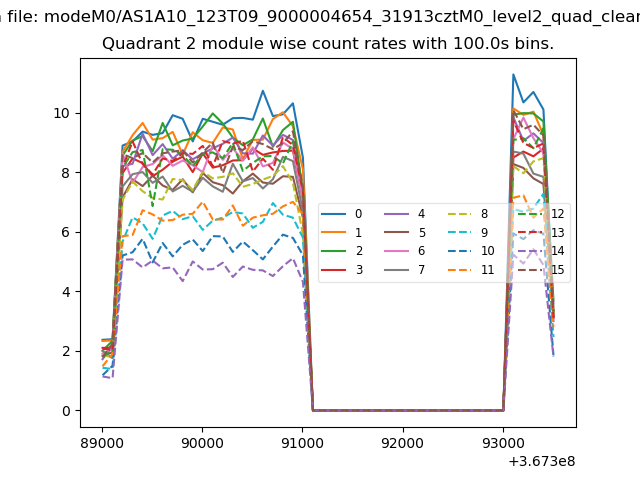
| Module-wise count rates for Quadrant B Data is divided into 100 sec bins |
 |
 |
| Module-wise count rates for Quadrant C Data is divided into 100 sec bins |
 |
 |
| Module-wise count rates for Quadrant D Data is divided into 100 sec bins |
 |
 |
| Parameter | Plot |
|---|---|
| CZT HV Monitor | 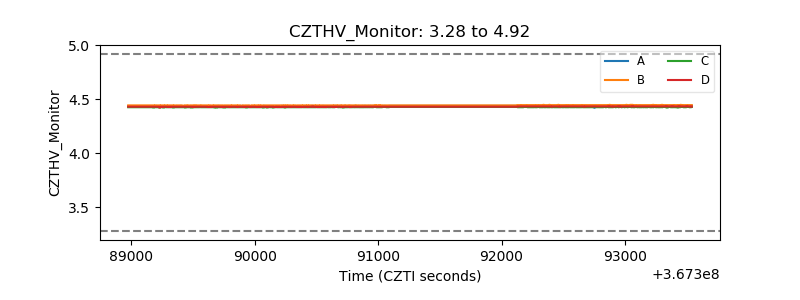 |
| D_VDD | 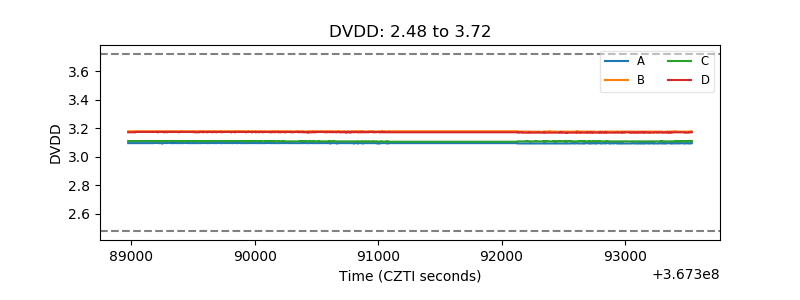 |
| Temperature 1 | 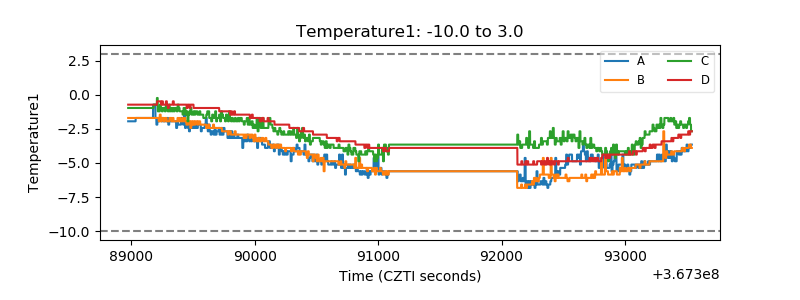 |
| Veto HV Monitor | 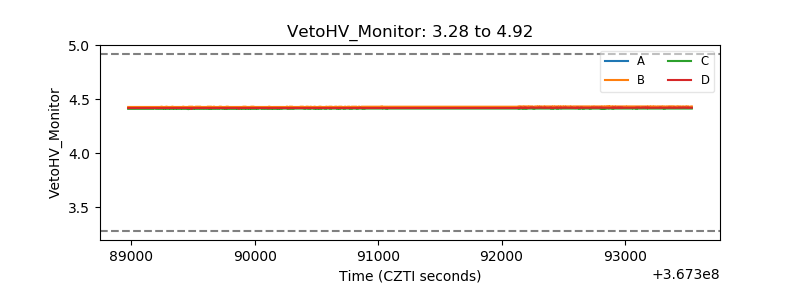 |
| Veto LLD | 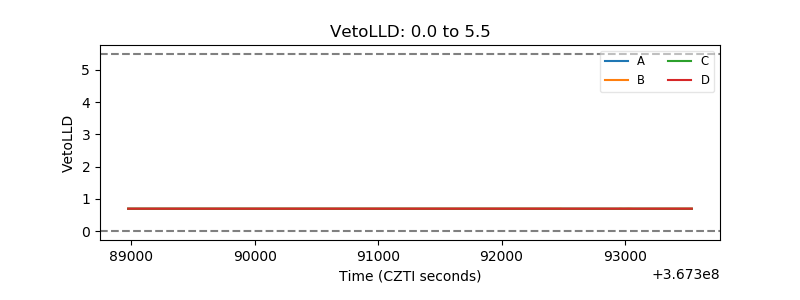 |
| Alpha Counter | 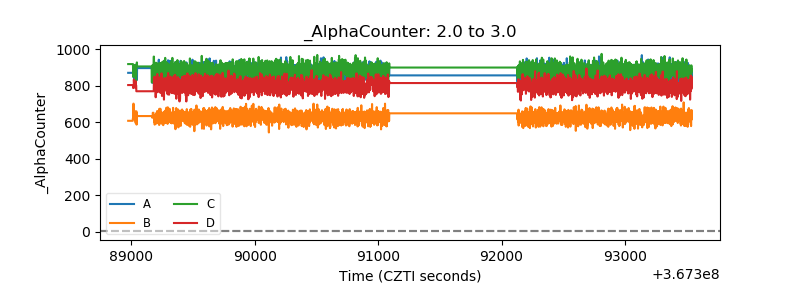 |
| _CPM_Rate | 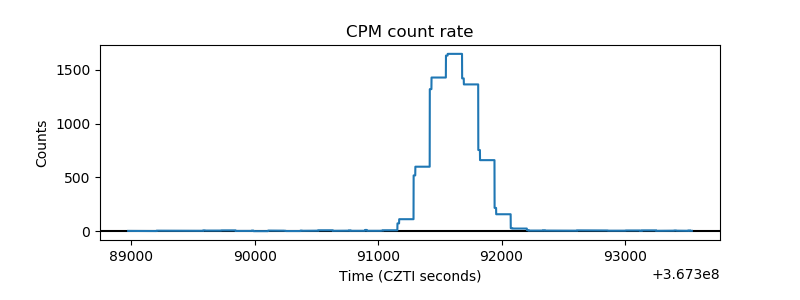 |
| CZT Counter | 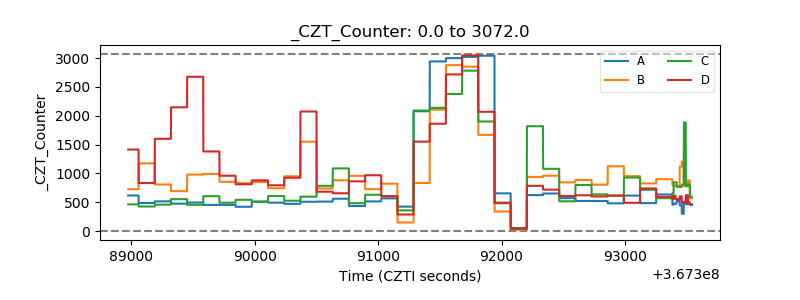 |
| +2.5 Volts monitor | 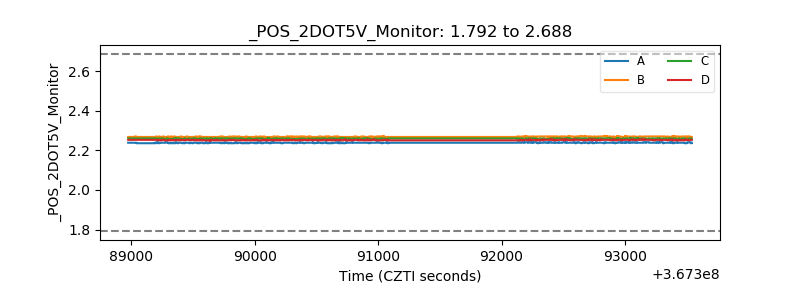 |
| +5 Volts monitor |  |
| _ROLL_ROT |  |
| _Roll_DEC | 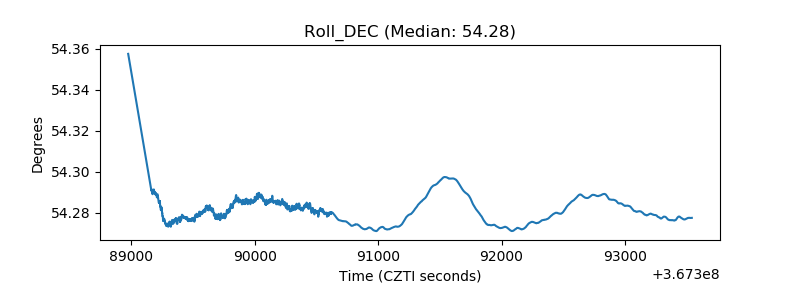 |
| _Roll_RA | 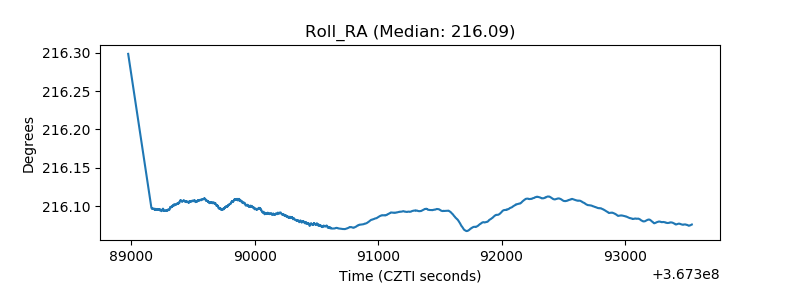 |
| Veto Counter | 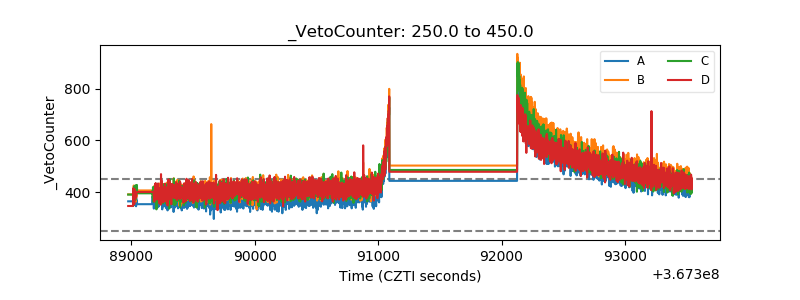 |