| Param | Original file | Final file |
|---|---|---|
| Filename | modeM0/AS1A10_123T09_9000004654_31915cztM0_level2.evt | modeM0/AS1A10_123T09_9000004654_31915cztM0_level2_quad_clean.evt |
| Size (bytes) | 1,134,558,720 | 161,864,640 |
| Size | 1.1 GB | 154.4 MB |
| Events in quadrant A | 6,031,414 | 1,081,313 |
| Events in quadrant B | 9,561,703 | 1,034,591 |
| Events in quadrant C | 7,878,633 | 997,910 |
| Events in quadrant D | 10,082,977 | 961,152 |
| Mode M0 | |||
|---|---|---|---|
| Quadrant | BADHDUFLAG | Total packets | Discarded packets |
| A | 0 | 30574 | 4974 |
| B | 0 | 45588 | 8577 |
| C | 0 | 39504 | 8131 |
| D | 0 | 48220 | 9864 |
| Mode SS | |||
|---|---|---|---|
| Quadrant | BADHDUFLAG | Total packets | Discarded packets |
| A | 0 | 296 | 47 |
| B | 0 | 301 | 57 |
| C | 0 | 302 | 48 |
| D | 0 | 303 | 61 |
| Mode M9 | |||
|---|---|---|---|
| Quadrant | BADHDUFLAG | Total packets | Discarded packets |
| A | 0 | 35 | 6 |
| B | 0 | 39 | 10 |
| C | 0 | 45 | 17 |
| D | 0 | 38 | 8 |
| Quadrant | Total seconds | Saturated seconds | Saturation percentage |
|---|---|---|---|
| A | 12113 | 131 | 1.081483% |
| B | 11859 | 322 | 2.715237% |
| C | 11914 | 489 | 4.104415% |
| D | 11894 | 637 | 5.355641% |
Noise dominated data is calculated using 1-second bins in cleaned event files. If a bin has >2000 counts, and if more than 50% of those come from <1% of pixels, then it is considered to be noise-dominated and hence unusable.
| Quadrant | # 1 sec bins | Bins with >0 counts | Bins with >2000 counts | High rate bins dominated by noise | Noise dominated (total time) | Noise dominated (detector-on time) | Marked lightcurve |
|---|---|---|---|---|---|---|---|
| A | 19463 | 12489 | 3 | 3 | 0.02% | 0.02% | 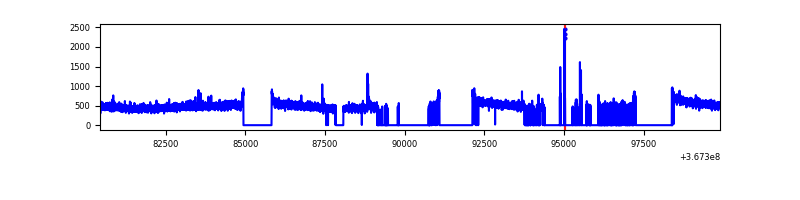 |
| B | 19463 | 12207 | 22 | 22 | 0.11% | 0.18% | 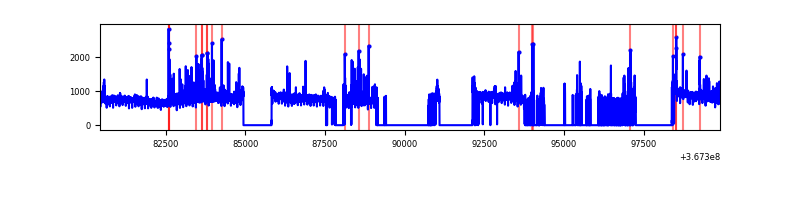 |
| C | 19463 | 12268 | 84 | 84 | 0.43% | 0.68% | 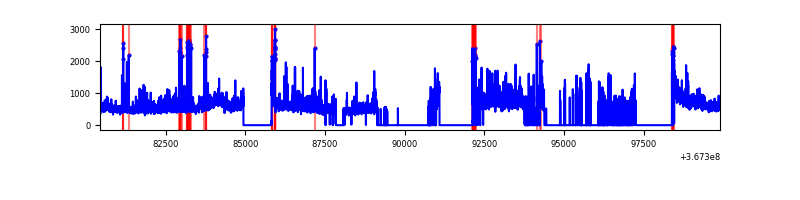 |
| D | 19463 | 12240 | 562 | 562 | 2.89% | 4.59% | 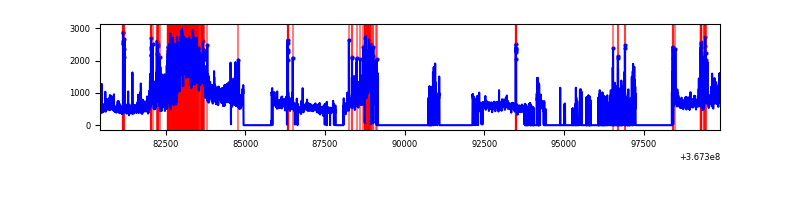 |
Top three noisy pixels from each quadrant. If the there are fewer than three noisy pixels in the level2.evt file, extra rows are filled as -1
| Pixel properties | Quadrant properties | ||||||
|---|---|---|---|---|---|---|---|
| Quadrant | DetID | PixID | Counts | Sigma | Mean | Median | Sigma |
| A | 12 | 96 | 26483 | 80.98 | 1549 | 1516 | 308.3 |
| A | 13 | 254 | 22863 | 69.24 | 1549 | 1516 | 308.3 |
| A | 15 | 174 | 17976 | 53.39 | 1549 | 1516 | 308.3 |
| B | 6 | 159 | 3178905 | 11257.16 | 1485 | 1448 | 282.3 |
| B | 4 | 80 | 137696 | 482.7 | 1485 | 1448 | 282.3 |
| B | 12 | 18 | 135618 | 475.34 | 1485 | 1448 | 282.3 |
| C | 3 | 233 | 1215914 | 3697.83 | 1414 | 1422 | 328.4 |
| C | 0 | 10 | 816886 | 2482.89 | 1414 | 1422 | 328.4 |
| C | 14 | 238 | 238025 | 720.4 | 1414 | 1422 | 328.4 |
| D | 12 | 33 | 2673564 | 7909.15 | 1437 | 1400 | 337.9 |
| D | 8 | 195 | 1578261 | 4667.24 | 1437 | 1400 | 337.9 |
| D | 13 | 249 | 88767 | 258.59 | 1437 | 1400 | 337.9 |
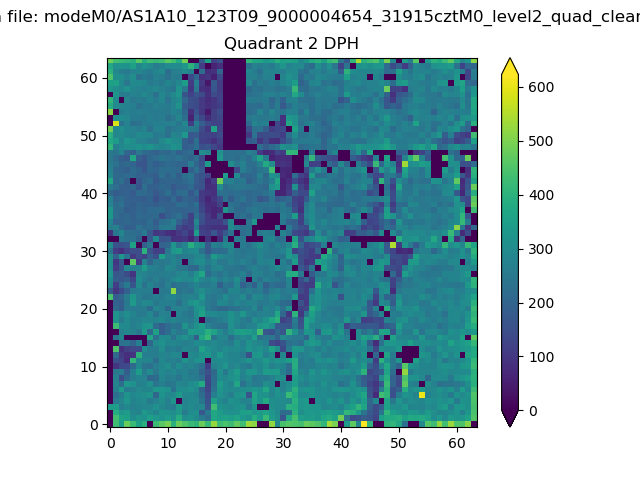
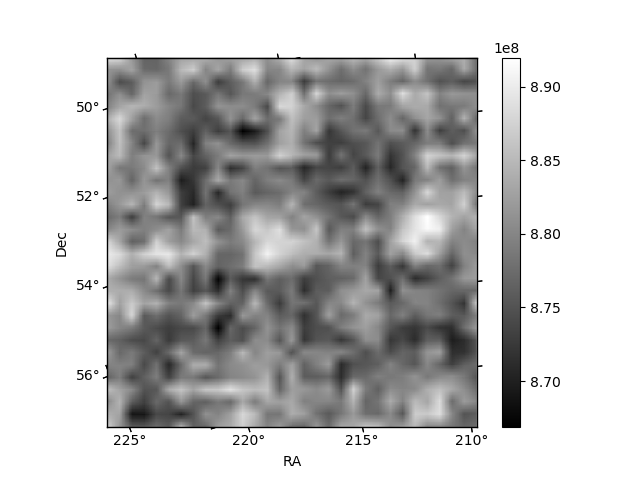
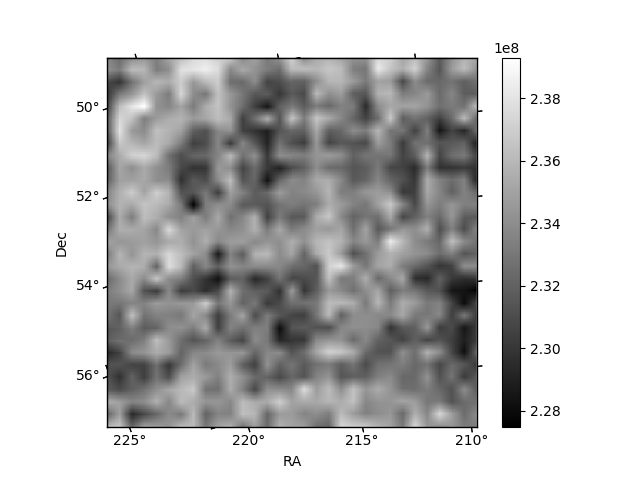
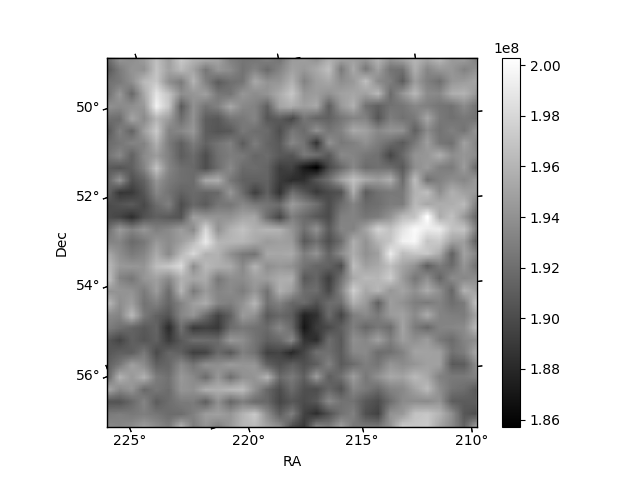
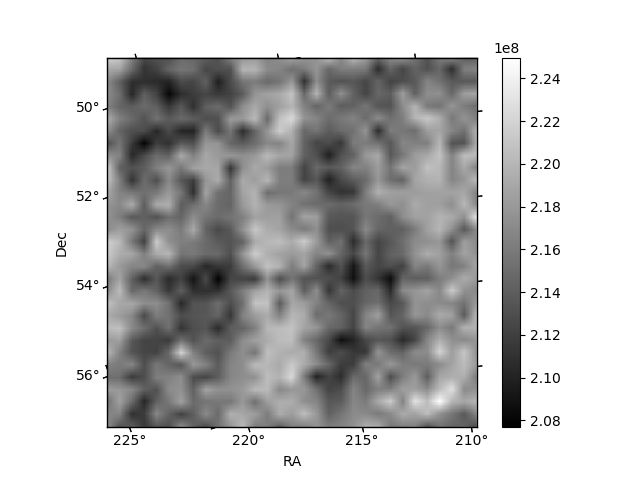
Histogram calculated using DETX and DETY for each event in the final _common_clean file
| Quadrant A | 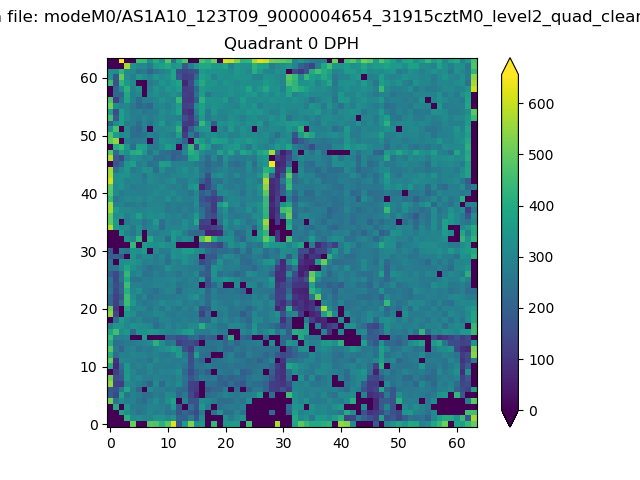 |
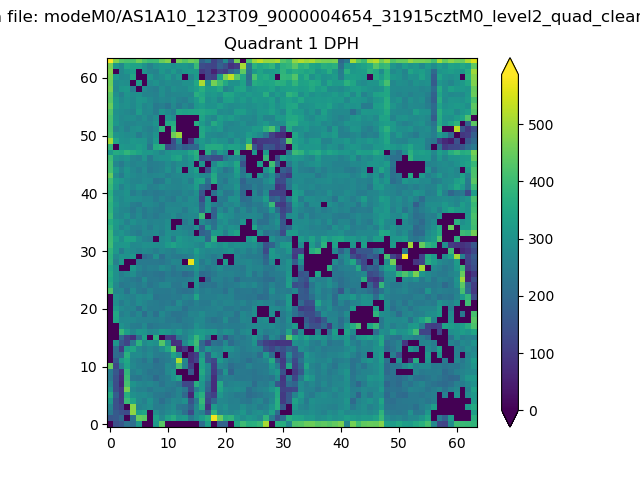 |
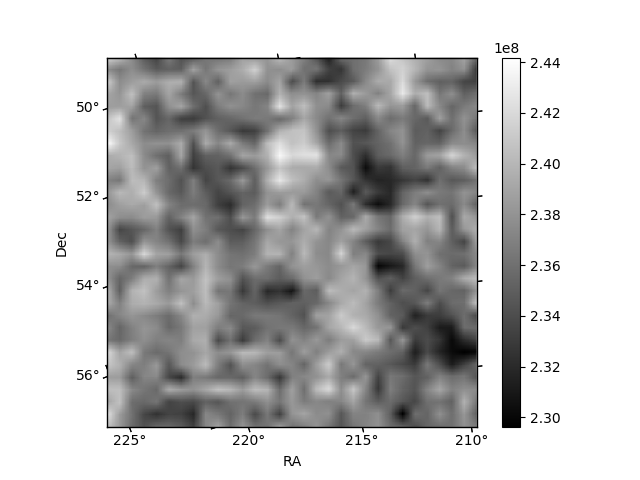
Quadrant B |
|---|---|---|---|
| Quadrant D | 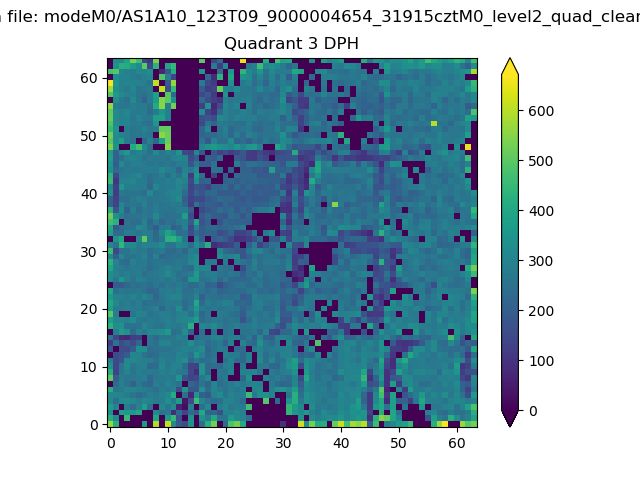 |
 |
Quadrant C |
| Plot type | Count rate plots | Images |
|---|---|---|
| Comparison with Poisson distribution Blue bars denote a histogram of data divided into 1 sec bins. Red curve is a Poisson curve with rate = median count rate of data. |
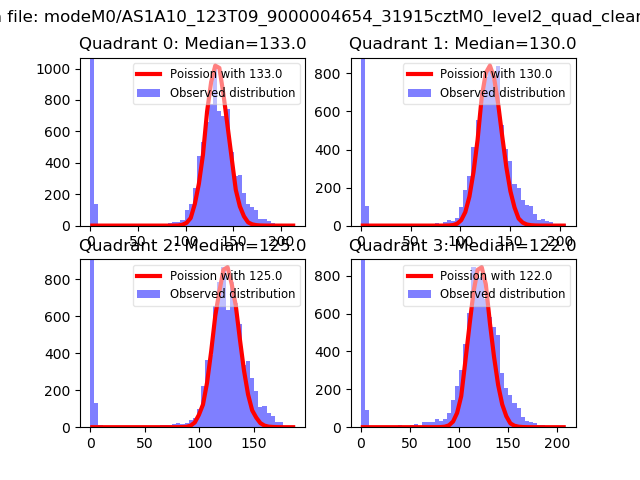 |
 |
| Quadrant-wise count rates Data is divided into 100 sec bins |
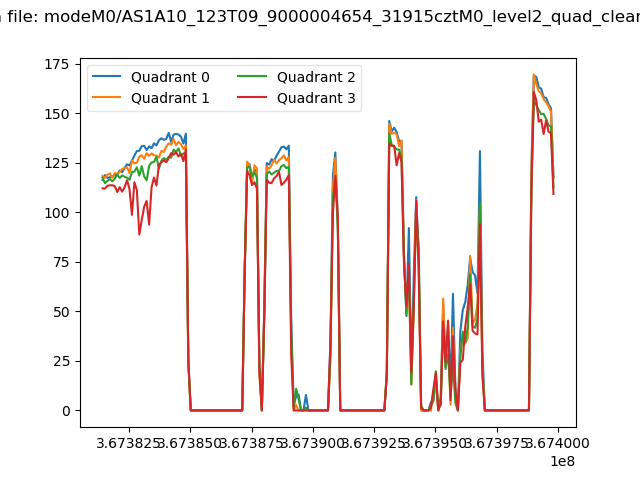 |
|
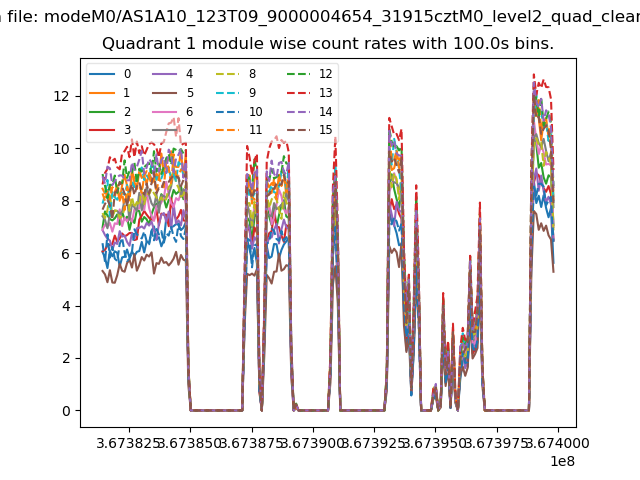
| Module-wise count rates for Quadrant A Data is divided into 100 sec bins |
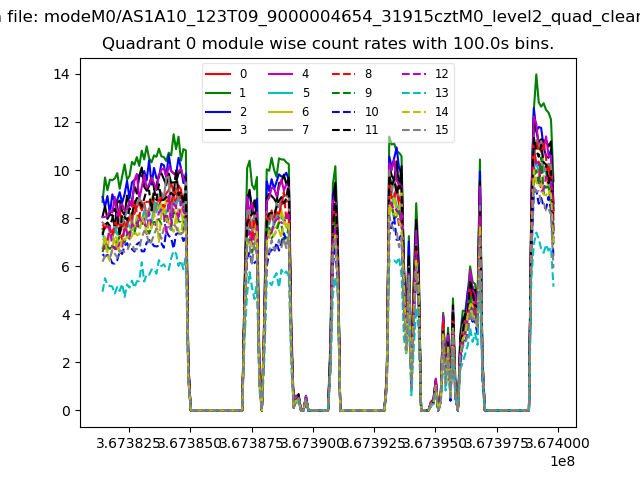 |
 |
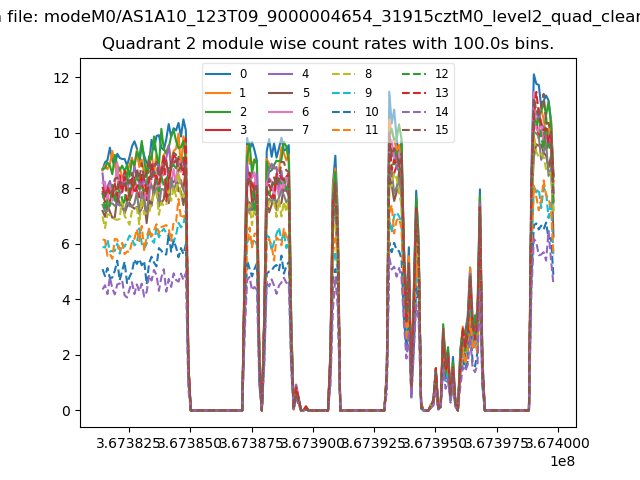
| Module-wise count rates for Quadrant B Data is divided into 100 sec bins |
 |
 |
| Module-wise count rates for Quadrant C Data is divided into 100 sec bins |
 |
 |
| Module-wise count rates for Quadrant D Data is divided into 100 sec bins |
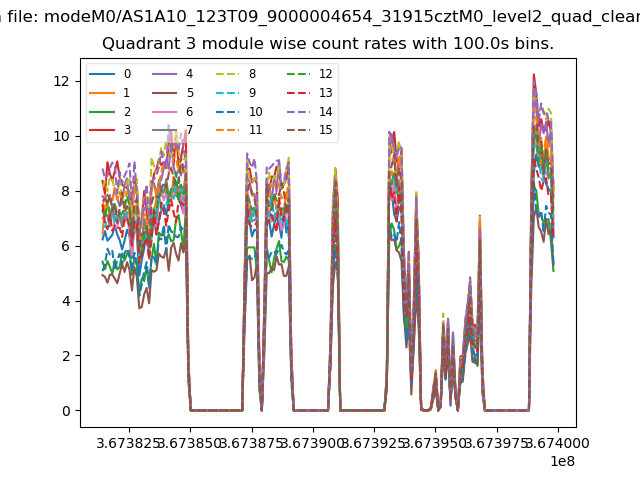 |
 |
| Parameter | Plot |
|---|---|
| CZT HV Monitor | 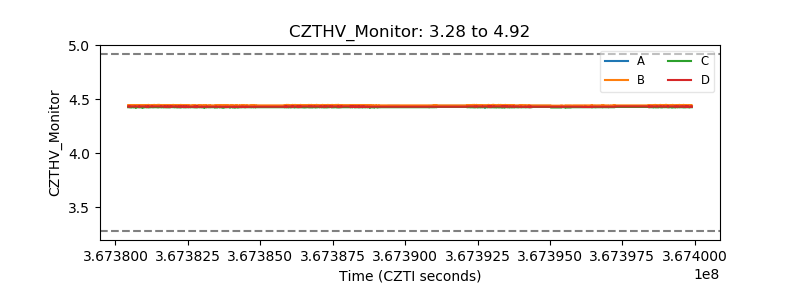 |
| D_VDD | 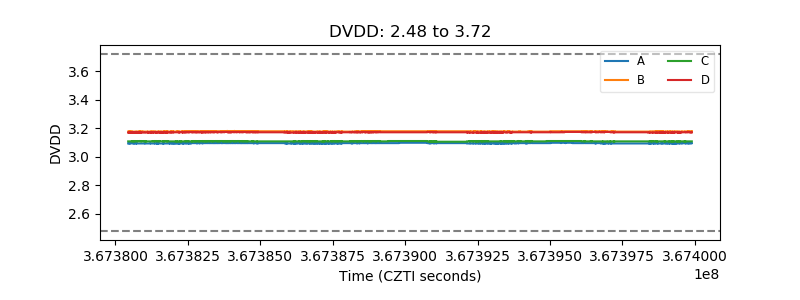 |
| Temperature 1 | 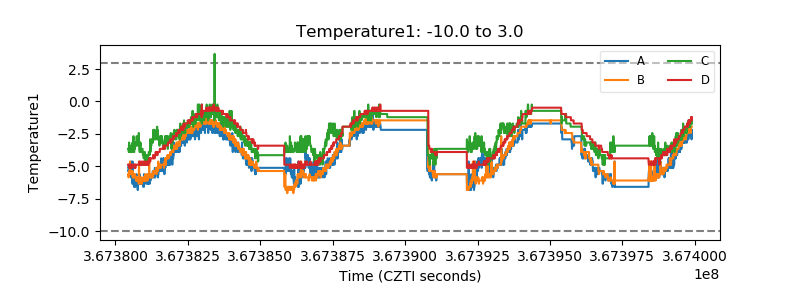 |
| Veto HV Monitor | 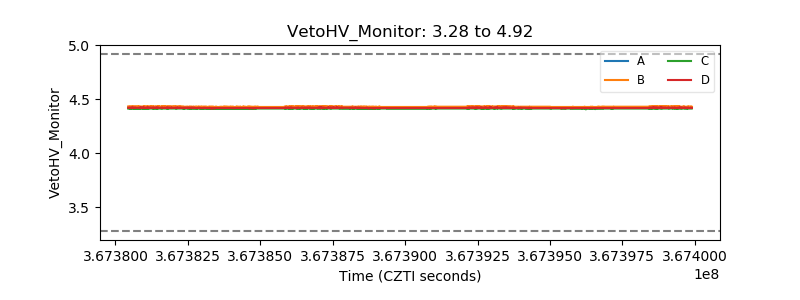 |
| Veto LLD | 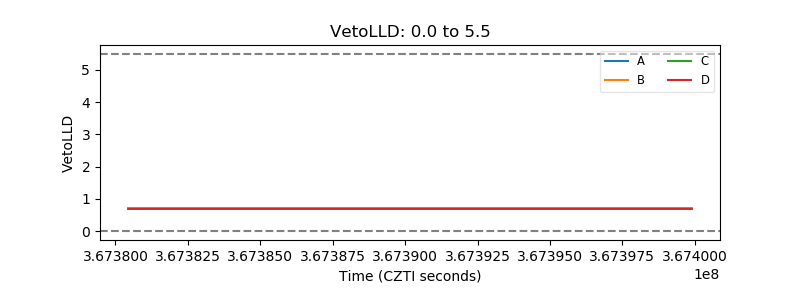 |
| Alpha Counter | 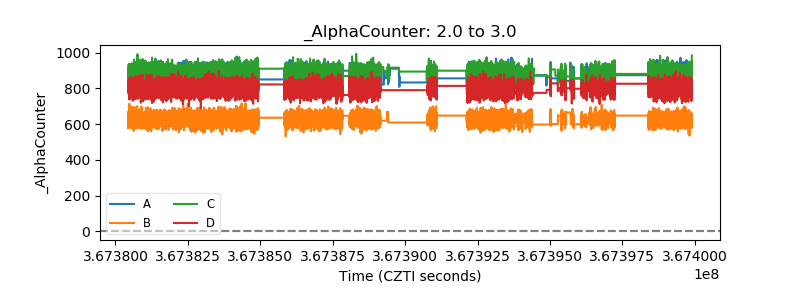 |
| _CPM_Rate | 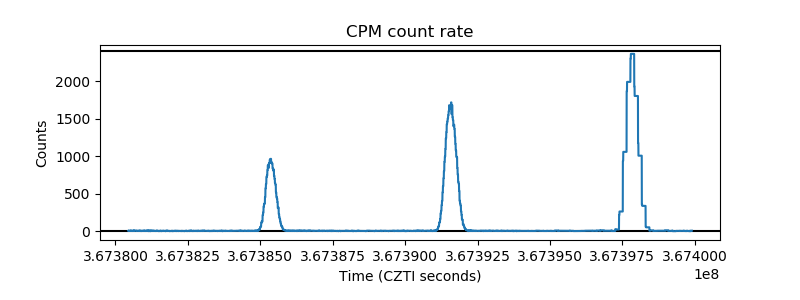 |
| CZT Counter | 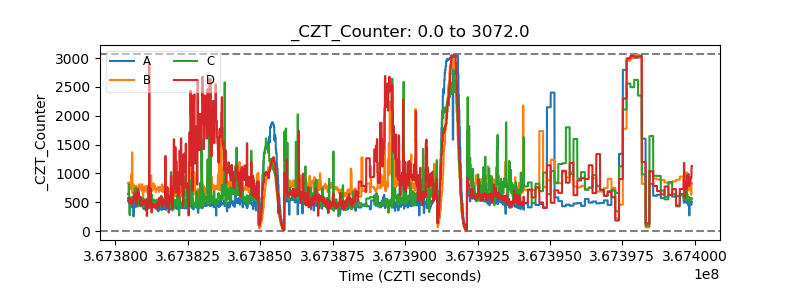 |
| +2.5 Volts monitor | 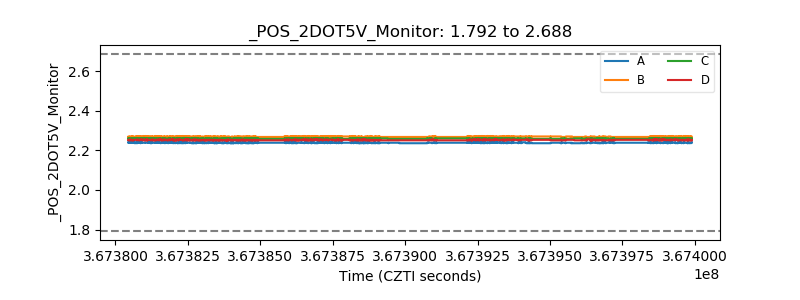 |
| +5 Volts monitor |  |
| _ROLL_ROT | 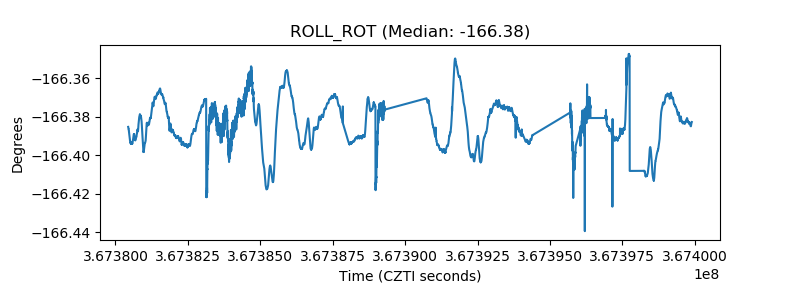 |
| _Roll_DEC | 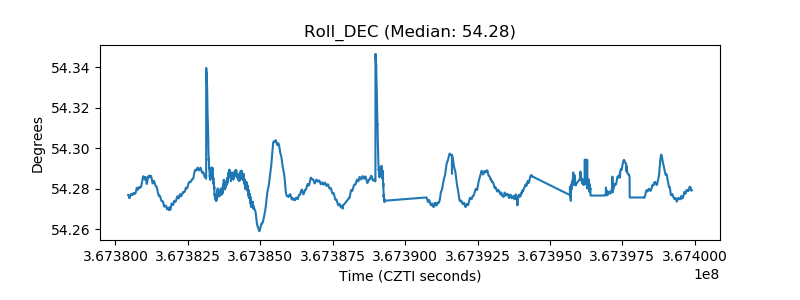 |
| _Roll_RA | 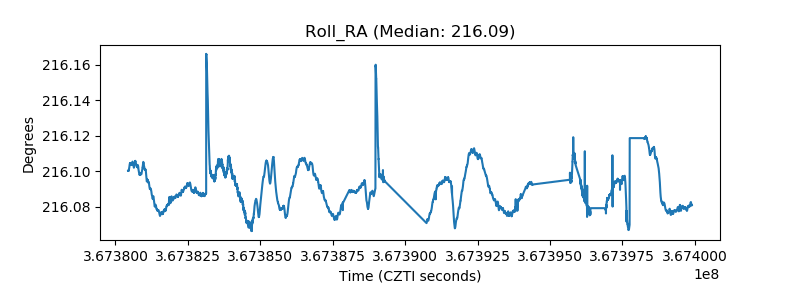 |
| Veto Counter | 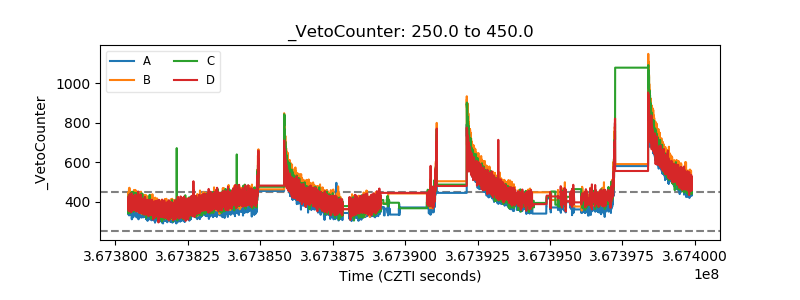 |