| Param | Original file | Final file |
|---|---|---|
| Filename | modeM0/AS1A10_123T09_9000004654_31916cztM0_level2.evt | modeM0/AS1A10_123T09_9000004654_31916cztM0_level2_quad_clean.evt |
| Size (bytes) | 772,176,960 | 111,983,040 |
| Size | 736.4 MB | 106.8 MB |
| Events in quadrant A | 3,421,961 | 797,617 |
| Events in quadrant B | 6,149,097 | 769,134 |
| Events in quadrant C | 4,591,789 | 727,459 |
| Events in quadrant D | 8,796,189 | 654,699 |
| Mode M0 | |||
|---|---|---|---|
| Quadrant | BADHDUFLAG | Total packets | Discarded packets |
| A | 0 | 14155 | 2 |
| B | 0 | 22703 | 2 |
| C | 0 | 18307 | 2 |
| D | 0 | 30687 | 2 |
| Mode SS | |||
|---|---|---|---|
| Quadrant | BADHDUFLAG | Total packets | Discarded packets |
| A | 0 | 130 | 0 |
| B | 0 | 130 | 0 |
| C | 0 | 130 | 0 |
| D | 0 | 130 | 0 |
| Mode M9 | |||
|---|---|---|---|
| Quadrant | BADHDUFLAG | Total packets | Discarded packets |
| A | 0 | 12 | 0 |
| B | 0 | 13 | 0 |
| C | 0 | 13 | 0 |
| D | 0 | 13 | 0 |
| Quadrant | Total seconds | Saturated seconds | Saturation percentage |
|---|---|---|---|
| A | 6332 | 72 | 1.137081% |
| B | 6332 | 323 | 5.101074% |
| C | 6331 | 281 | 4.438477% |
| D | 6331 | 1526 | 24.103617% |
Noise dominated data is calculated using 1-second bins in cleaned event files. If a bin has >2000 counts, and if more than 50% of those come from <1% of pixels, then it is considered to be noise-dominated and hence unusable.
| Quadrant | # 1 sec bins | Bins with >0 counts | Bins with >2000 counts | High rate bins dominated by noise | Noise dominated (total time) | Noise dominated (detector-on time) | Marked lightcurve |
|---|---|---|---|---|---|---|---|
| A | 7567 | 6333 | 0 | 0 | 0.00% | 0.00% |  |
| B | 7567 | 6333 | 100 | 100 | 1.32% | 1.58% | 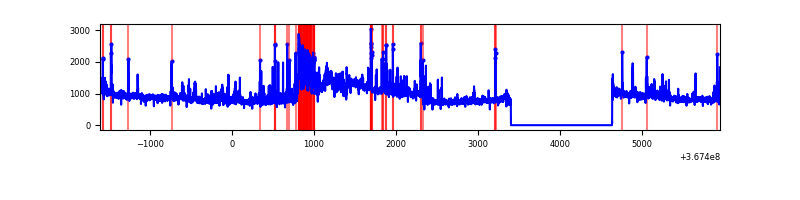 |
| C | 7566 | 6332 | 29 | 29 | 0.38% | 0.46% | 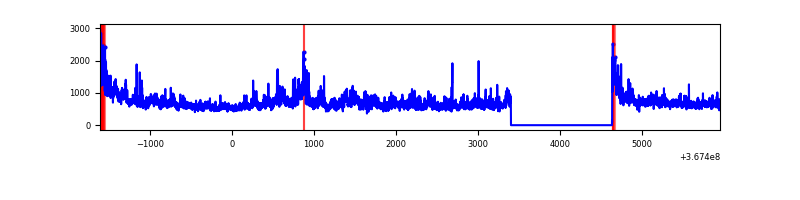 |
| D | 7566 | 6332 | 1571 | 1571 | 20.76% | 24.81% | 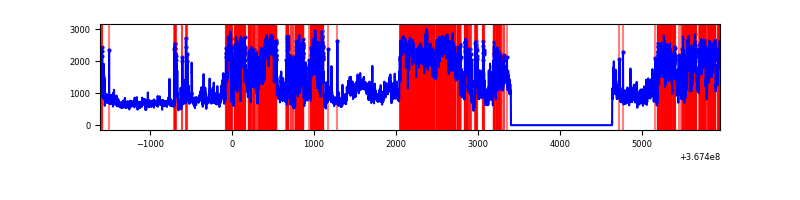 |
Top three noisy pixels from each quadrant. If the there are fewer than three noisy pixels in the level2.evt file, extra rows are filled as -1
| Pixel properties | Quadrant properties | ||||||
|---|---|---|---|---|---|---|---|
| Quadrant | DetID | PixID | Counts | Sigma | Mean | Median | Sigma |
| A | 13 | 254 | 12247 | 65.01 | 884 | 868 | 175.0 |
| A | 3 | 137 | 7950 | 40.46 | 884 | 868 | 175.0 |
| A | 0 | 226 | 7803 | 39.62 | 884 | 868 | 175.0 |
| B | 6 | 159 | 1678252 | 10689.47 | 849 | 831 | 156.9 |
| B | 4 | 80 | 690206 | 4393.08 | 849 | 831 | 156.9 |
| B | 5 | 172 | 148048 | 938.15 | 849 | 831 | 156.9 |
| C | 3 | 233 | 1006318 | 5455.02 | 803 | 807 | 184.3 |
| C | 0 | 10 | 274434 | 1484.46 | 803 | 807 | 184.3 |
| C | 14 | 238 | 139741 | 753.73 | 803 | 807 | 184.3 |
| D | 12 | 33 | 4569457 | 24758.69 | 789 | 772 | 184.5 |
| D | 8 | 195 | 1024328 | 5546.87 | 789 | 772 | 184.5 |
| D | 13 | 249 | 149772 | 807.46 | 789 | 772 | 184.5 |
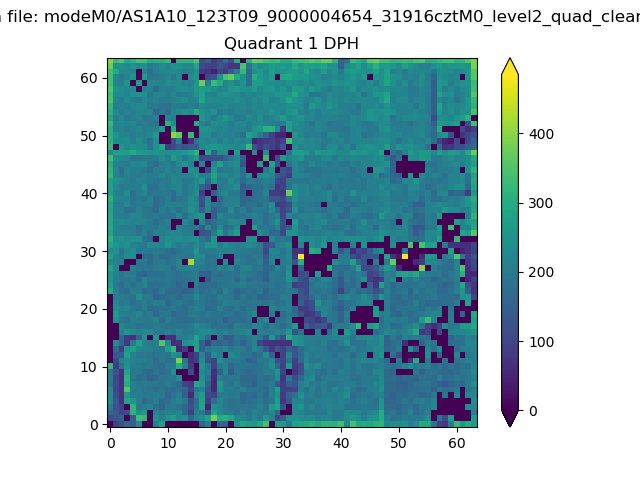
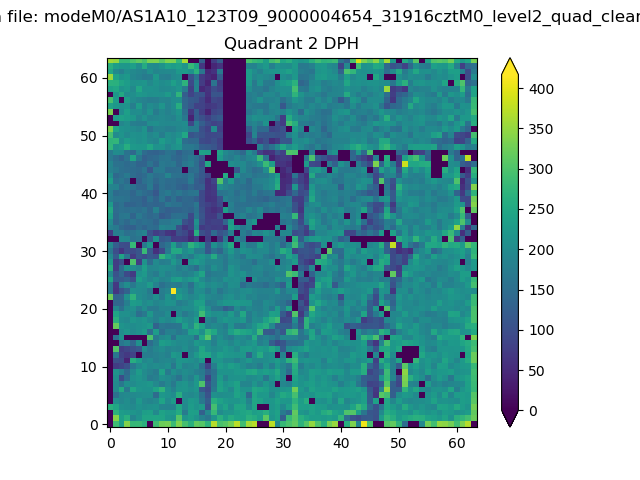
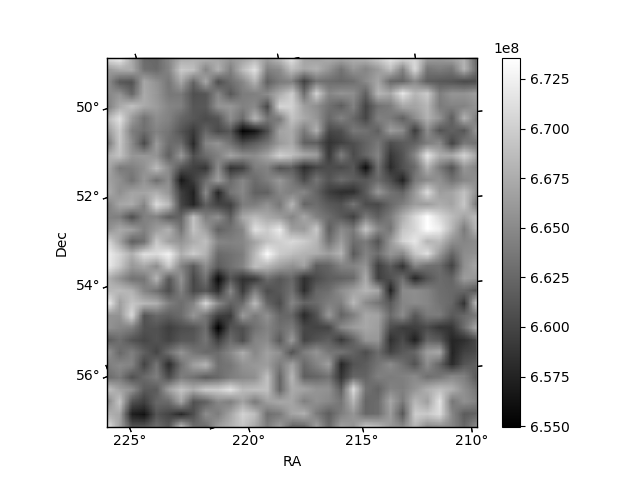
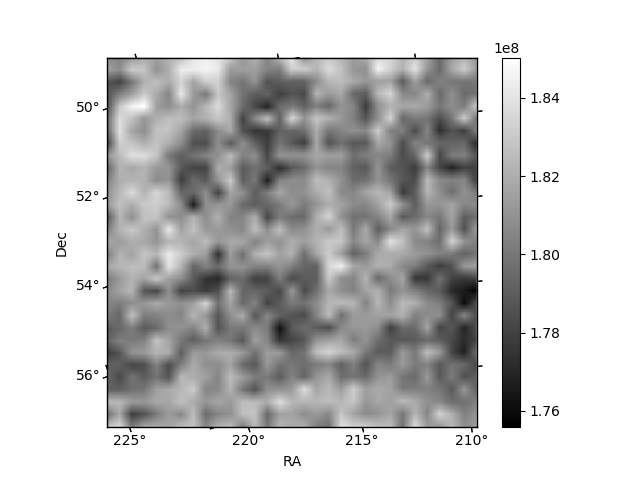
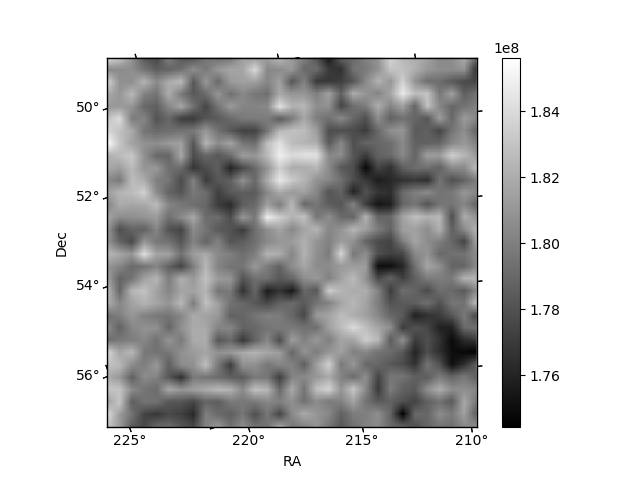
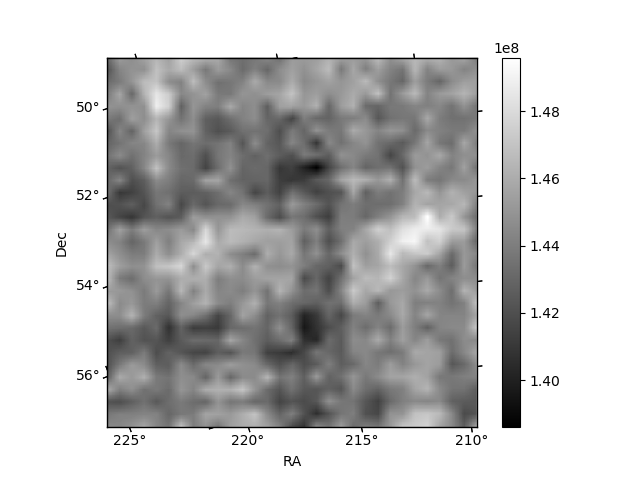
Histogram calculated using DETX and DETY for each event in the final _common_clean file
| Quadrant A | 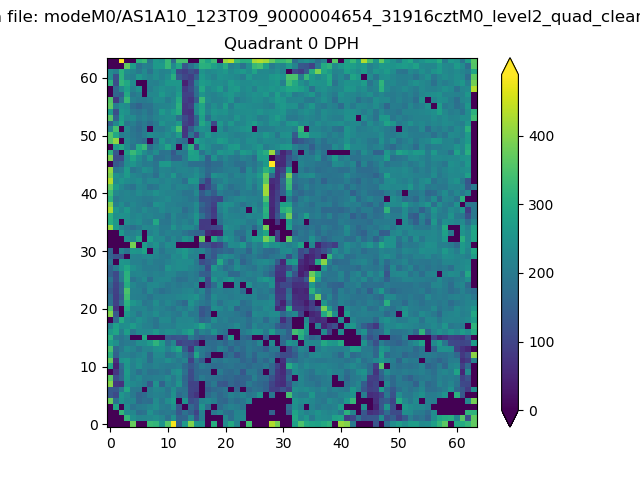 |
 |
Quadrant B |
|---|---|---|---|
| Quadrant D | 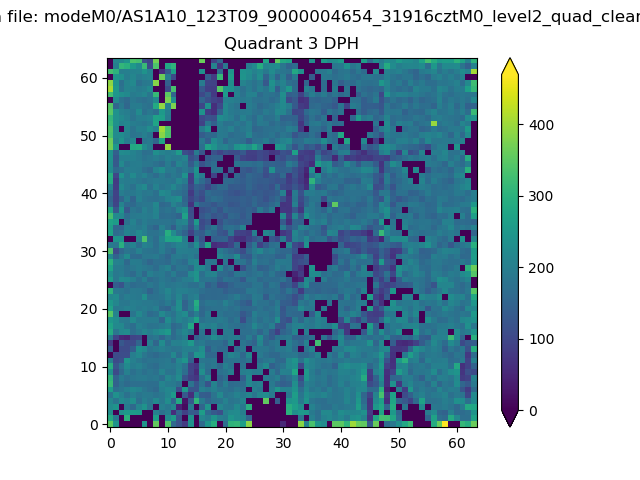 |
 |
Quadrant C |
| Plot type | Count rate plots | Images |
|---|---|---|
| Comparison with Poisson distribution Blue bars denote a histogram of data divided into 1 sec bins. Red curve is a Poisson curve with rate = median count rate of data. |
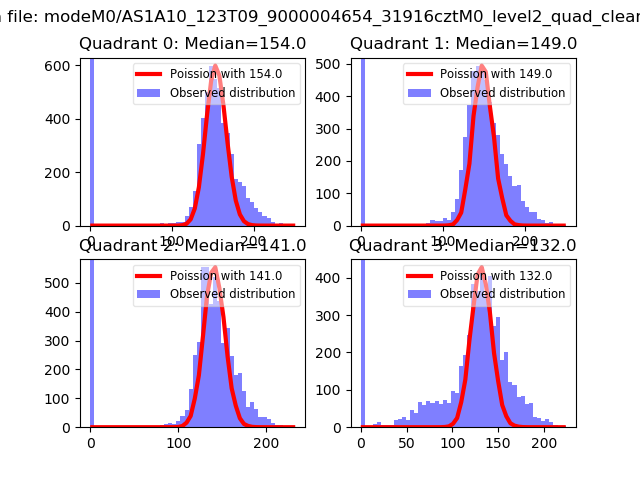 |
 |
| Quadrant-wise count rates Data is divided into 100 sec bins |
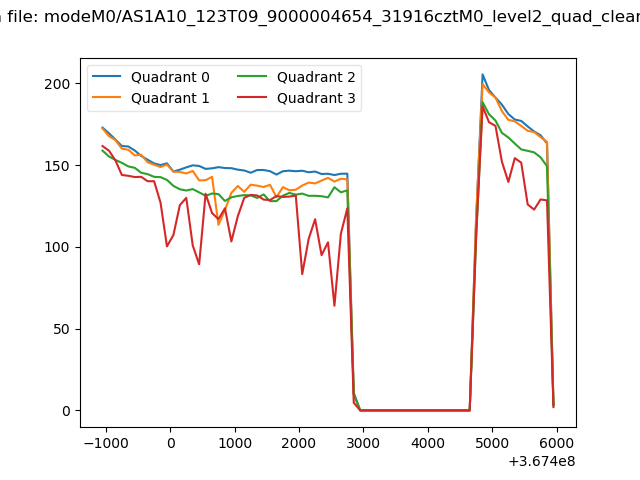 |
|
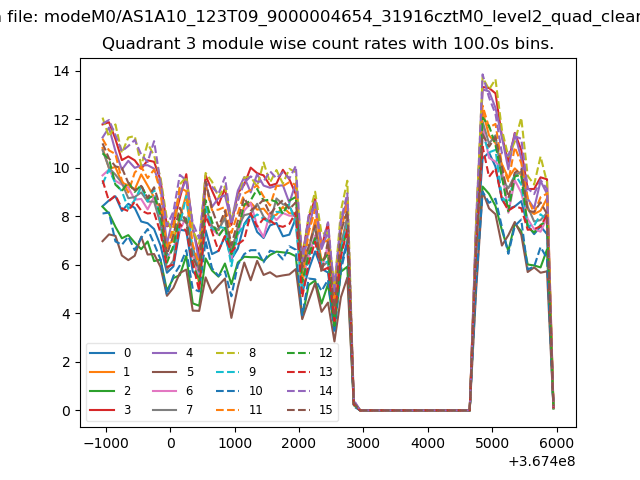
| Module-wise count rates for Quadrant A Data is divided into 100 sec bins |
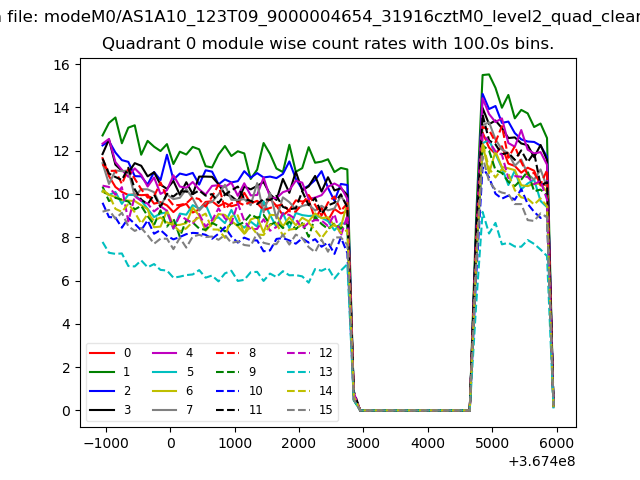 |
 |
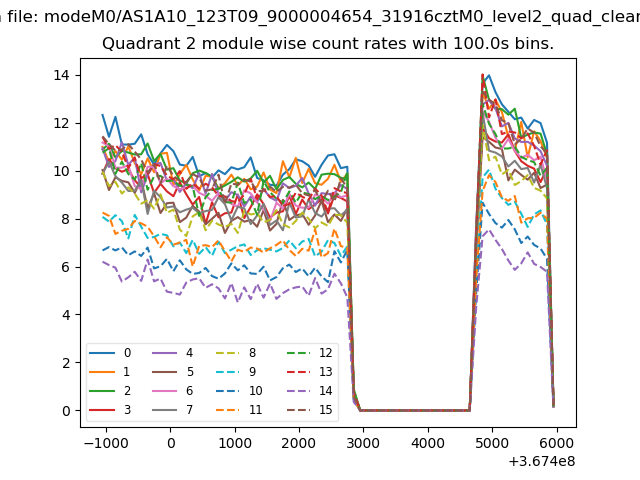
| Module-wise count rates for Quadrant B Data is divided into 100 sec bins |
 |
 |
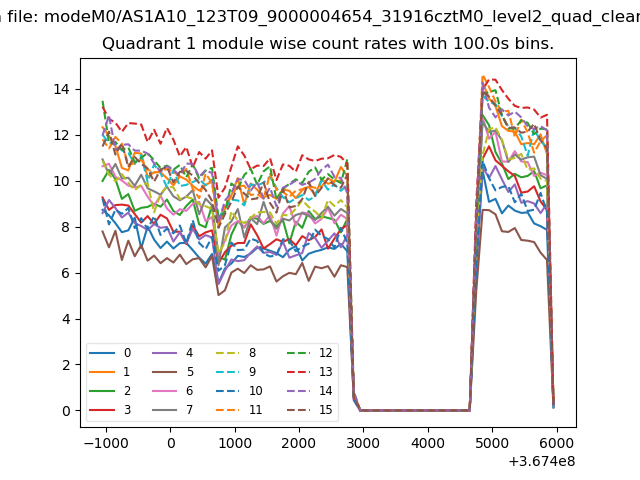
| Module-wise count rates for Quadrant C Data is divided into 100 sec bins |
 |
 |
| Module-wise count rates for Quadrant D Data is divided into 100 sec bins |
 |
 |
| Parameter | Plot |
|---|---|
| CZT HV Monitor | 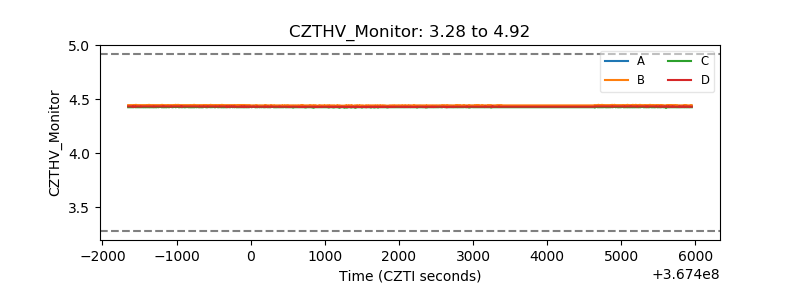 |
| D_VDD | 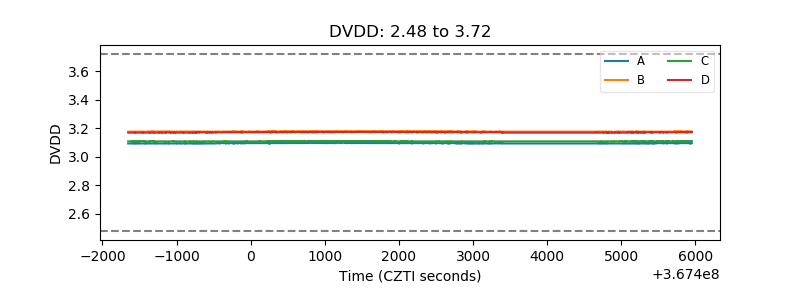 |
| Temperature 1 | 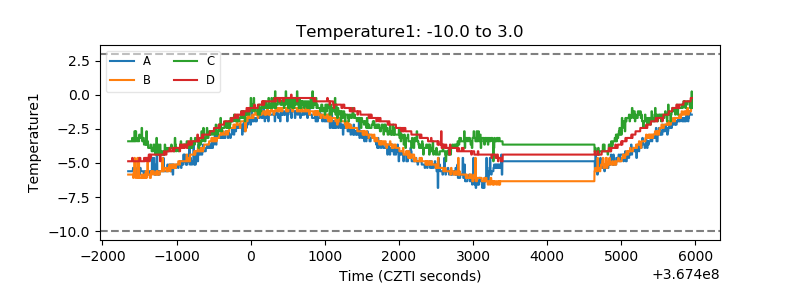 |
| Veto HV Monitor |  |
| Veto LLD |  |
| Alpha Counter | 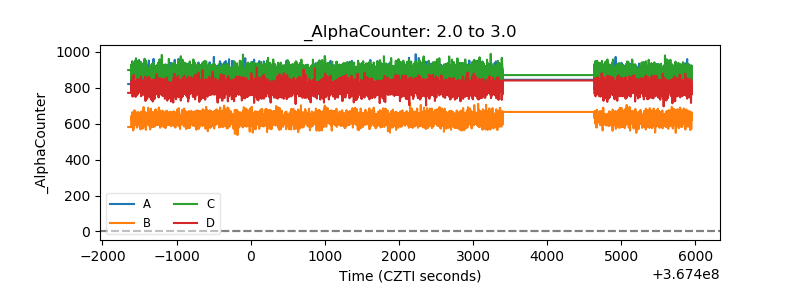 |
| _CPM_Rate | 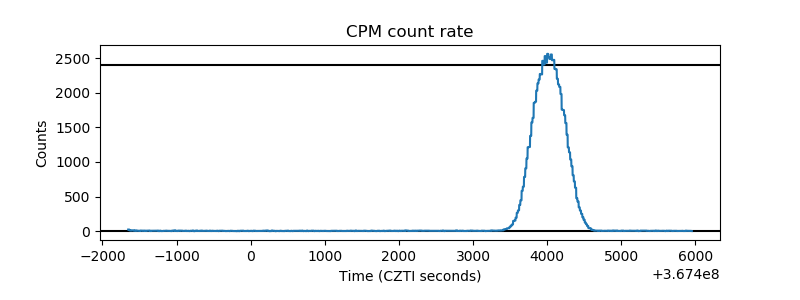 |
| CZT Counter | 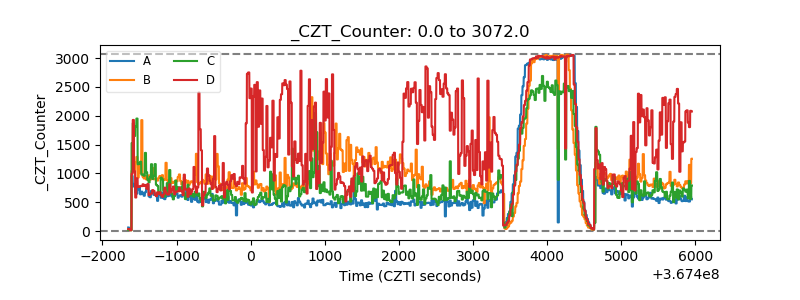 |
| +2.5 Volts monitor |  |
| +5 Volts monitor |  |
| _ROLL_ROT | 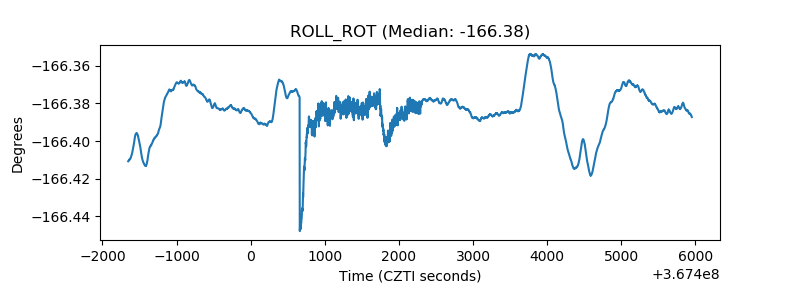 |
| _Roll_DEC | 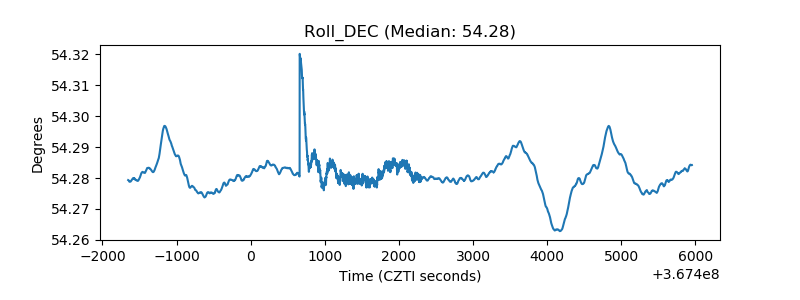 |
| _Roll_RA | 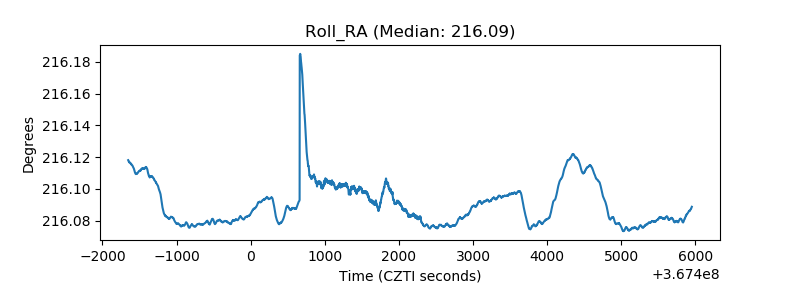 |
| Veto Counter | 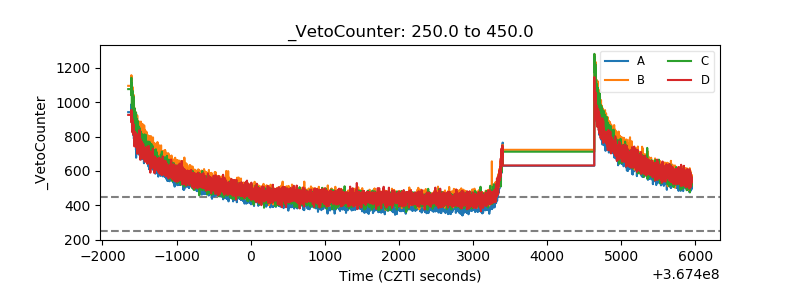 |