| Param | Original file | Final file |
|---|---|---|
| Filename | modeM0/AS1A10_123T09_9000004654_31918cztM0_level2.evt | modeM0/AS1A10_123T09_9000004654_31918cztM0_level2_quad_clean.evt |
| Size (bytes) | 1,000,474,560 | 103,728,960 |
| Size | 954.1 MB | 98.9 MB |
| Events in quadrant A | 3,414,045 | 838,860 |
| Events in quadrant B | 6,747,526 | 758,792 |
| Events in quadrant C | 5,019,474 | 757,792 |
| Events in quadrant D | 14,687,774 | 336,897 |
| Mode M0 | |||
|---|---|---|---|
| Quadrant | BADHDUFLAG | Total packets | Discarded packets |
| A | 0 | 14008 | 1 |
| B | 0 | 24182 | 1 |
| C | 0 | 19678 | 1 |
| D | 0 | 47977 | 8 |
| Mode SS | |||
|---|---|---|---|
| Quadrant | BADHDUFLAG | Total packets | Discarded packets |
| A | 0 | 132 | 0 |
| B | 0 | 132 | 0 |
| C | 0 | 132 | 0 |
| D | 0 | 132 | 0 |
| Mode M9 | |||
|---|---|---|---|
| Quadrant | BADHDUFLAG | Total packets | Discarded packets |
| A | 0 | 12 | 0 |
| B | 0 | 12 | 0 |
| C | 0 | 12 | 0 |
| D | 0 | 12 | 0 |
| Quadrant | Total seconds | Saturated seconds | Saturation percentage |
|---|---|---|---|
| A | 6396 | 115 | 1.797999% |
| B | 6397 | 818 | 12.787244% |
| C | 6397 | 279 | 4.361419% |
| D | 6396 | 5230 | 81.769856% |
Noise dominated data is calculated using 1-second bins in cleaned event files. If a bin has >2000 counts, and if more than 50% of those come from <1% of pixels, then it is considered to be noise-dominated and hence unusable.
| Quadrant | # 1 sec bins | Bins with >0 counts | Bins with >2000 counts | High rate bins dominated by noise | Noise dominated (total time) | Noise dominated (detector-on time) | Marked lightcurve |
|---|---|---|---|---|---|---|---|
| A | 7671 | 6397 | 0 | 0 | 0.00% | 0.00% |  |
| B | 7672 | 6398 | 549 | 549 | 7.16% | 8.58% |  |
| C | 7672 | 6398 | 53 | 53 | 0.69% | 0.83% |  |
| D | 7671 | 6397 | 5103 | 5103 | 66.52% | 79.77% |  |
Top three noisy pixels from each quadrant. If the there are fewer than three noisy pixels in the level2.evt file, extra rows are filled as -1
| Pixel properties | Quadrant properties | ||||||
|---|---|---|---|---|---|---|---|
| Quadrant | DetID | PixID | Counts | Sigma | Mean | Median | Sigma |
| A | 13 | 6 | 17214 | 95.29 | 880 | 868 | 171.5 |
| A | 13 | 254 | 13207 | 71.93 | 880 | 868 | 171.5 |
| A | 0 | 226 | 7684 | 39.73 | 880 | 868 | 171.5 |
| B | 6 | 159 | 1697152 | 11368.09 | 813 | 797 | 149.2 |
| B | 5 | 172 | 737693 | 4938.29 | 813 | 797 | 149.2 |
| B | 12 | 18 | 657178 | 4398.72 | 813 | 797 | 149.2 |
| C | 3 | 233 | 1335284 | 7164.49 | 814 | 818 | 186.3 |
| C | 0 | 10 | 321094 | 1719.5 | 814 | 818 | 186.3 |
| C | 14 | 238 | 134612 | 718.31 | 814 | 818 | 186.3 |
| D | 12 | 33 | 11803095 | 113188.64 | 443 | 434 | 104.3 |
| D | 8 | 195 | 844105 | 8090.89 | 443 | 434 | 104.3 |
| D | 12 | 233 | 196798 | 1883.15 | 443 | 434 | 104.3 |
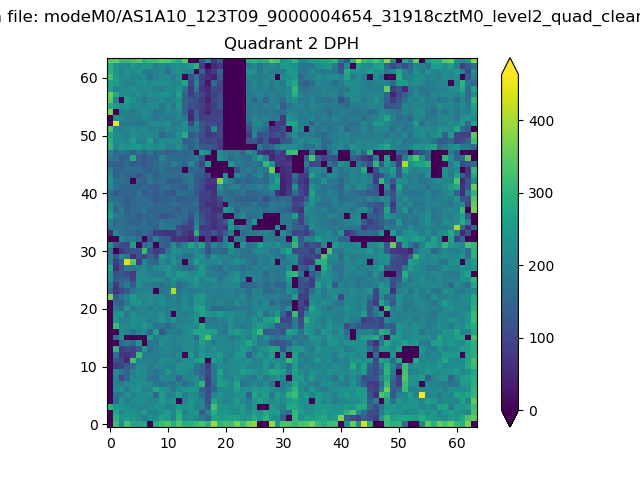
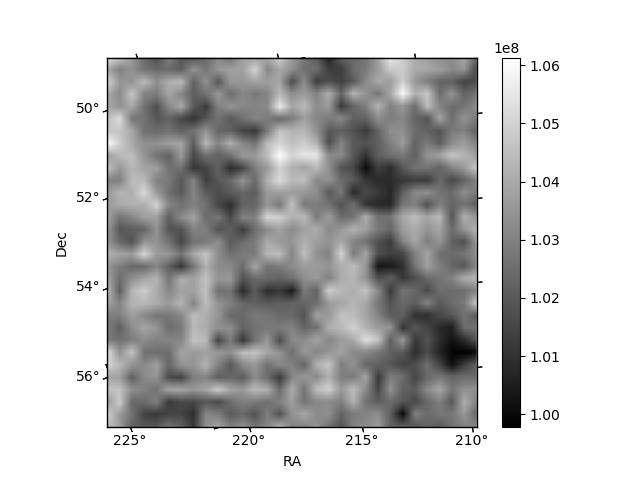
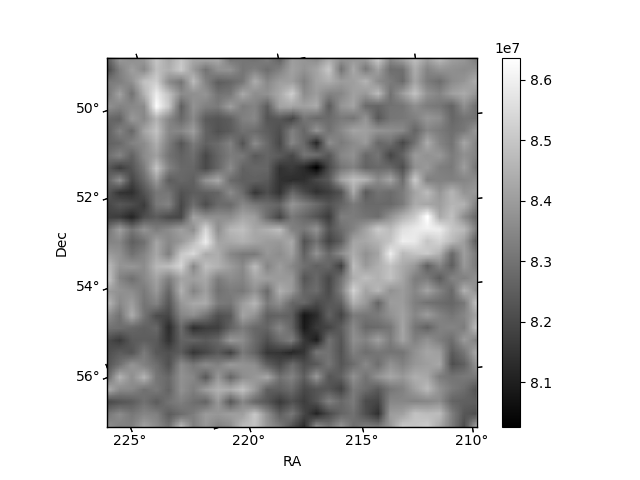
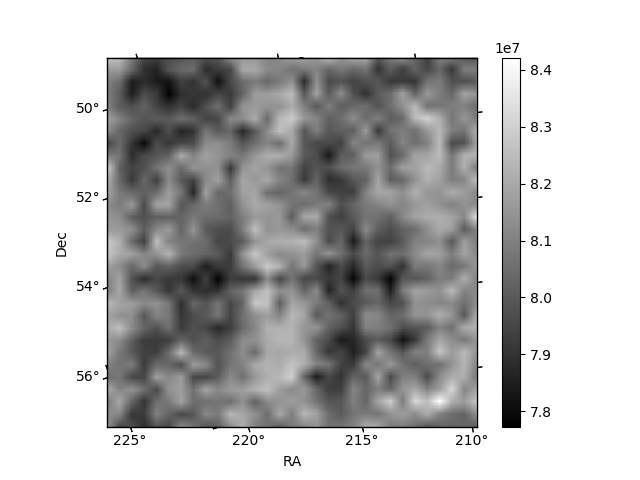
Histogram calculated using DETX and DETY for each event in the final _common_clean file
| Quadrant A | 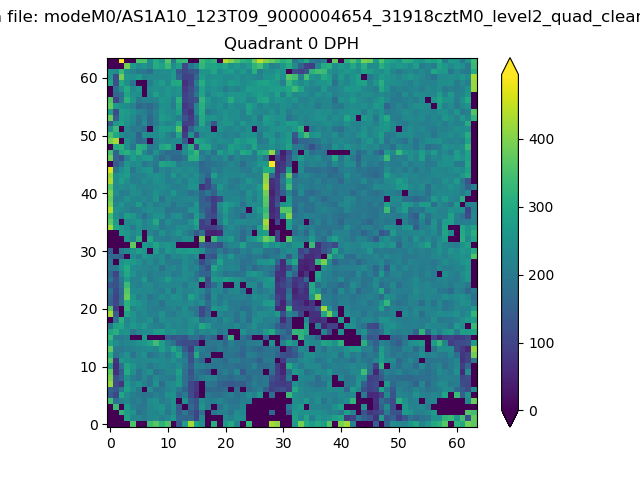 |
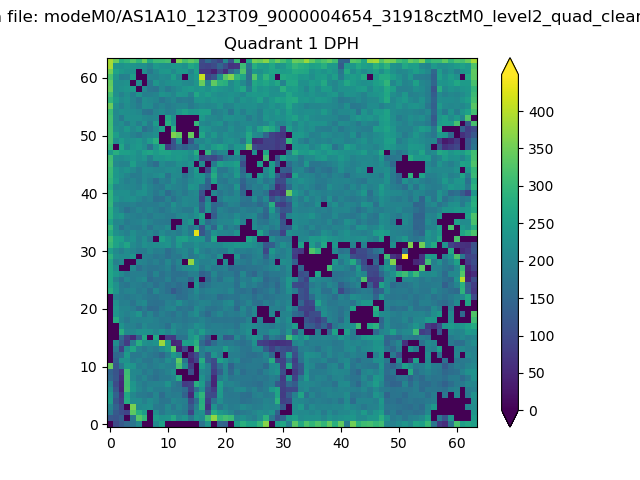 |
Quadrant B |
|---|---|---|---|
| Quadrant D | 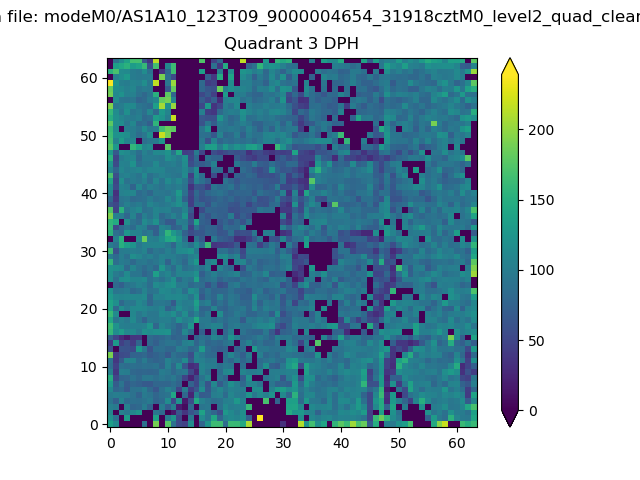 |
 |
Quadrant C |
| Plot type | Count rate plots | Images |
|---|---|---|
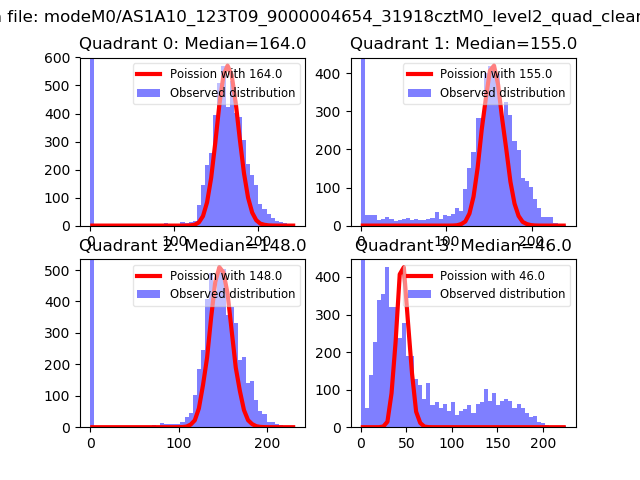
| Comparison with Poisson distribution Blue bars denote a histogram of data divided into 1 sec bins. Red curve is a Poisson curve with rate = median count rate of data. |
 |
 |
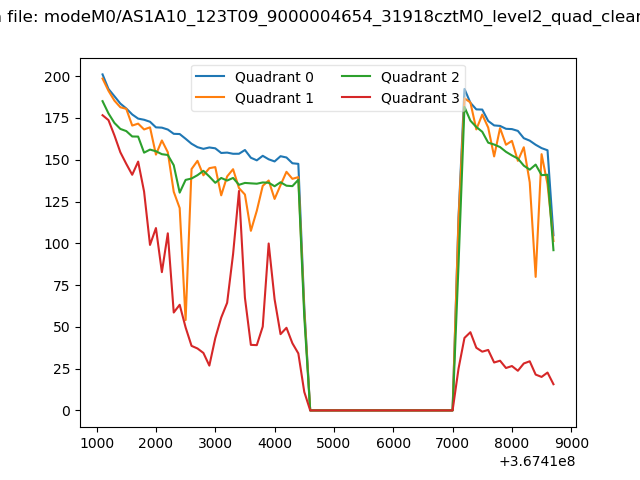
| Quadrant-wise count rates Data is divided into 100 sec bins |
 |
|
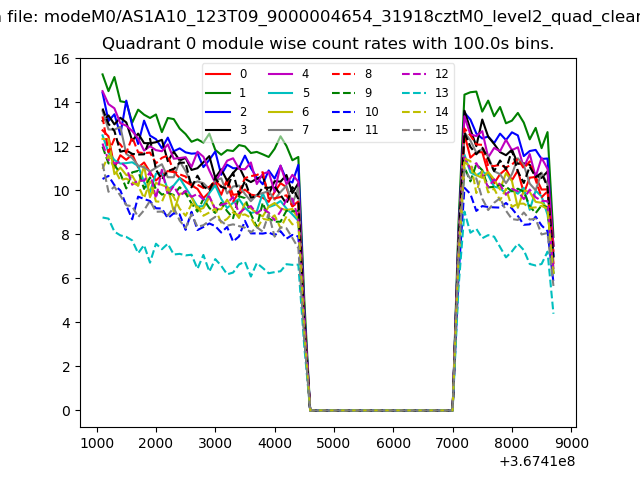
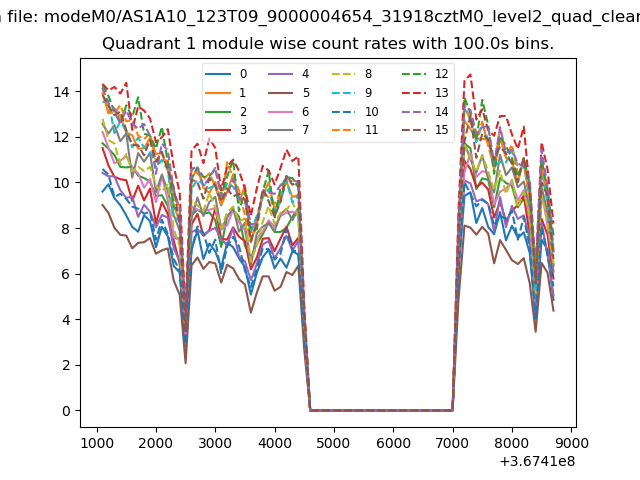
| Module-wise count rates for Quadrant A Data is divided into 100 sec bins |
 |
 |
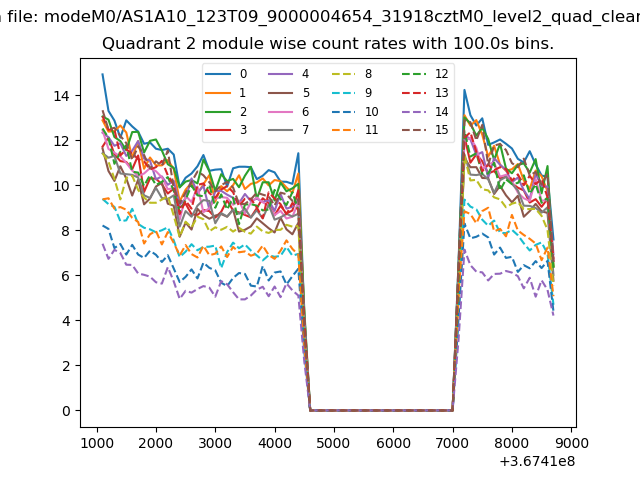
| Module-wise count rates for Quadrant B Data is divided into 100 sec bins |
 |
 |
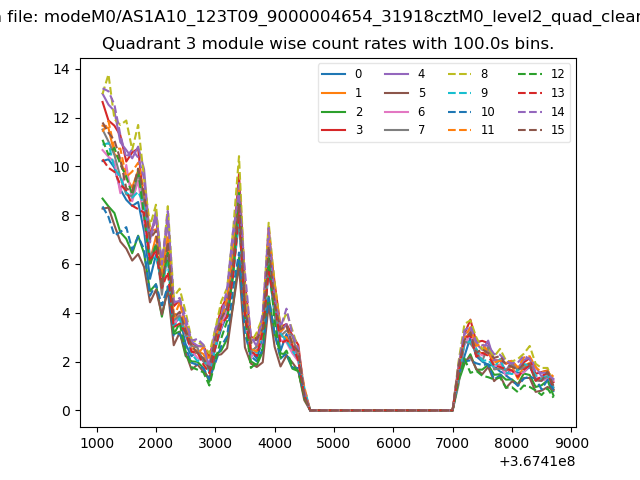
| Module-wise count rates for Quadrant C Data is divided into 100 sec bins |
 |
 |
| Module-wise count rates for Quadrant D Data is divided into 100 sec bins |
 |
 |
| Parameter | Plot |
|---|---|
| CZT HV Monitor | 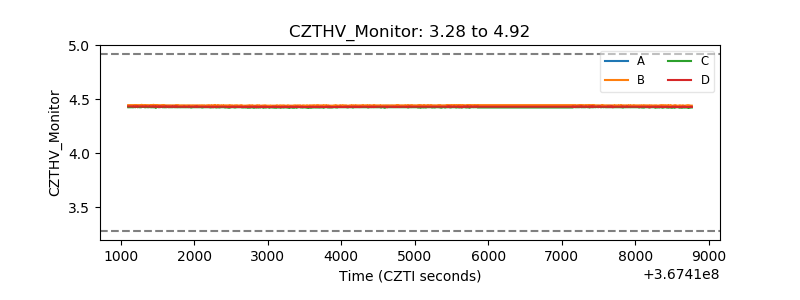 |
| D_VDD |  |
| Temperature 1 | 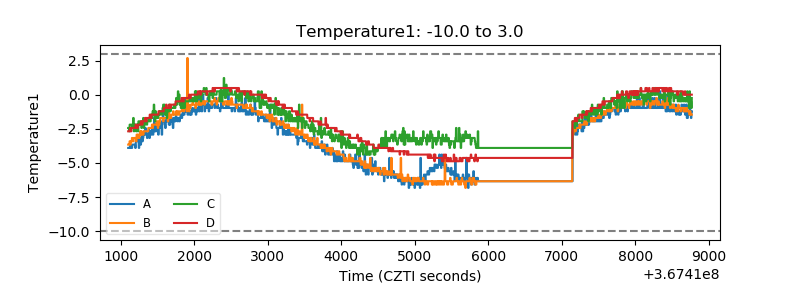 |
| Veto HV Monitor | 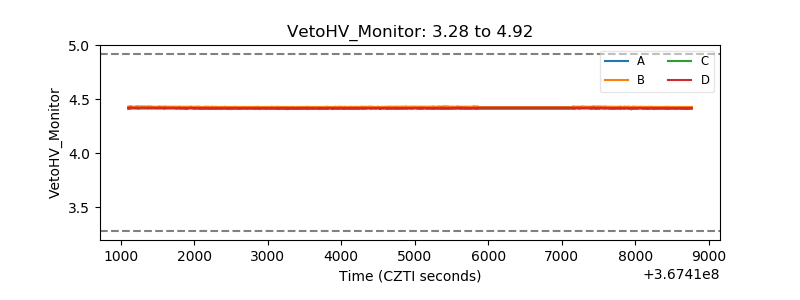 |
| Veto LLD | 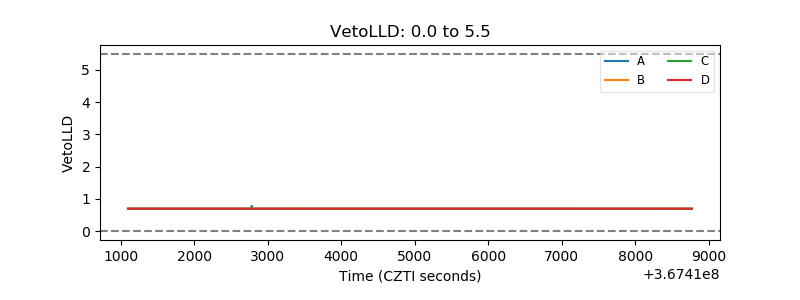 |
| Alpha Counter | 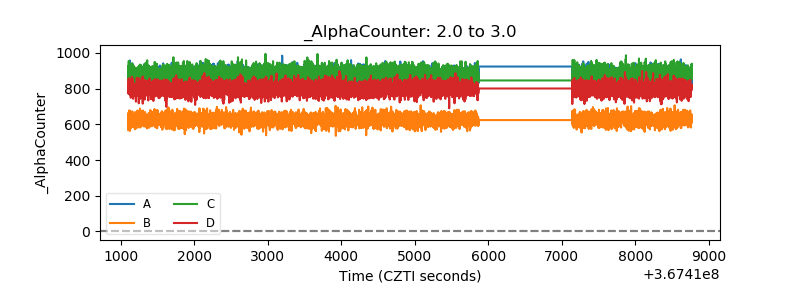 |
| _CPM_Rate | 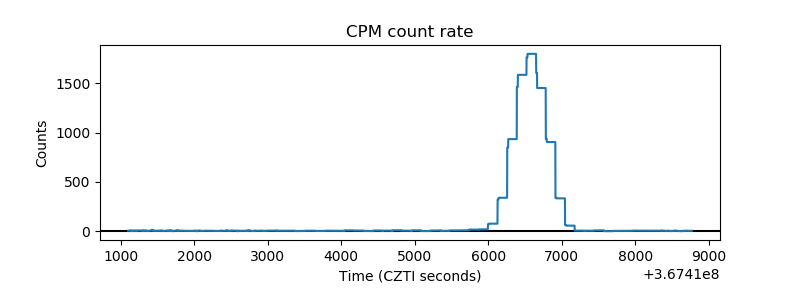 |
| CZT Counter | 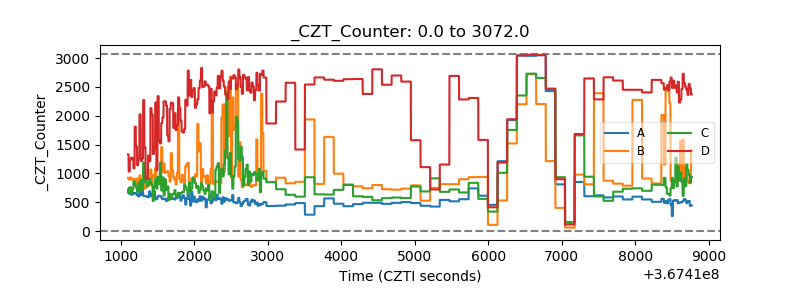 |
| +2.5 Volts monitor |  |
| +5 Volts monitor |  |
| _ROLL_ROT | 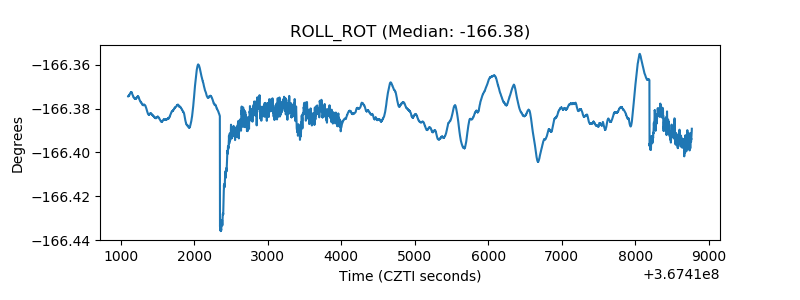 |
| _Roll_DEC | 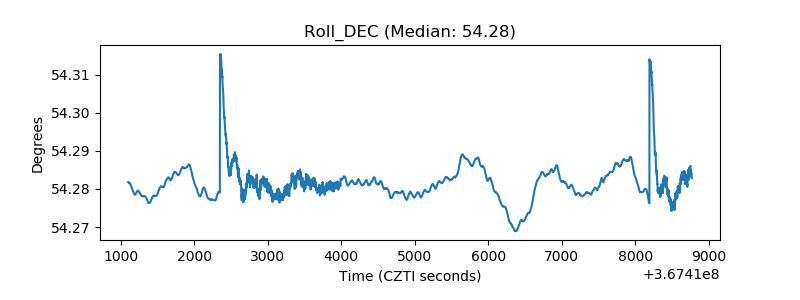 |
| _Roll_RA | 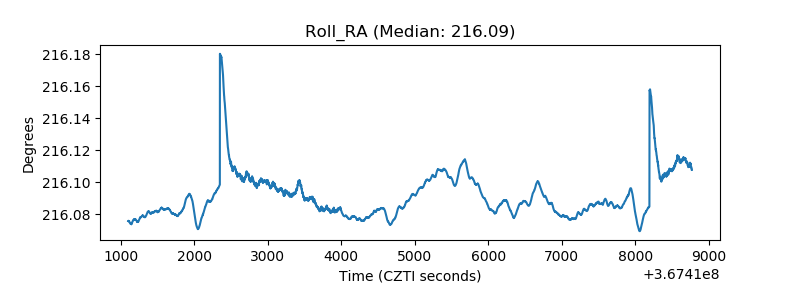 |
| Veto Counter | 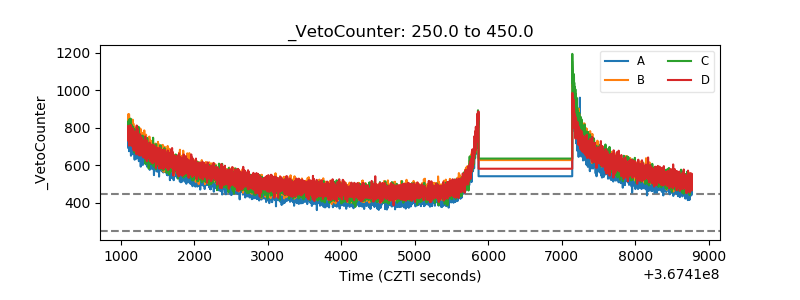 |