| Param | Original file | Final file |
|---|---|---|
| Filename | modeM0/AS1A10_123T09_9000004654_31919cztM0_level2.evt | modeM0/AS1A10_123T09_9000004654_31919cztM0_level2_quad_clean.evt |
| Size (bytes) | 889,093,440 | 86,016,960 |
| Size | 847.9 MB | 82.0 MB |
| Events in quadrant A | 3,142,579 | 676,124 |
| Events in quadrant B | 6,326,796 | 626,799 |
| Events in quadrant C | 5,662,408 | 603,933 |
| Events in quadrant D | 11,379,222 | 265,151 |
| Mode M0 | |||
|---|---|---|---|
| Quadrant | BADHDUFLAG | Total packets | Discarded packets |
| A | 0 | 12928 | 1 |
| B | 0 | 22866 | 1 |
| C | 0 | 21353 | 1 |
| D | 0 | 38108 | 1 |
| Mode SS | |||
|---|---|---|---|
| Quadrant | BADHDUFLAG | Total packets | Discarded packets |
| A | 0 | 126 | 0 |
| B | 0 | 126 | 0 |
| C | 0 | 126 | 0 |
| D | 0 | 126 | 0 |
| Mode M9 | |||
|---|---|---|---|
| Quadrant | BADHDUFLAG | Total packets | Discarded packets |
| A | 0 | 12 | 0 |
| B | 0 | 12 | 0 |
| C | 0 | 12 | 0 |
| D | 0 | 12 | 0 |
| Quadrant | Total seconds | Saturated seconds | Saturation percentage |
|---|---|---|---|
| A | 6168 | 81 | 1.313230% |
| B | 6169 | 731 | 11.849570% |
| C | 6169 | 359 | 5.819420% |
| D | 6169 | 3684 | 59.717945% |
Noise dominated data is calculated using 1-second bins in cleaned event files. If a bin has >2000 counts, and if more than 50% of those come from <1% of pixels, then it is considered to be noise-dominated and hence unusable.
| Quadrant | # 1 sec bins | Bins with >0 counts | Bins with >2000 counts | High rate bins dominated by noise | Noise dominated (total time) | Noise dominated (detector-on time) | Marked lightcurve |
|---|---|---|---|---|---|---|---|
| A | 7388 | 6169 | 0 | 0 | 0.00% | 0.00% |  |
| B | 7389 | 6170 | 565 | 565 | 7.65% | 9.16% |  |
| C | 7389 | 6170 | 66 | 66 | 0.89% | 1.07% |  |
| D | 7389 | 6170 | 3549 | 3549 | 48.03% | 57.52% |  |
Top three noisy pixels from each quadrant. If the there are fewer than three noisy pixels in the level2.evt file, extra rows are filled as -1
| Pixel properties | Quadrant properties | ||||||
|---|---|---|---|---|---|---|---|
| Quadrant | DetID | PixID | Counts | Sigma | Mean | Median | Sigma |
| A | 13 | 6 | 18682 | 111.82 | 808 | 792 | 160.0 |
| A | 13 | 254 | 12570 | 73.62 | 808 | 792 | 160.0 |
| A | 3 | 137 | 7181 | 39.93 | 808 | 792 | 160.0 |
| B | 6 | 159 | 1732405 | 12285.09 | 754 | 737 | 141.0 |
| B | 10 | 245 | 678825 | 4810.6 | 754 | 737 | 141.0 |
| B | 5 | 172 | 548808 | 3888.22 | 754 | 737 | 141.0 |
| C | 3 | 233 | 2112620 | 12211.52 | 749 | 754 | 172.9 |
| C | 0 | 10 | 479514 | 2768.35 | 749 | 754 | 172.9 |
| C | 14 | 238 | 121855 | 700.25 | 749 | 754 | 172.9 |
| D | 12 | 33 | 8284305 | 70634.07 | 498 | 485 | 117.3 |
| D | 8 | 195 | 842512 | 7179.75 | 498 | 485 | 117.3 |
| D | 13 | 249 | 145455 | 1236.12 | 498 | 485 | 117.3 |
Histogram calculated using DETX and DETY for each event in the final _common_clean file
| Quadrant A |  |
 |
Quadrant B |
|---|---|---|---|
| Quadrant D |  |
 |
Quadrant C |
| Plot type | Count rate plots | Images |
|---|---|---|
| Comparison with Poisson distribution Blue bars denote a histogram of data divided into 1 sec bins. Red curve is a Poisson curve with rate = median count rate of data. |
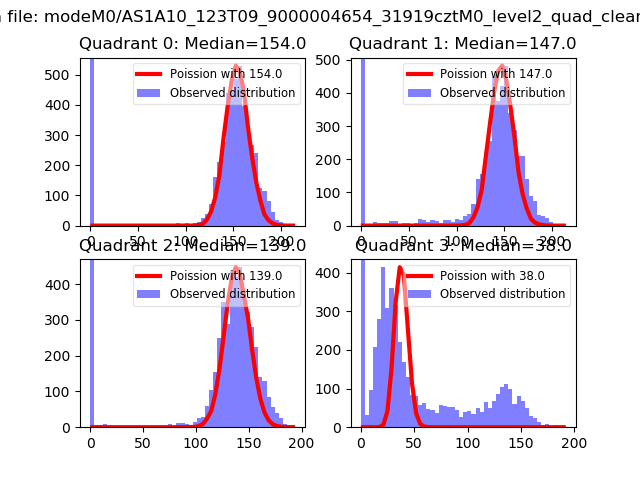 |
 |
| Quadrant-wise count rates Data is divided into 100 sec bins |
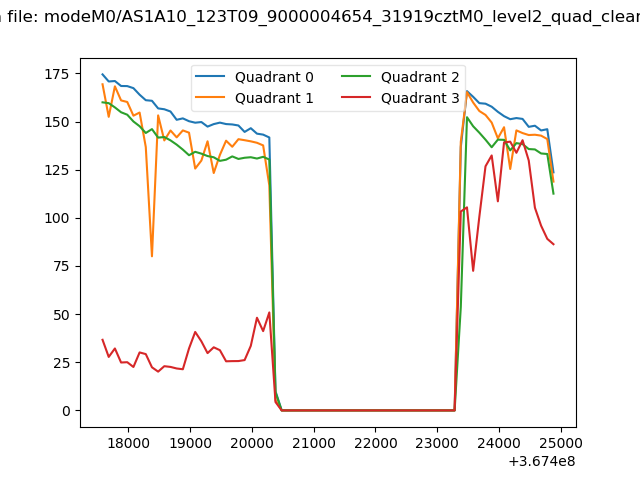 |
|
| Module-wise count rates for Quadrant A Data is divided into 100 sec bins |
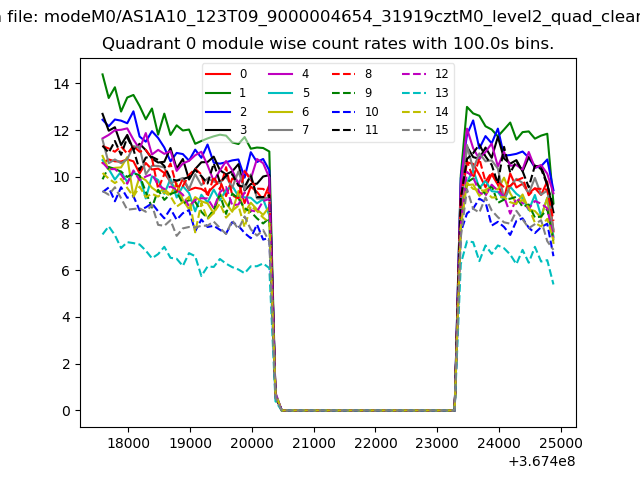 |
 |
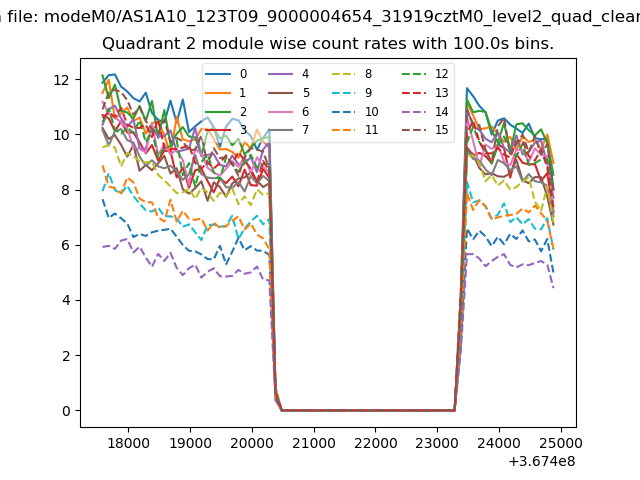
| Module-wise count rates for Quadrant B Data is divided into 100 sec bins |
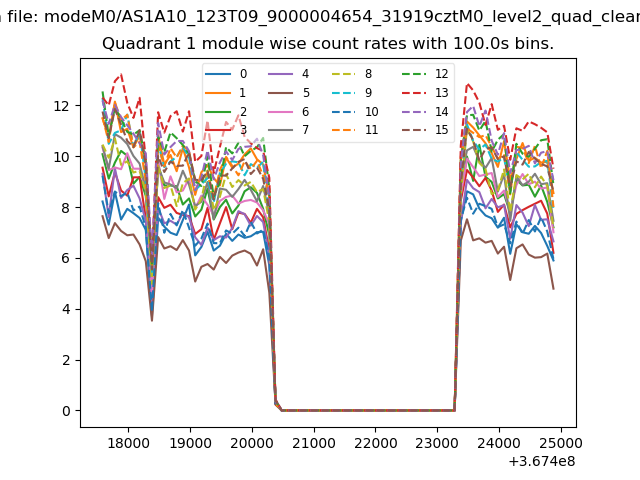 |
 |
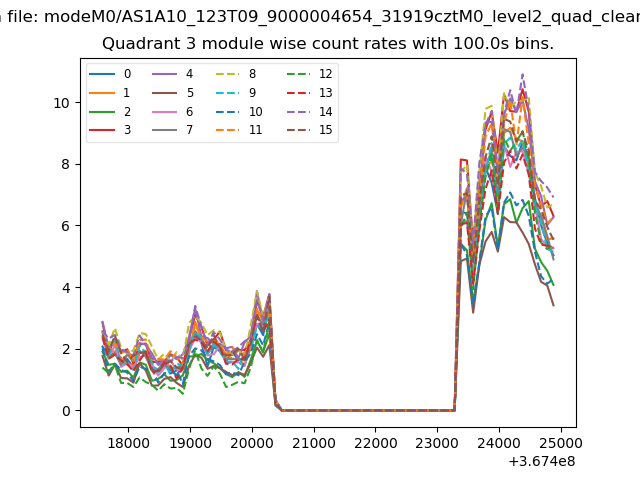
| Module-wise count rates for Quadrant C Data is divided into 100 sec bins |
 |
 |
| Module-wise count rates for Quadrant D Data is divided into 100 sec bins |
 |
 |
| Parameter | Plot |
|---|---|
| CZT HV Monitor | 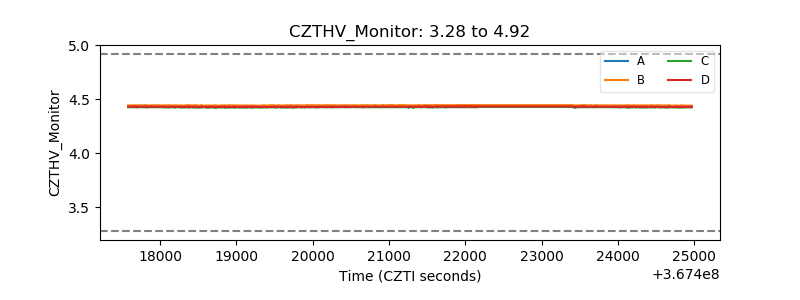 |
| D_VDD |  |
| Temperature 1 |  |
| Veto HV Monitor |  |
| Veto LLD |  |
| Alpha Counter | 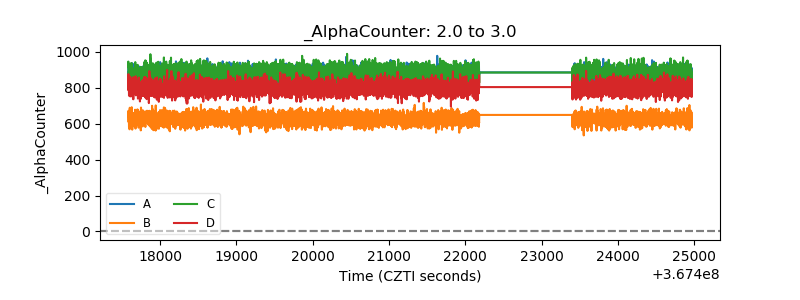 |
| _CPM_Rate | 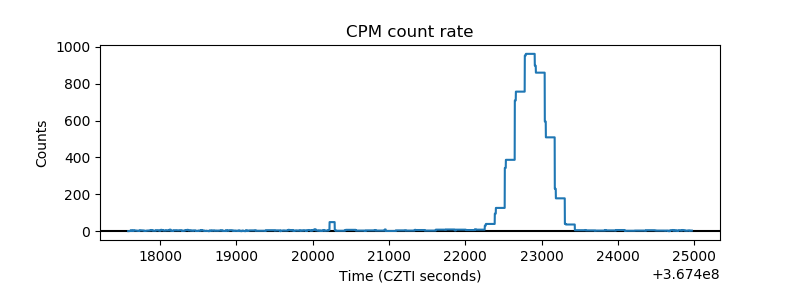 |
| CZT Counter |  |
| +2.5 Volts monitor |  |
| +5 Volts monitor |  |
| _ROLL_ROT | 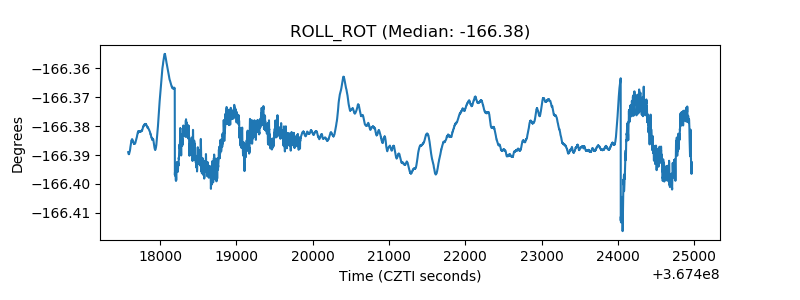 |
| _Roll_DEC | 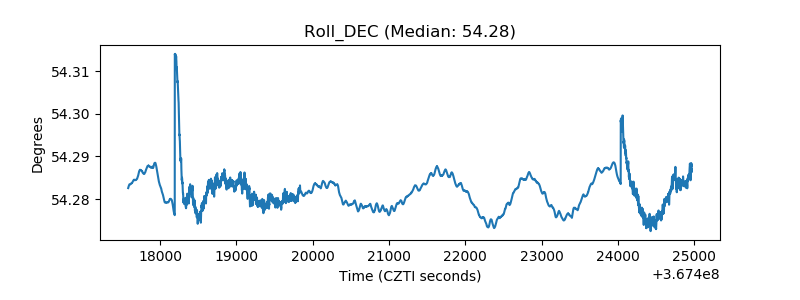 |
| _Roll_RA |  |
| Veto Counter | 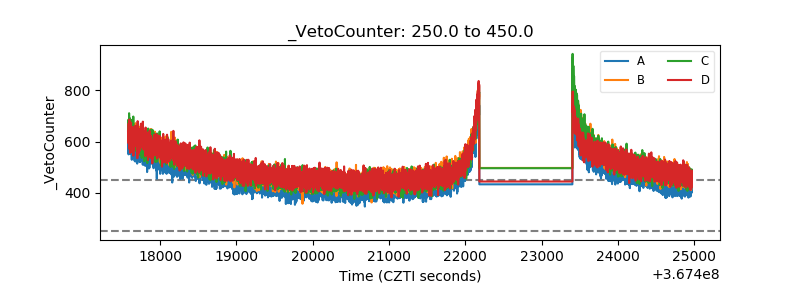 |