| Param | Original file | Final file |
|---|---|---|
| Filename | modeM0/AS1A10_123T09_9000004654_31920cztM0_level2.evt | modeM0/AS1A10_123T09_9000004654_31920cztM0_level2_quad_clean.evt |
| Size (bytes) | 687,798,720 | 82,042,560 |
| Size | 655.9 MB | 78.2 MB |
| Events in quadrant A | 2,875,457 | 565,164 |
| Events in quadrant B | 5,221,835 | 536,082 |
| Events in quadrant C | 5,271,877 | 500,701 |
| Events in quadrant D | 7,062,835 | 469,199 |
| Mode M0 | |||
|---|---|---|---|
| Quadrant | BADHDUFLAG | Total packets | Discarded packets |
| A | 0 | 12224 | 1 |
| B | 0 | 19848 | 1 |
| C | 0 | 19696 | 1 |
| D | 0 | 24854 | 1 |
| Mode SS | |||
|---|---|---|---|
| Quadrant | BADHDUFLAG | Total packets | Discarded packets |
| A | 0 | 122 | 0 |
| B | 0 | 122 | 0 |
| C | 0 | 122 | 0 |
| D | 0 | 122 | 0 |
| Mode M9 | |||
|---|---|---|---|
| Quadrant | BADHDUFLAG | Total packets | Discarded packets |
| A | 0 | 9 | 0 |
| B | 0 | 9 | 0 |
| C | 0 | 9 | 0 |
| D | 0 | 9 | 0 |
| Quadrant | Total seconds | Saturated seconds | Saturation percentage |
|---|---|---|---|
| A | 5896 | 36 | 0.610583% |
| B | 5897 | 307 | 5.206037% |
| C | 5897 | 557 | 9.445481% |
| D | 5897 | 1046 | 17.737833% |
Noise dominated data is calculated using 1-second bins in cleaned event files. If a bin has >2000 counts, and if more than 50% of those come from <1% of pixels, then it is considered to be noise-dominated and hence unusable.
| Quadrant | # 1 sec bins | Bins with >0 counts | Bins with >2000 counts | High rate bins dominated by noise | Noise dominated (total time) | Noise dominated (detector-on time) | Marked lightcurve |
|---|---|---|---|---|---|---|---|
| A | 6871 | 5897 | 0 | 0 | 0.00% | 0.00% | 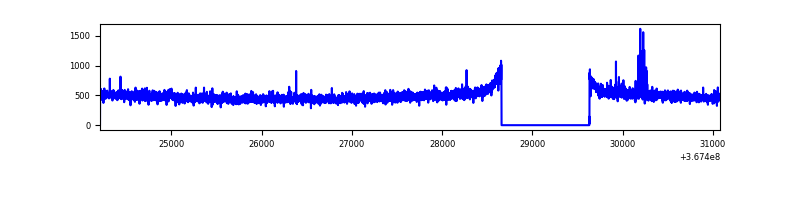 |
| B | 6872 | 5898 | 143 | 143 | 2.08% | 2.42% | 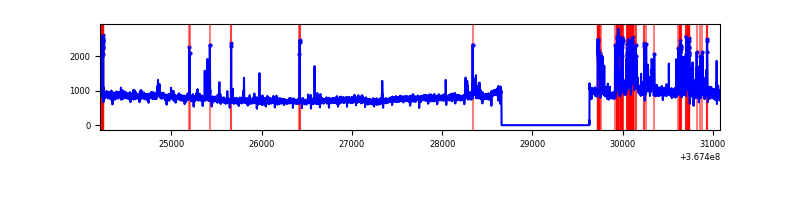 |
| C | 6872 | 5898 | 200 | 200 | 2.91% | 3.39% | 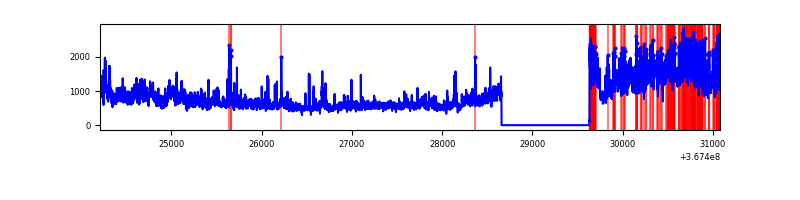 |
| D | 6872 | 5898 | 1053 | 1053 | 15.32% | 17.85% | 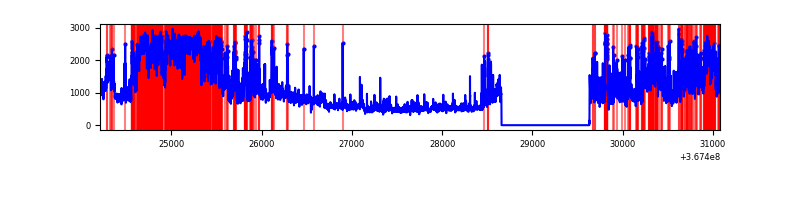 |
Top three noisy pixels from each quadrant. If the there are fewer than three noisy pixels in the level2.evt file, extra rows are filled as -1
| Pixel properties | Quadrant properties | ||||||
|---|---|---|---|---|---|---|---|
| Quadrant | DetID | PixID | Counts | Sigma | Mean | Median | Sigma |
| A | 13 | 6 | 23926 | 157.5 | 733 | 718 | 147.3 |
| A | 12 | 96 | 18874 | 123.22 | 733 | 718 | 147.3 |
| A | 13 | 254 | 11751 | 74.88 | 733 | 718 | 147.3 |
| B | 6 | 159 | 1771751 | 13018.39 | 712 | 694 | 136.0 |
| B | 5 | 172 | 372459 | 2732.71 | 712 | 694 | 136.0 |
| B | 10 | 245 | 88685 | 646.79 | 712 | 694 | 136.0 |
| C | 3 | 233 | 1805761 | 11342.95 | 683 | 686 | 159.1 |
| C | 0 | 10 | 630772 | 3959.41 | 683 | 686 | 159.1 |
| C | 14 | 238 | 108192 | 675.56 | 683 | 686 | 159.1 |
| D | 12 | 33 | 2413534 | 14866.52 | 679 | 660 | 162.3 |
| D | 8 | 195 | 1577832 | 9717.48 | 679 | 660 | 162.3 |
| D | 7 | 38 | 109761 | 672.2 | 679 | 660 | 162.3 |
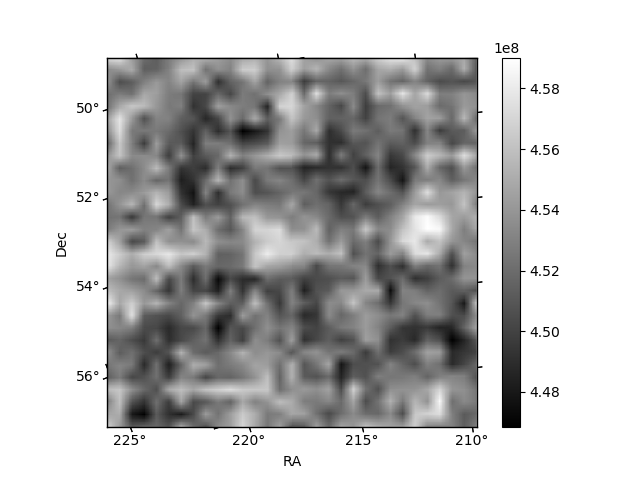
Histogram calculated using DETX and DETY for each event in the final _common_clean file
| Quadrant A | 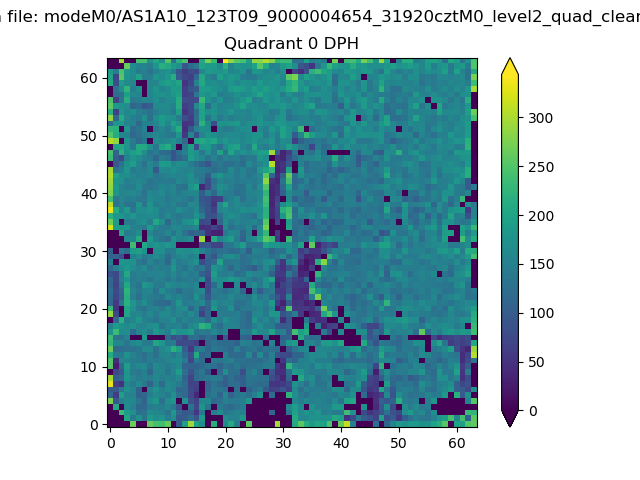 |
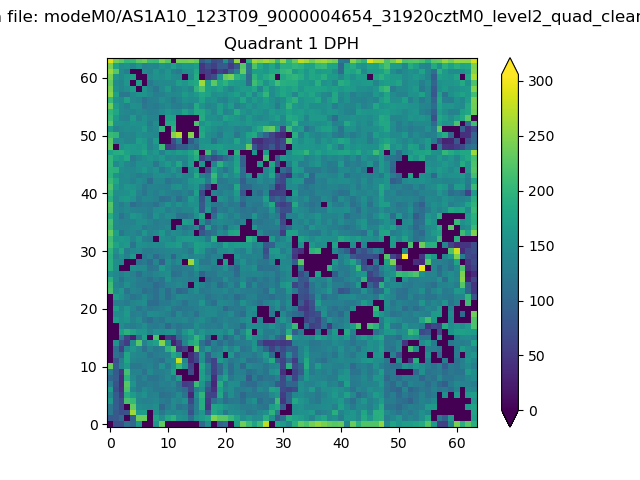 |
Quadrant B |
|---|---|---|---|
| Quadrant D | 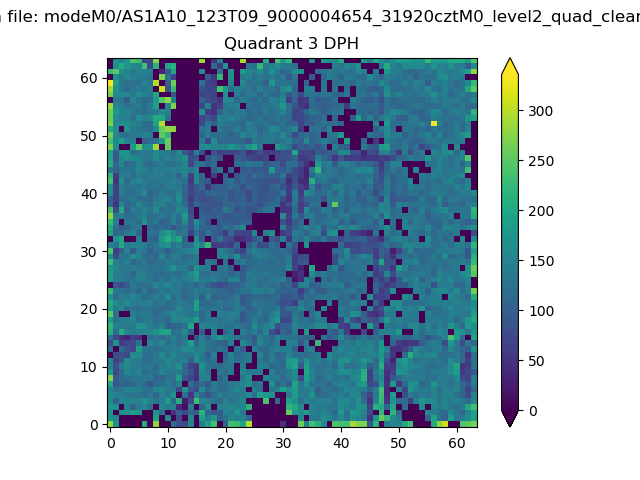 |
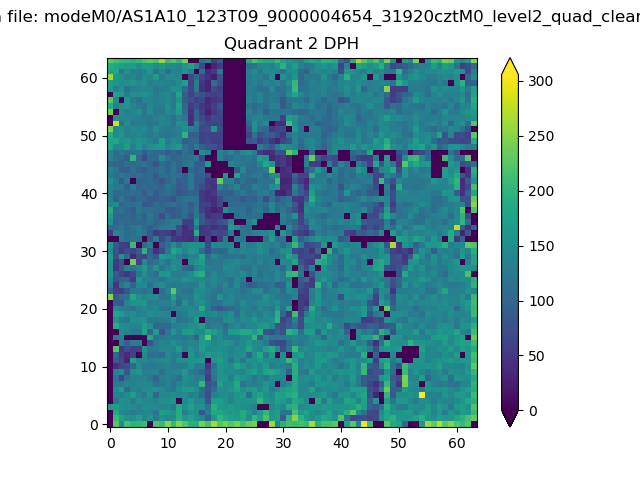 |
Quadrant C |
| Plot type | Count rate plots | Images |
|---|---|---|
| Comparison with Poisson distribution Blue bars denote a histogram of data divided into 1 sec bins. Red curve is a Poisson curve with rate = median count rate of data. |
 |
 |
| Quadrant-wise count rates Data is divided into 100 sec bins |
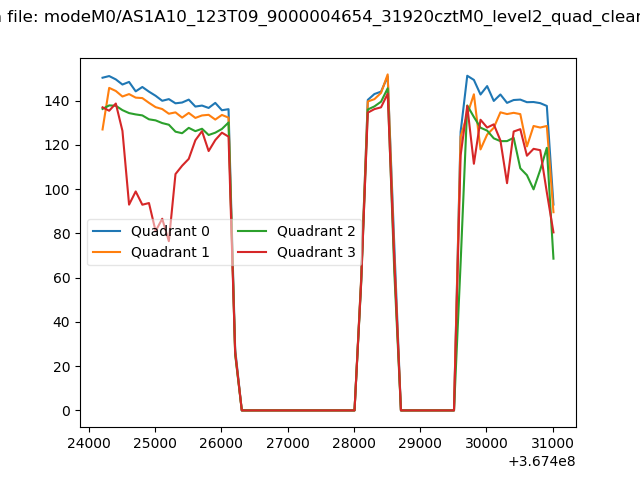 |
|
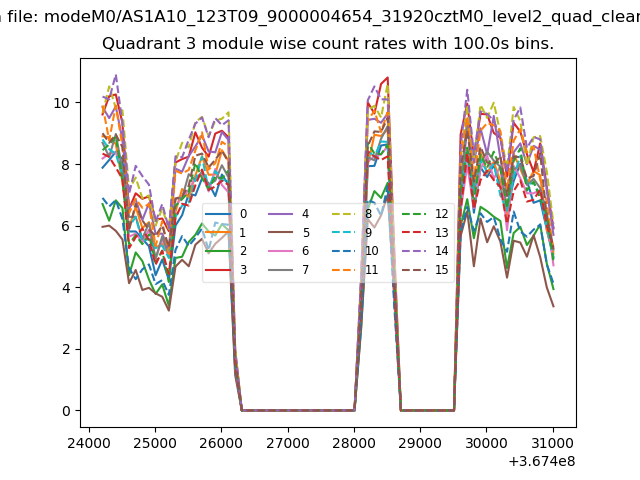
| Module-wise count rates for Quadrant A Data is divided into 100 sec bins |
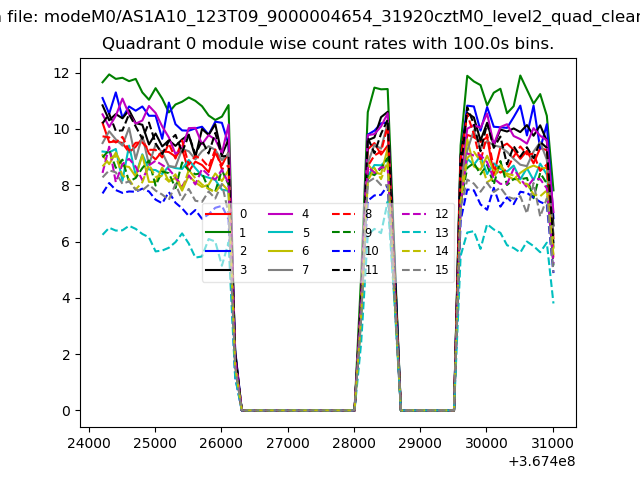 |
 |
| Module-wise count rates for Quadrant B Data is divided into 100 sec bins |
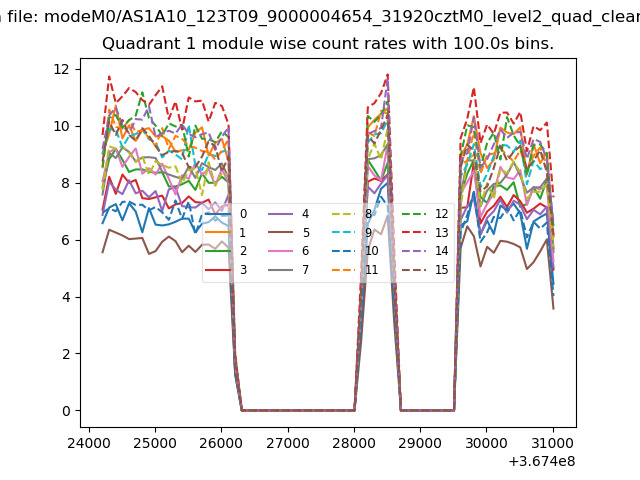 |
 |
| Module-wise count rates for Quadrant C Data is divided into 100 sec bins |
 |
 |
| Module-wise count rates for Quadrant D Data is divided into 100 sec bins |
 |
 |
| Parameter | Plot |
|---|---|
| CZT HV Monitor | 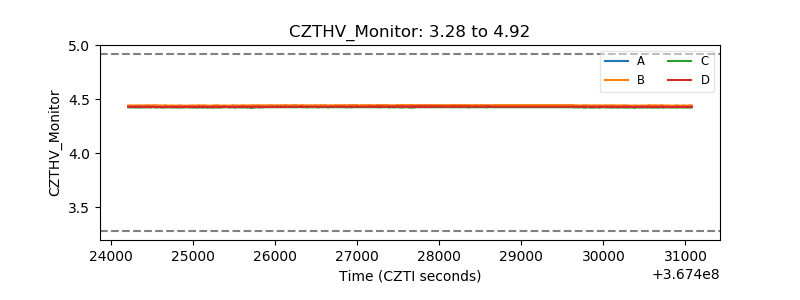 |
| D_VDD | 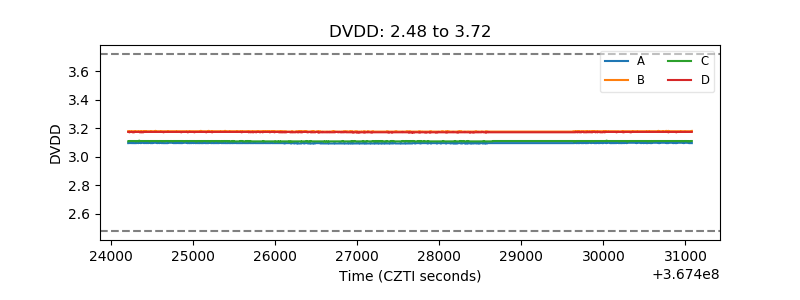 |
| Temperature 1 |  |
| Veto HV Monitor | 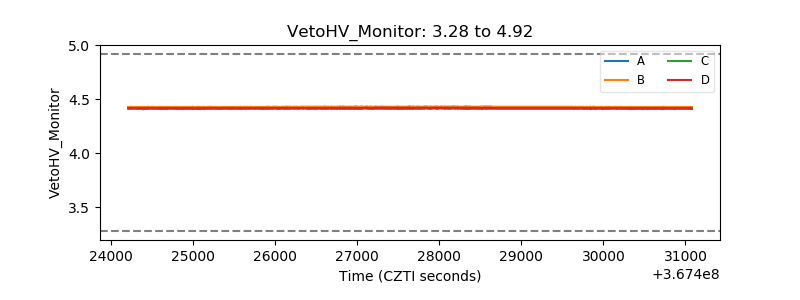 |
| Veto LLD | 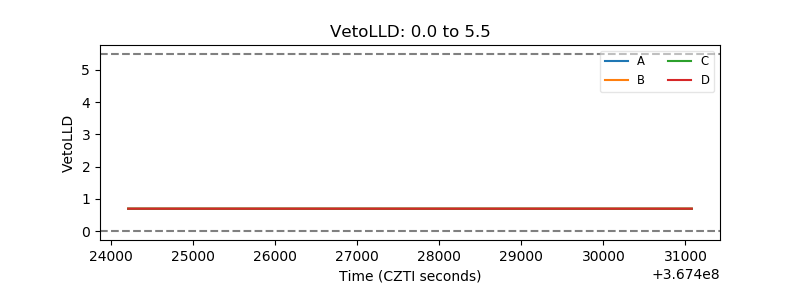 |
| Alpha Counter | 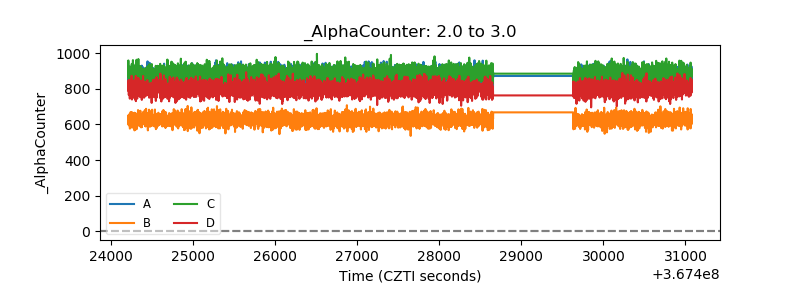 |
| _CPM_Rate | 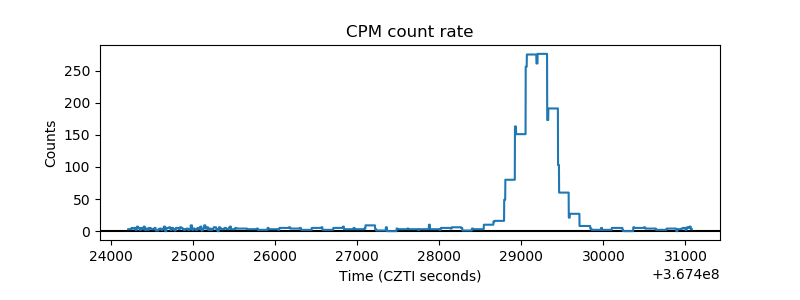 |
| CZT Counter | 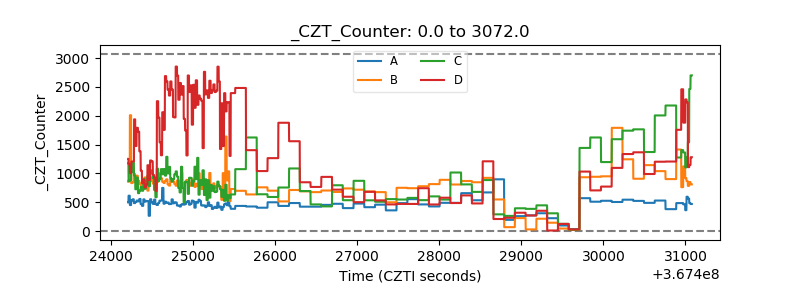 |
| +2.5 Volts monitor | 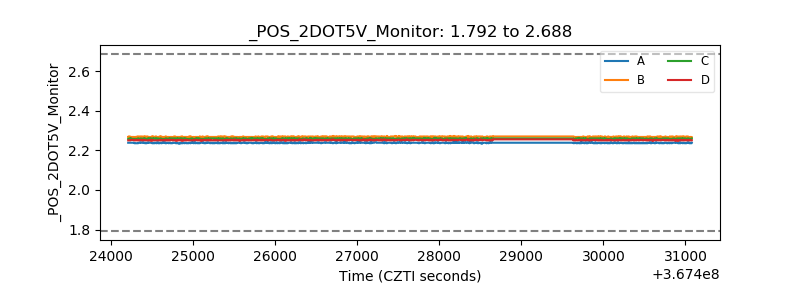 |
| +5 Volts monitor |  |
| _ROLL_ROT | 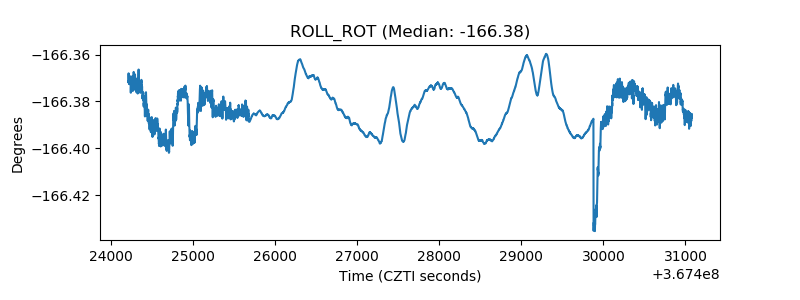 |
| _Roll_DEC | 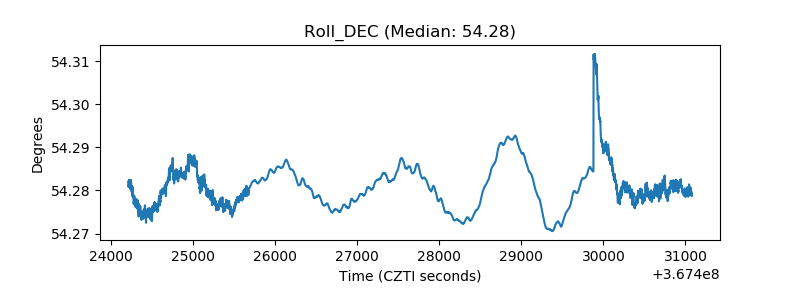 |
| _Roll_RA | 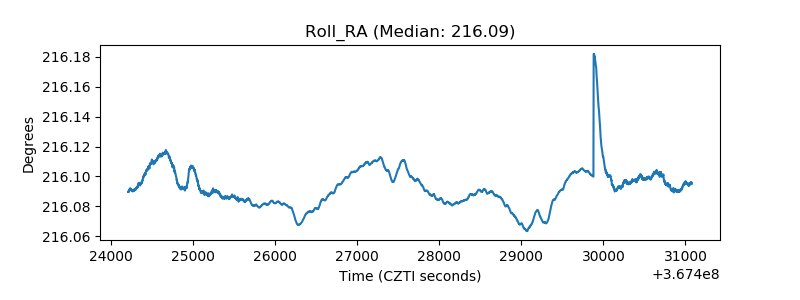 |
| Veto Counter |  |