| Param | Original file | Final file |
|---|---|---|
| Filename | modeM0/AS1A10_123T09_9000004654_31921cztM0_level2.evt | modeM0/AS1A10_123T09_9000004654_31921cztM0_level2_quad_clean.evt |
| Size (bytes) | 859,452,480 | 99,221,760 |
| Size | 819.6 MB | 94.6 MB |
| Events in quadrant A | 3,328,062 | 685,405 |
| Events in quadrant B | 6,411,902 | 650,989 |
| Events in quadrant C | 7,863,298 | 591,717 |
| Events in quadrant D | 7,961,006 | 594,485 |
| Mode M0 | |||
|---|---|---|---|
| Quadrant | BADHDUFLAG | Total packets | Discarded packets |
| A | 0 | 14324 | 1 |
| B | 0 | 23957 | 1 |
| C | 0 | 28331 | 1 |
| D | 0 | 28635 | 3 |
| Mode SS | |||
|---|---|---|---|
| Quadrant | BADHDUFLAG | Total packets | Discarded packets |
| A | 0 | 142 | 0 |
| B | 0 | 142 | 0 |
| C | 0 | 142 | 0 |
| D | 0 | 142 | 0 |
| Mode M9 | |||
|---|---|---|---|
| Quadrant | BADHDUFLAG | Total packets | Discarded packets |
| A | 0 | 5 | 0 |
| B | 0 | 5 | 0 |
| C | 0 | 5 | 0 |
| D | 0 | 5 | 0 |
| Quadrant | Total seconds | Saturated seconds | Saturation percentage |
|---|---|---|---|
| A | 6904 | 42 | 0.608343% |
| B | 6904 | 419 | 6.068946% |
| C | 6904 | 1088 | 15.758980% |
| D | 6903 | 757 | 10.966247% |
Noise dominated data is calculated using 1-second bins in cleaned event files. If a bin has >2000 counts, and if more than 50% of those come from <1% of pixels, then it is considered to be noise-dominated and hence unusable.
| Quadrant | # 1 sec bins | Bins with >0 counts | Bins with >2000 counts | High rate bins dominated by noise | Noise dominated (total time) | Noise dominated (detector-on time) | Marked lightcurve |
|---|---|---|---|---|---|---|---|
| A | 7489 | 6905 | 0 | 0 | 0.00% | 0.00% | 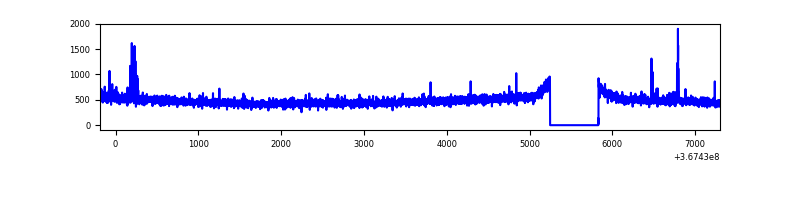 |
| B | 7489 | 6905 | 168 | 168 | 2.24% | 2.43% | 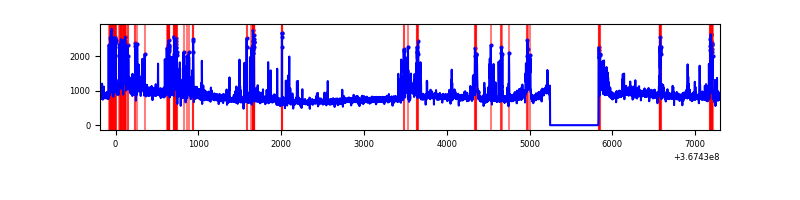 |
| C | 7489 | 6905 | 467 | 467 | 6.24% | 6.76% | 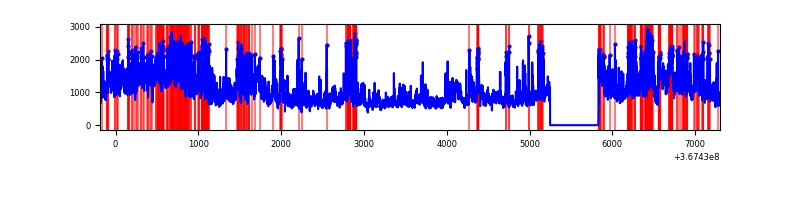 |
| D | 7488 | 6904 | 685 | 685 | 9.15% | 9.92% | 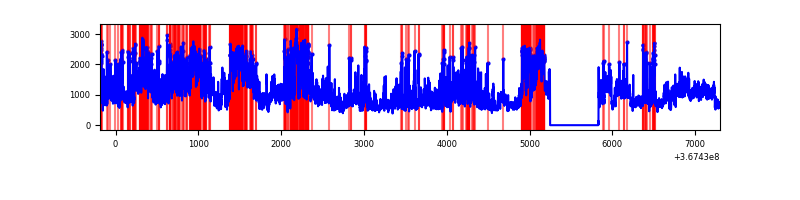 |
Top three noisy pixels from each quadrant. If the there are fewer than three noisy pixels in the level2.evt file, extra rows are filled as -1
| Pixel properties | Quadrant properties | ||||||
|---|---|---|---|---|---|---|---|
| Quadrant | DetID | PixID | Counts | Sigma | Mean | Median | Sigma |
| A | 12 | 96 | 33033 | 188.7 | 849 | 832 | 170.6 |
| A | 13 | 6 | 20524 | 115.4 | 849 | 832 | 170.6 |
| A | 13 | 254 | 13677 | 75.27 | 849 | 832 | 170.6 |
| B | 6 | 159 | 2137189 | 13729.4 | 822 | 801 | 155.6 |
| B | 4 | 80 | 446844 | 2866.48 | 822 | 801 | 155.6 |
| B | 5 | 172 | 334053 | 2141.63 | 822 | 801 | 155.6 |
| C | 3 | 233 | 3230888 | 17896.35 | 773 | 776 | 180.5 |
| C | 0 | 10 | 1394032 | 7719.3 | 773 | 776 | 180.5 |
| C | 14 | 238 | 123504 | 679.97 | 773 | 776 | 180.5 |
| D | 8 | 195 | 2316857 | 12153.96 | 792 | 770 | 190.6 |
| D | 12 | 33 | 1594505 | 8363.33 | 792 | 770 | 190.6 |
| D | 2 | 250 | 440104 | 2305.46 | 792 | 770 | 190.6 |
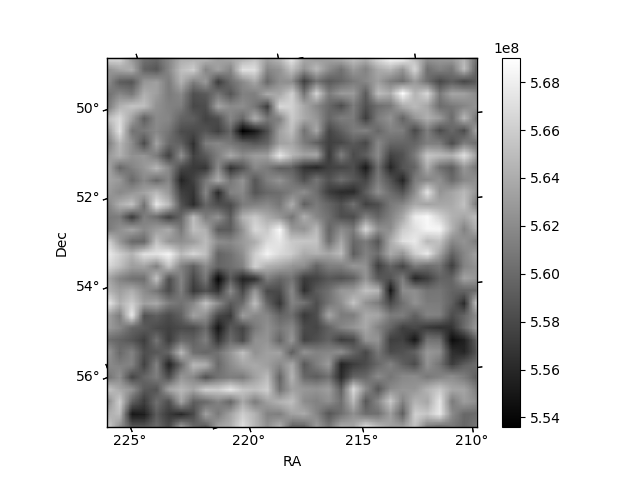
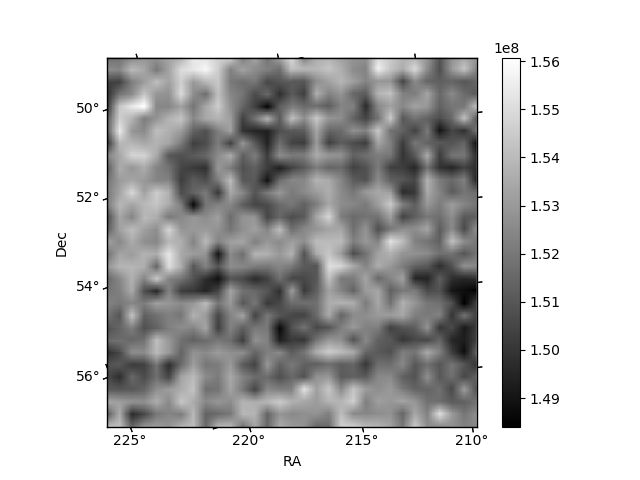
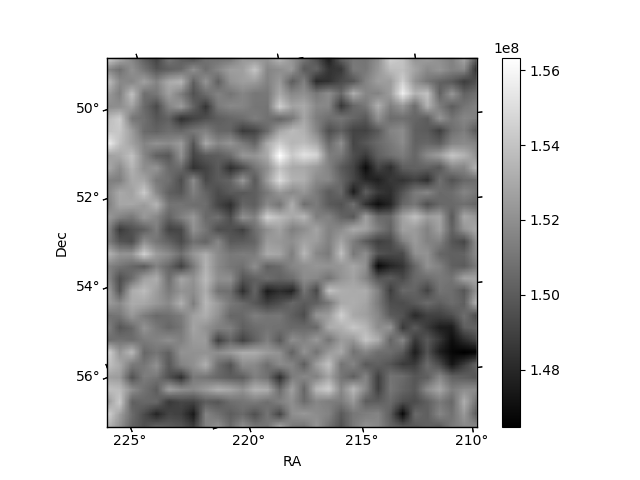
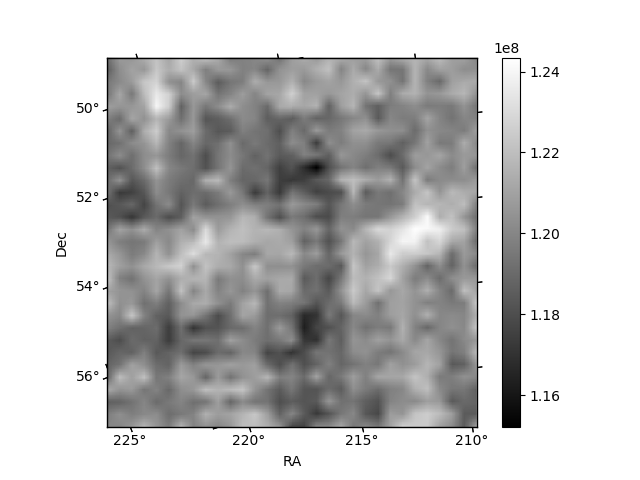
Histogram calculated using DETX and DETY for each event in the final _common_clean file
| Quadrant A | 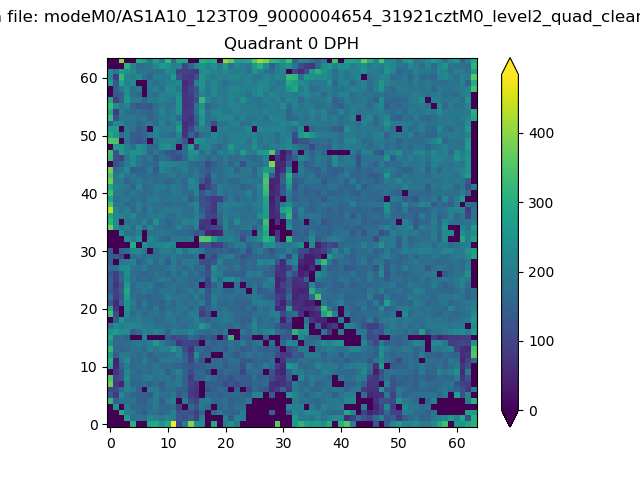 |
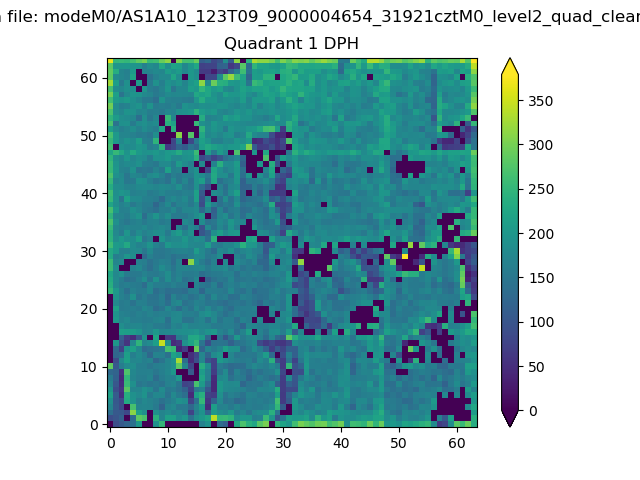 |
Quadrant B |
|---|---|---|---|
| Quadrant D | 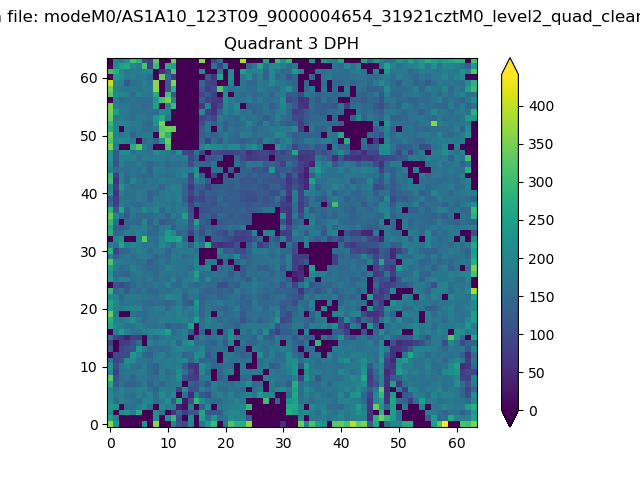 |
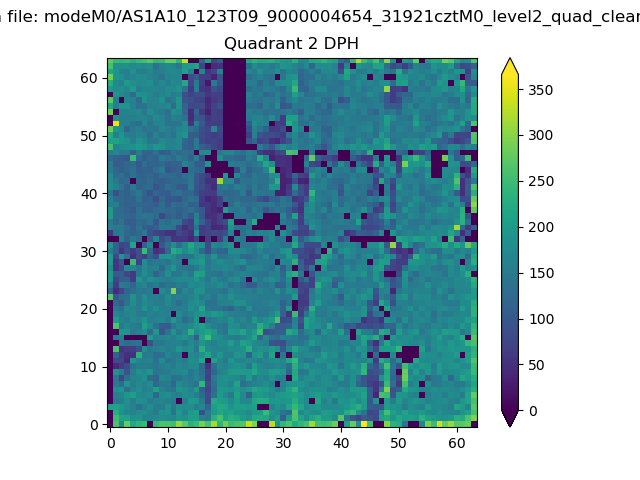 |
Quadrant C |
| Plot type | Count rate plots | Images |
|---|---|---|
| Comparison with Poisson distribution Blue bars denote a histogram of data divided into 1 sec bins. Red curve is a Poisson curve with rate = median count rate of data. |
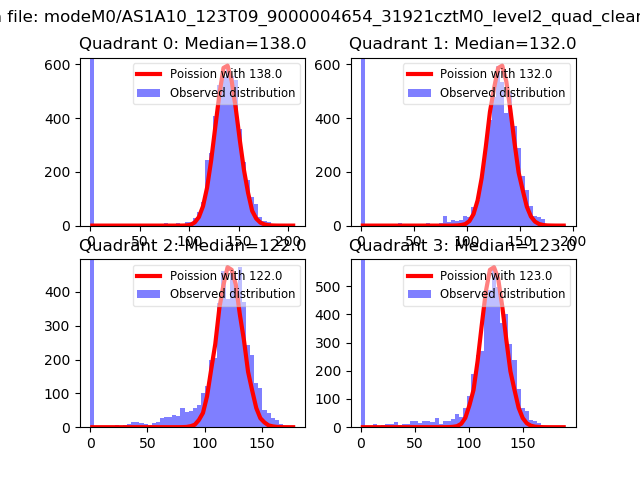 |
 |
| Quadrant-wise count rates Data is divided into 100 sec bins |
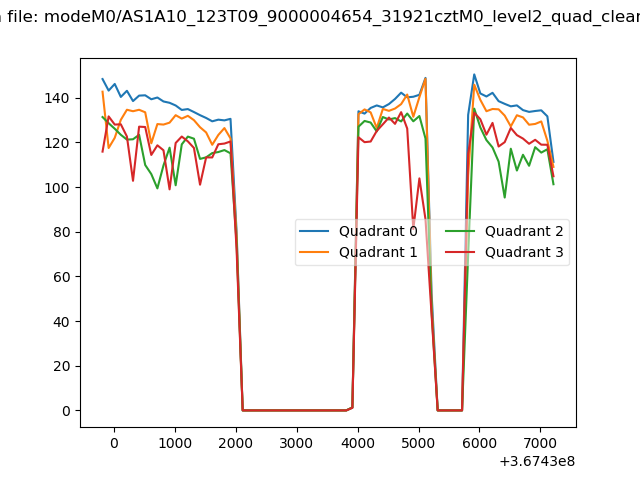 |
|
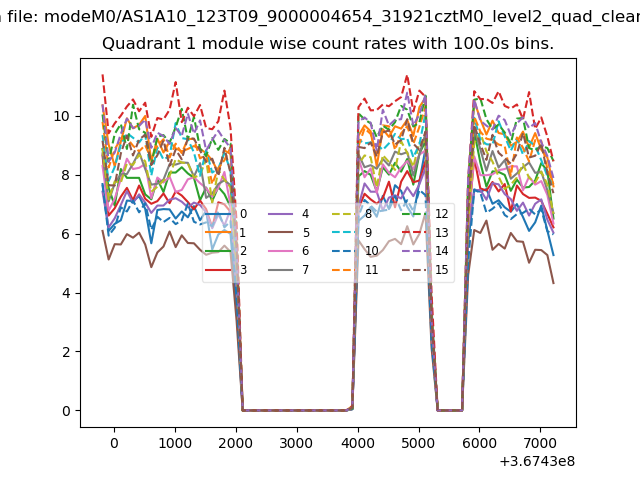
| Module-wise count rates for Quadrant A Data is divided into 100 sec bins |
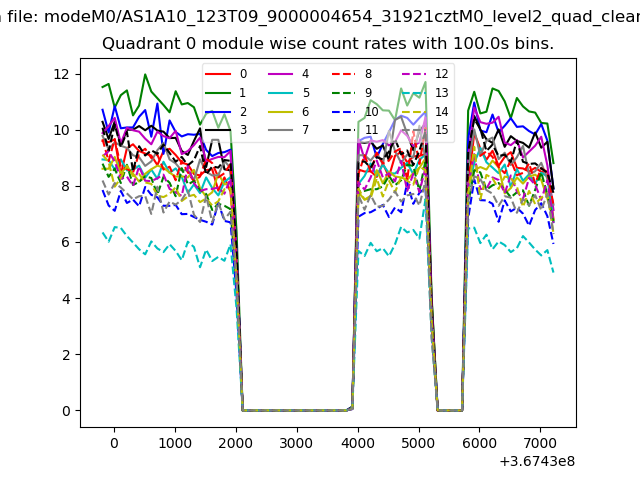 |
 |
| Module-wise count rates for Quadrant B Data is divided into 100 sec bins |
 |
 |
| Module-wise count rates for Quadrant C Data is divided into 100 sec bins |
 |
 |
| Module-wise count rates for Quadrant D Data is divided into 100 sec bins |
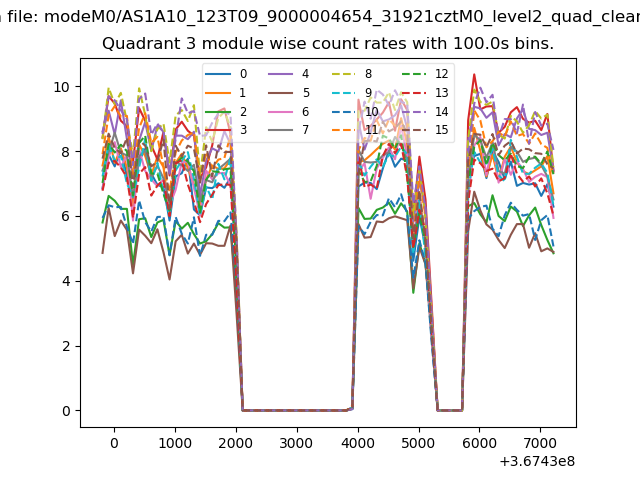 |
 |
| Parameter | Plot |
|---|---|
| CZT HV Monitor |  |
| D_VDD | 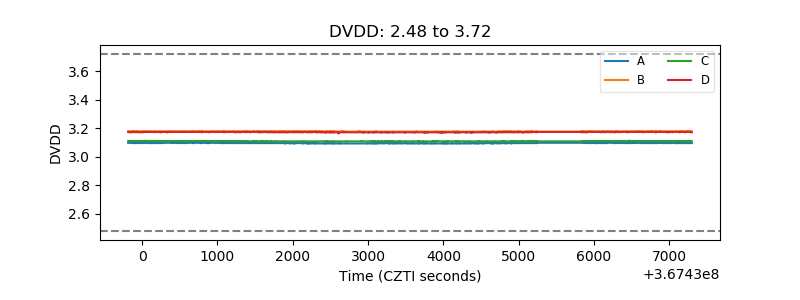 |
| Temperature 1 |  |
| Veto HV Monitor | 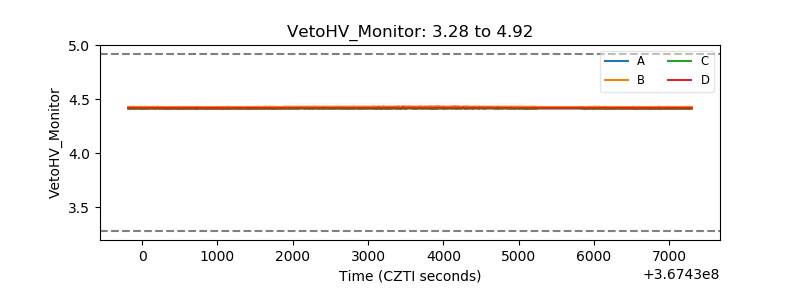 |
| Veto LLD | 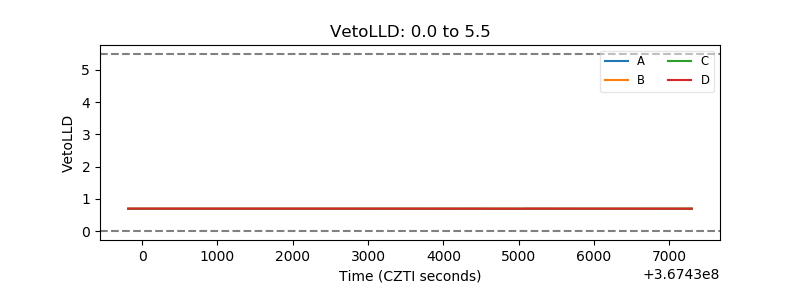 |
| Alpha Counter | 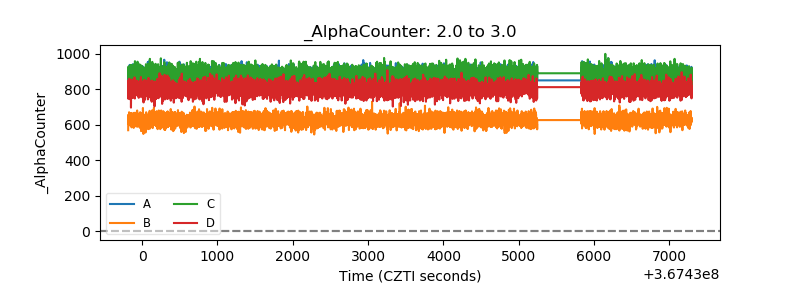 |
| _CPM_Rate | 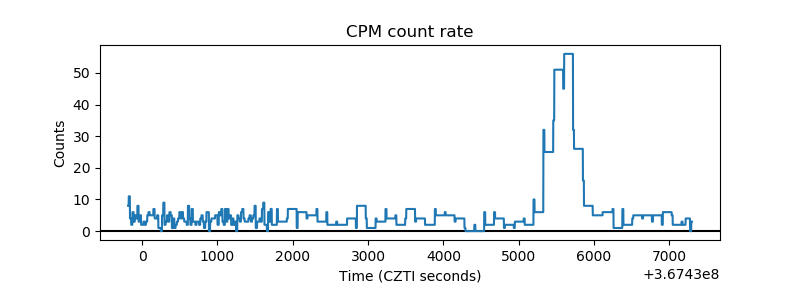 |
| CZT Counter | 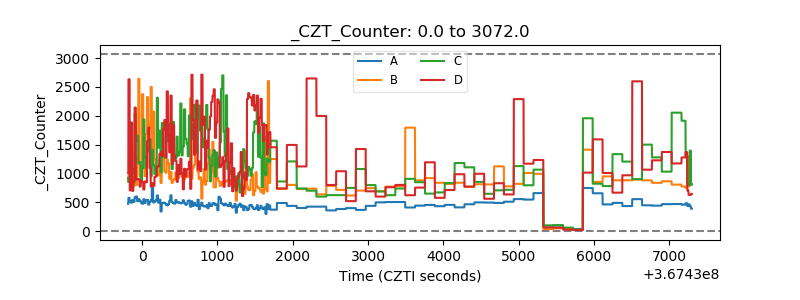 |
| +2.5 Volts monitor |  |
| +5 Volts monitor | 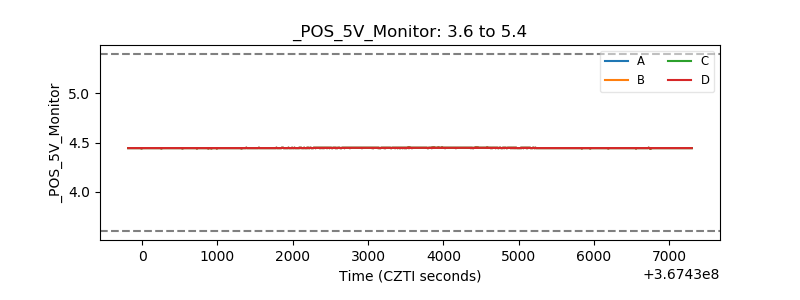 |
| _ROLL_ROT | 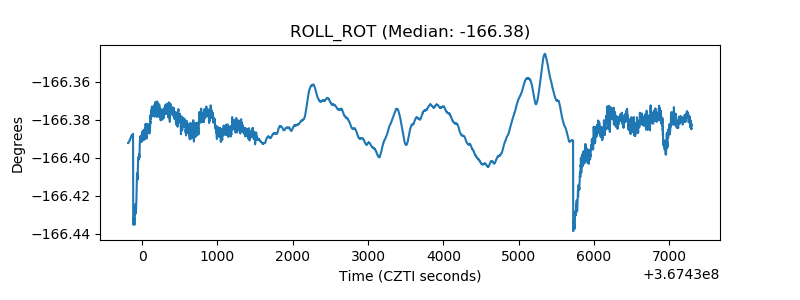 |
| _Roll_DEC | 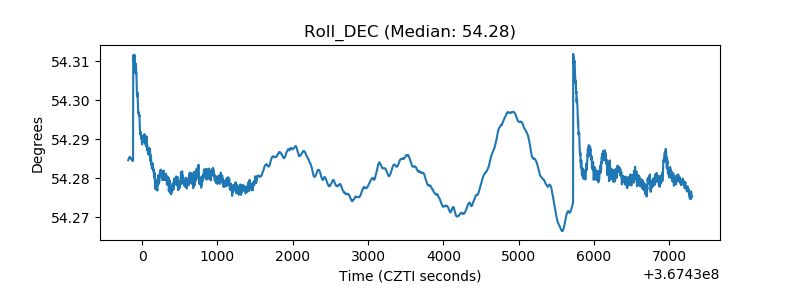 |
| _Roll_RA | 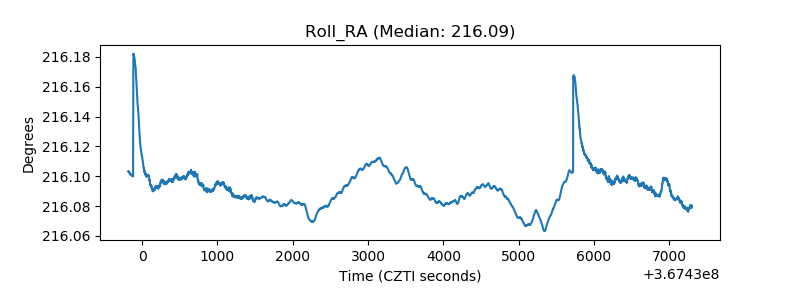 |
| Veto Counter | 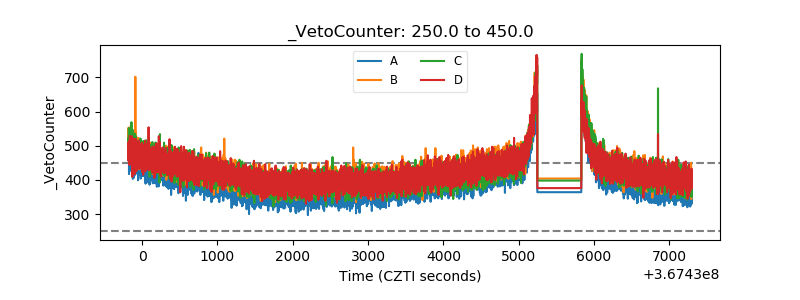 |