| Param | Original file | Final file |
|---|---|---|
| Filename | modeM0/AS1A10_123T09_9000004654_31922cztM0_level2.evt | modeM0/AS1A10_123T09_9000004654_31922cztM0_level2_quad_clean.evt |
| Size (bytes) | 763,810,560 | 96,177,600 |
| Size | 728.4 MB | 91.7 MB |
| Events in quadrant A | 3,259,282 | 662,956 |
| Events in quadrant B | 6,064,753 | 621,860 |
| Events in quadrant C | 6,809,654 | 572,158 |
| Events in quadrant D | 6,535,430 | 576,250 |
| Mode M0 | |||
|---|---|---|---|
| Quadrant | BADHDUFLAG | Total packets | Discarded packets |
| A | 0 | 14195 | 1 |
| B | 0 | 23322 | 1 |
| C | 0 | 24949 | 1 |
| D | 0 | 24143 | 1 |
| Mode SS | |||
|---|---|---|---|
| Quadrant | BADHDUFLAG | Total packets | Discarded packets |
| A | 0 | 140 | 0 |
| B | 0 | 140 | 0 |
| C | 0 | 140 | 0 |
| D | 0 | 140 | 0 |
| Mode M9 | |||
|---|---|---|---|
| Quadrant | BADHDUFLAG | Total packets | Discarded packets |
| A | 0 | 3 | 0 |
| B | 0 | 3 | 0 |
| C | 0 | 3 | 0 |
| D | 0 | 3 | 0 |
| Quadrant | Total seconds | Saturated seconds | Saturation percentage |
|---|---|---|---|
| A | 6867 | 26 | 0.378622% |
| B | 6867 | 432 | 6.290957% |
| C | 6867 | 1015 | 14.780836% |
| D | 6868 | 697 | 10.148515% |
Noise dominated data is calculated using 1-second bins in cleaned event files. If a bin has >2000 counts, and if more than 50% of those come from <1% of pixels, then it is considered to be noise-dominated and hence unusable.
| Quadrant | # 1 sec bins | Bins with >0 counts | Bins with >2000 counts | High rate bins dominated by noise | Noise dominated (total time) | Noise dominated (detector-on time) | Marked lightcurve |
|---|---|---|---|---|---|---|---|
| A | 7202 | 6868 | 1 | 1 | 0.01% | 0.01% | 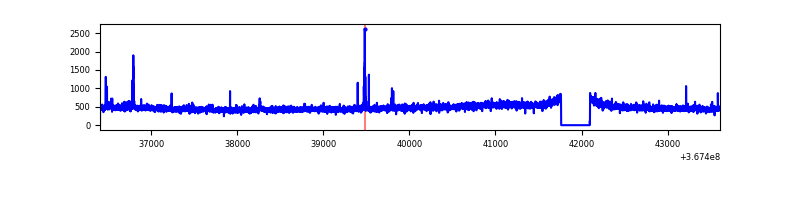 |
| B | 7202 | 6868 | 244 | 244 | 3.39% | 3.55% | 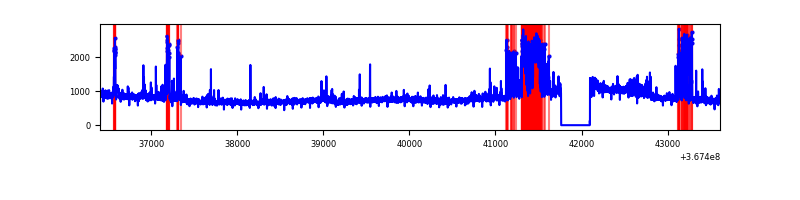 |
| C | 7202 | 6868 | 353 | 353 | 4.90% | 5.14% | 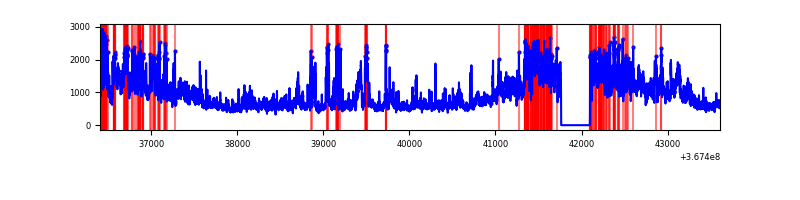 |
| D | 7203 | 6869 | 622 | 622 | 8.64% | 9.06% | 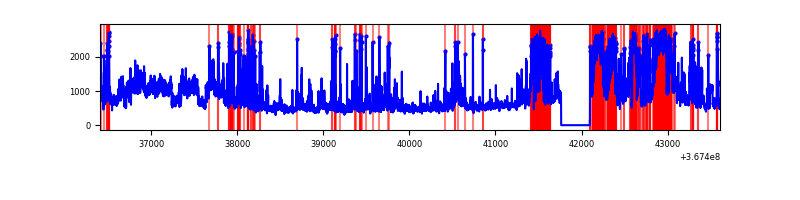 |
Top three noisy pixels from each quadrant. If the there are fewer than three noisy pixels in the level2.evt file, extra rows are filled as -1
| Pixel properties | Quadrant properties | ||||||
|---|---|---|---|---|---|---|---|
| Quadrant | DetID | PixID | Counts | Sigma | Mean | Median | Sigma |
| A | 12 | 96 | 37671 | 223.79 | 827 | 809 | 164.7 |
| A | 13 | 6 | 20721 | 120.89 | 827 | 809 | 164.7 |
| A | 13 | 254 | 13918 | 79.58 | 827 | 809 | 164.7 |
| B | 6 | 159 | 1984388 | 13179.31 | 796 | 776 | 150.5 |
| B | 5 | 172 | 549928 | 3648.62 | 796 | 776 | 150.5 |
| B | 4 | 80 | 288454 | 1911.36 | 796 | 776 | 150.5 |
| C | 3 | 233 | 2671045 | 15062.11 | 752 | 756 | 177.3 |
| C | 0 | 10 | 890931 | 5021.15 | 752 | 756 | 177.3 |
| C | 0 | 207 | 124416 | 697.52 | 752 | 756 | 177.3 |
| D | 8 | 195 | 1367165 | 7336.03 | 772 | 748 | 186.3 |
| D | 12 | 233 | 1101355 | 5908.95 | 772 | 748 | 186.3 |
| D | 12 | 33 | 414150 | 2219.48 | 772 | 748 | 186.3 |
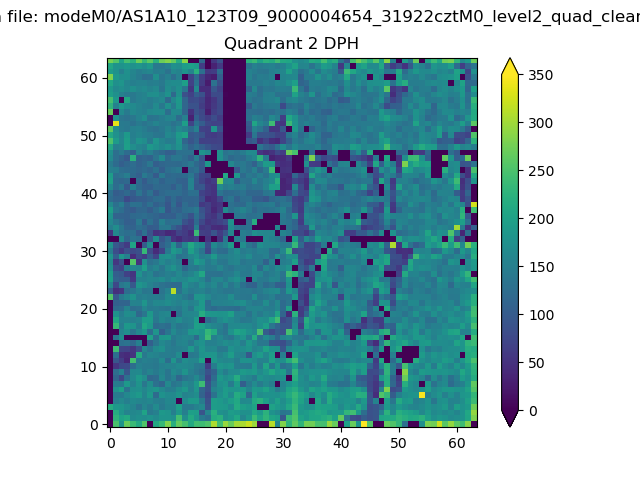
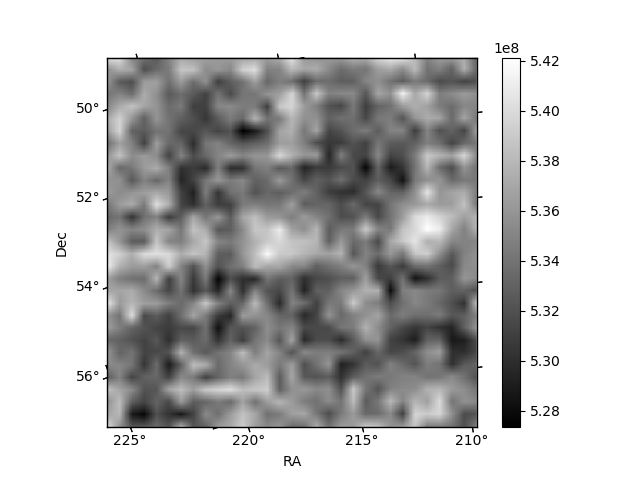
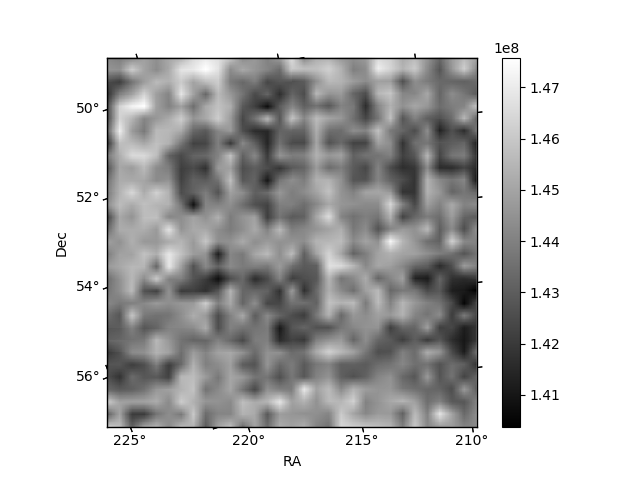
Histogram calculated using DETX and DETY for each event in the final _common_clean file
| Quadrant A | 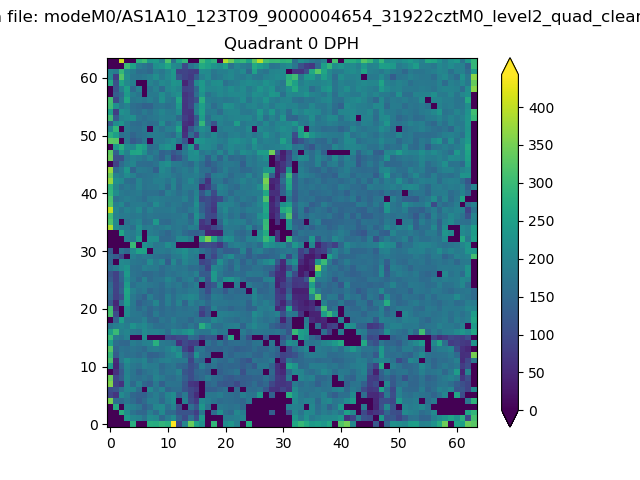 |
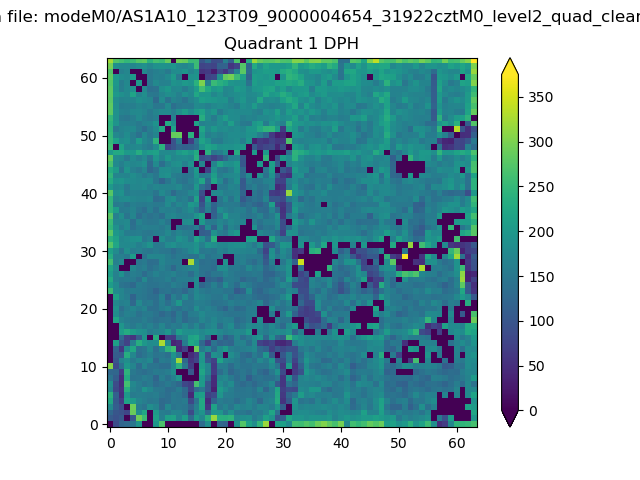 |
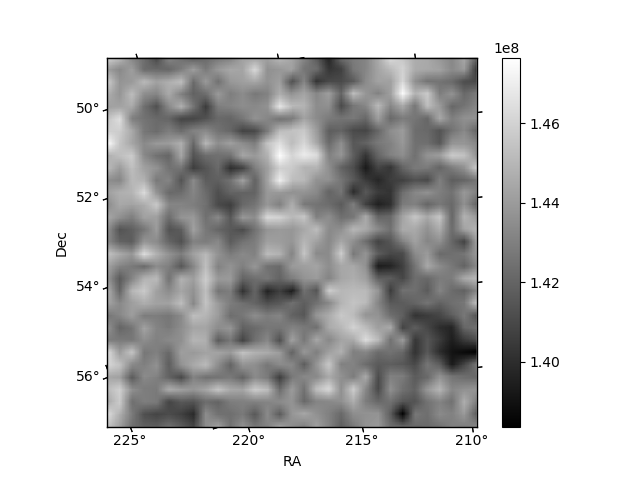
Quadrant B |
|---|---|---|---|
| Quadrant D | 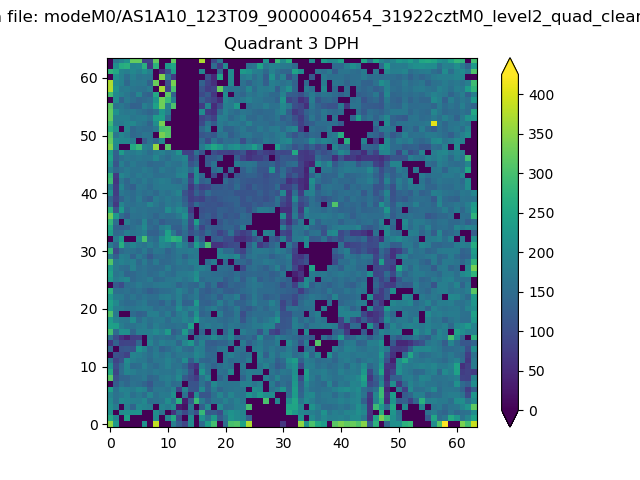 |
 |
Quadrant C |
| Plot type | Count rate plots | Images |
|---|---|---|
| Comparison with Poisson distribution Blue bars denote a histogram of data divided into 1 sec bins. Red curve is a Poisson curve with rate = median count rate of data. |
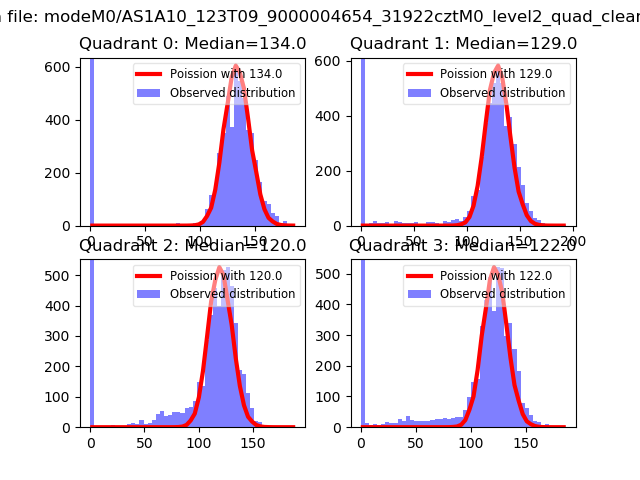 |
 |
| Quadrant-wise count rates Data is divided into 100 sec bins |
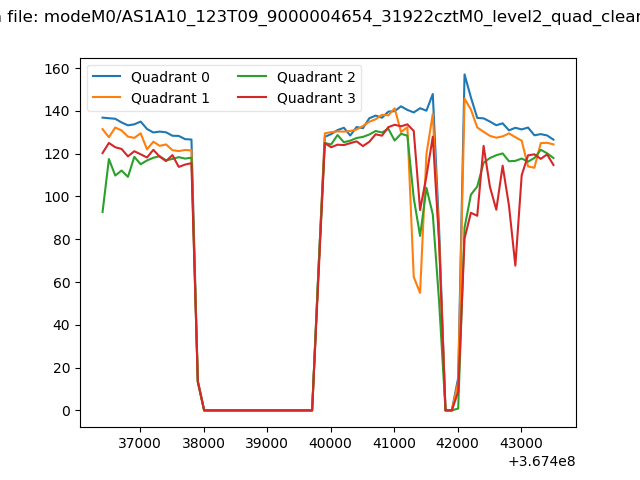 |
|
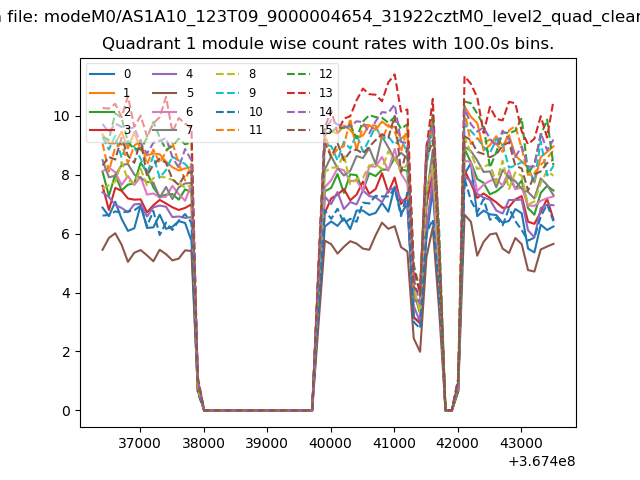
| Module-wise count rates for Quadrant A Data is divided into 100 sec bins |
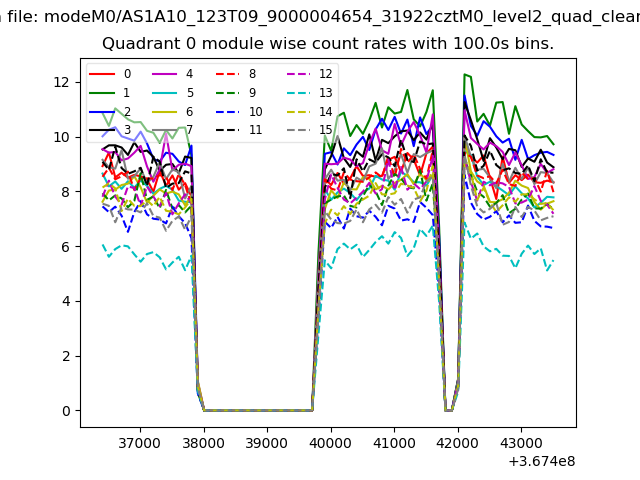 |
 |
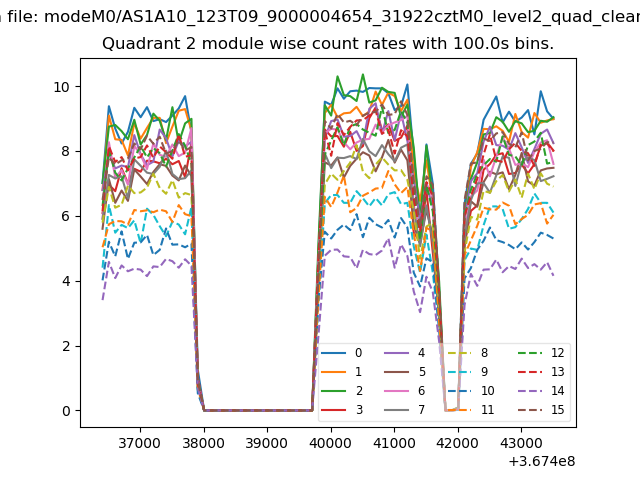
| Module-wise count rates for Quadrant B Data is divided into 100 sec bins |
 |
 |
| Module-wise count rates for Quadrant C Data is divided into 100 sec bins |
 |
 |
| Module-wise count rates for Quadrant D Data is divided into 100 sec bins |
 |
 |
| Parameter | Plot |
|---|---|
| CZT HV Monitor |  |
| D_VDD | 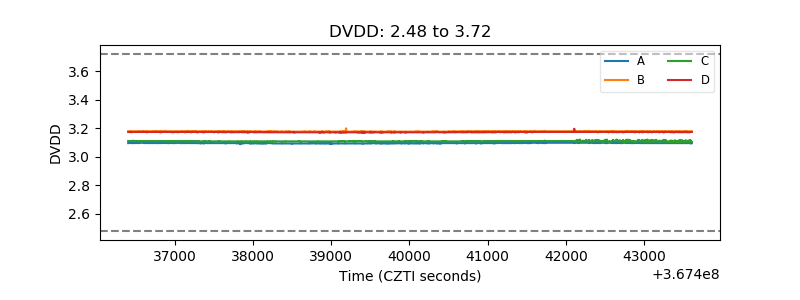 |
| Temperature 1 |  |
| Veto HV Monitor | 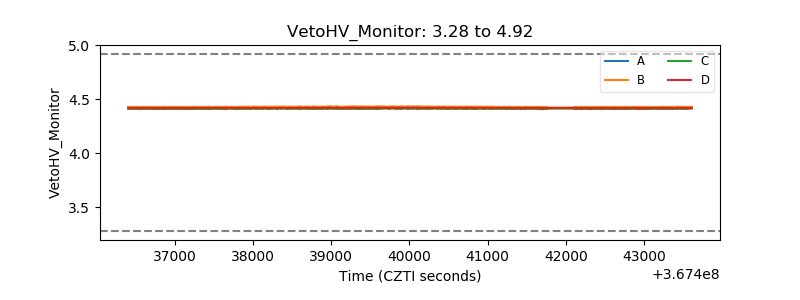 |
| Veto LLD | 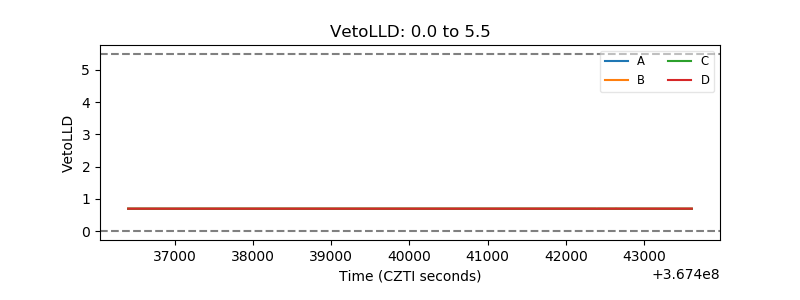 |
| Alpha Counter | 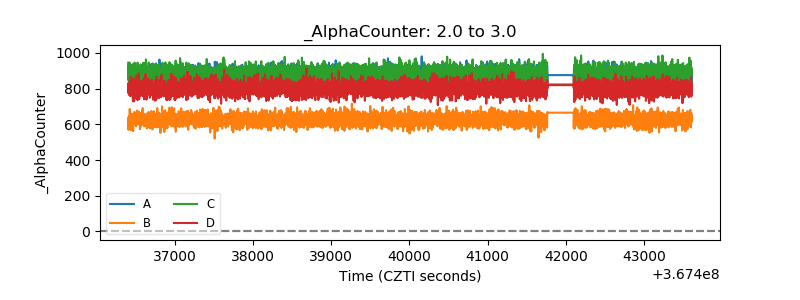 |
| _CPM_Rate | 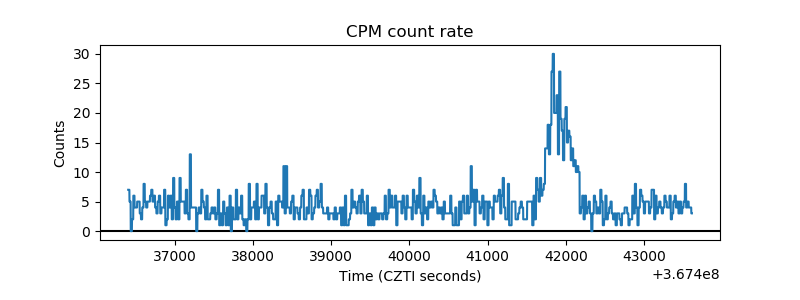 |
| CZT Counter | 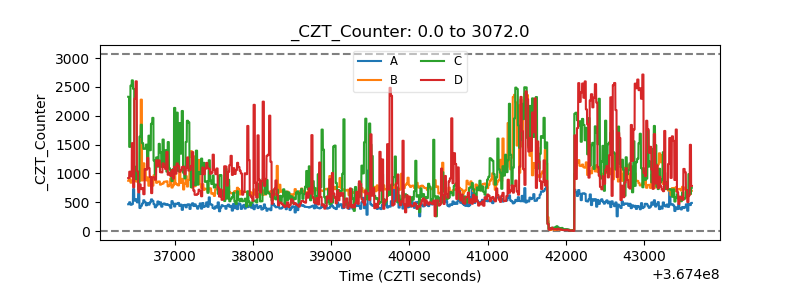 |
| +2.5 Volts monitor |  |
| +5 Volts monitor |  |
| _ROLL_ROT | 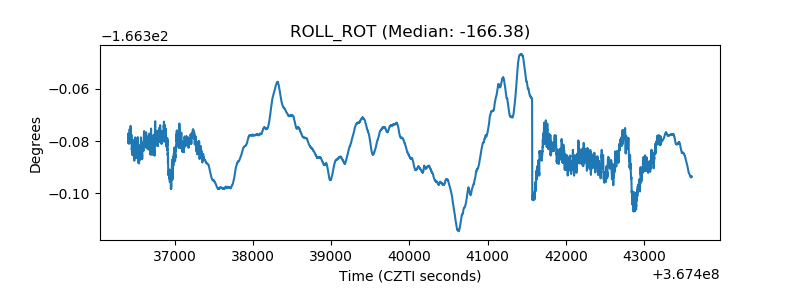 |
| _Roll_DEC | 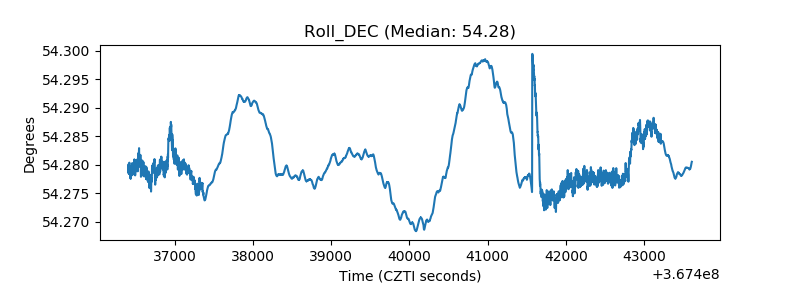 |
| _Roll_RA | 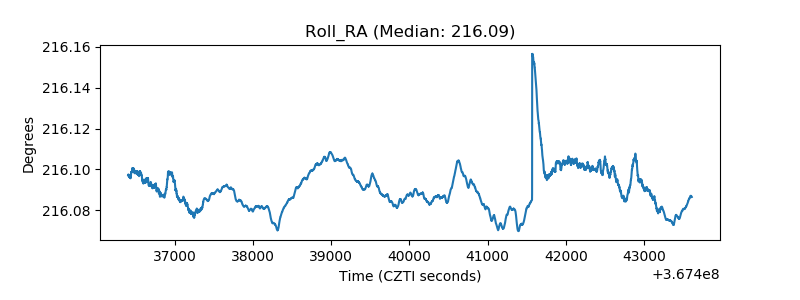 |
| Veto Counter | 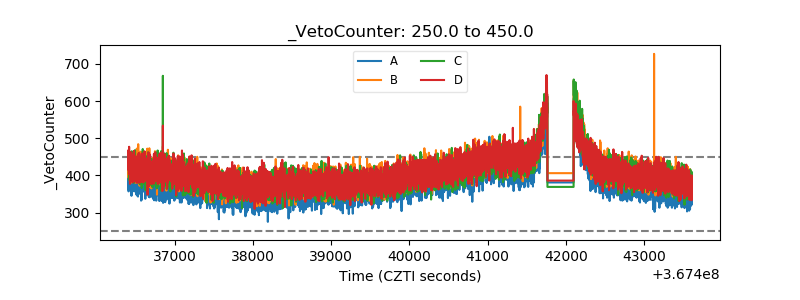 |