| Param | Original file | Final file |
|---|---|---|
| Filename | modeM0/AS1A10_123T09_9000004654_31926cztM0_level2.evt | modeM0/AS1A10_123T09_9000004654_31926cztM0_level2_quad_clean.evt |
| Size (bytes) | 594,613,440 | 65,335,680 |
| Size | 567.1 MB | 62.3 MB |
| Events in quadrant A | 2,521,429 | 426,859 |
| Events in quadrant B | 4,465,470 | 412,687 |
| Events in quadrant C | 6,012,780 | 381,448 |
| Events in quadrant D | 4,629,499 | 364,828 |
| Mode M0 | |||
|---|---|---|---|
| Quadrant | BADHDUFLAG | Total packets | Discarded packets |
| A | 0 | 12676 | 1310 |
| B | 0 | 20480 | 2898 |
| C | 0 | 24849 | 3028 |
| D | 0 | 20537 | 3156 |
| Mode SS | |||
|---|---|---|---|
| Quadrant | BADHDUFLAG | Total packets | Discarded packets |
| A | 0 | 128 | 14 |
| B | 0 | 127 | 13 |
| C | 0 | 130 | 14 |
| D | 0 | 126 | 12 |
| Mode M9 | |||
|---|---|---|---|
| Quadrant | BADHDUFLAG | Total packets | Discarded packets |
| A | 0 | 5 | 1 |
| B | 0 | 6 | 2 |
| C | 0 | 5 | 2 |
| D | 0 | 5 | 1 |
| Quadrant | Total seconds | Saturated seconds | Saturation percentage |
|---|---|---|---|
| A | 5636 | 9 | 0.159688% |
| B | 5589 | 113 | 2.021829% |
| C | 5583 | 702 | 12.573885% |
| D | 5568 | 527 | 9.464799% |
Noise dominated data is calculated using 1-second bins in cleaned event files. If a bin has >2000 counts, and if more than 50% of those come from <1% of pixels, then it is considered to be noise-dominated and hence unusable.
| Quadrant | # 1 sec bins | Bins with >0 counts | Bins with >2000 counts | High rate bins dominated by noise | Noise dominated (total time) | Noise dominated (detector-on time) | Marked lightcurve |
|---|---|---|---|---|---|---|---|
| A | 15637 | 5678 | 0 | 0 | 0.00% | 0.00% | 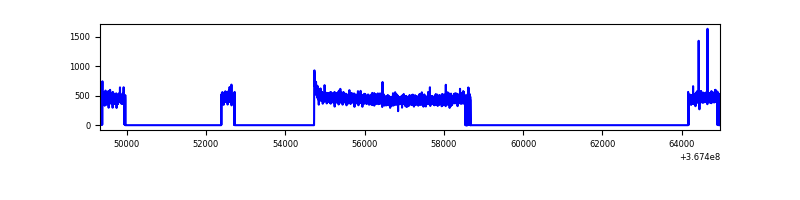 |
| B | 15622 | 5632 | 51 | 51 | 0.33% | 0.91% | 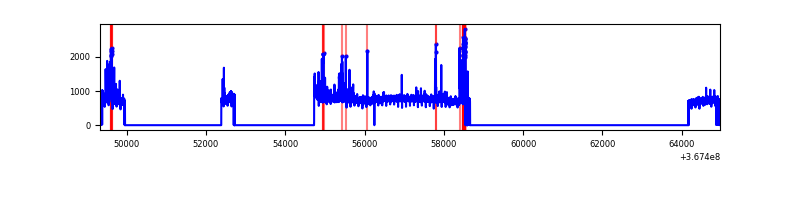 |
| C | 15621 | 5635 | 284 | 284 | 1.82% | 5.04% | 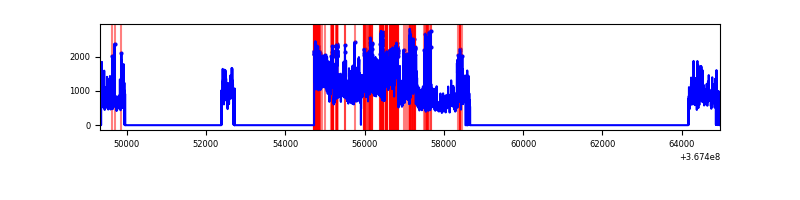 |
| D | 15629 | 5612 | 498 | 498 | 3.19% | 8.87% | 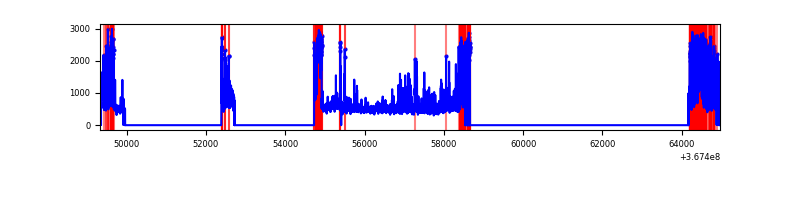 |
Top three noisy pixels from each quadrant. If the there are fewer than three noisy pixels in the level2.evt file, extra rows are filled as -1
| Pixel properties | Quadrant properties | ||||||
|---|---|---|---|---|---|---|---|
| Quadrant | DetID | PixID | Counts | Sigma | Mean | Median | Sigma |
| A | 13 | 254 | 11006 | 79.49 | 647 | 633 | 130.5 |
| A | 13 | 6 | 10947 | 79.04 | 647 | 633 | 130.5 |
| A | 3 | 137 | 6682 | 46.36 | 647 | 633 | 130.5 |
| B | 6 | 159 | 1560180 | 12856.35 | 633 | 617 | 121.3 |
| B | 4 | 80 | 212818 | 1749.29 | 633 | 617 | 121.3 |
| B | 10 | 245 | 142650 | 1170.86 | 633 | 617 | 121.3 |
| C | 3 | 233 | 3225315 | 23154.29 | 590 | 595 | 139.3 |
| C | 0 | 10 | 351448 | 2519.21 | 590 | 595 | 139.3 |
| C | 14 | 238 | 94418 | 673.67 | 590 | 595 | 139.3 |
| D | 12 | 33 | 1266767 | 8797.05 | 597 | 580 | 143.9 |
| D | 12 | 218 | 374860 | 2600.38 | 597 | 580 | 143.9 |
| D | 8 | 195 | 347107 | 2407.56 | 597 | 580 | 143.9 |
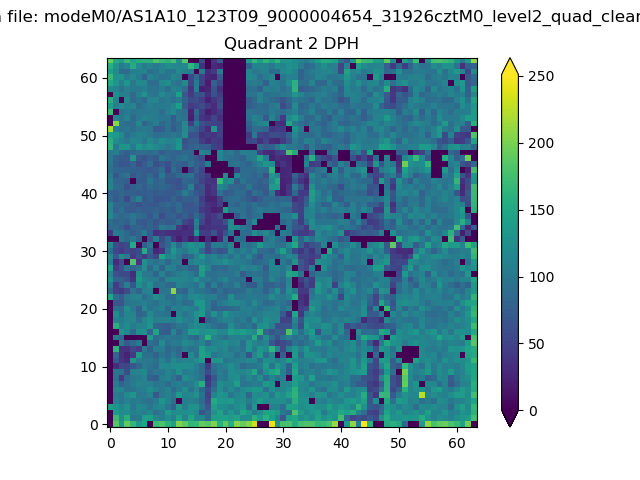
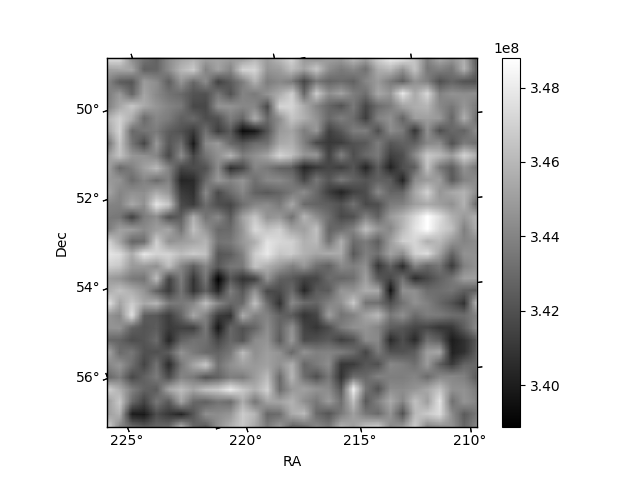
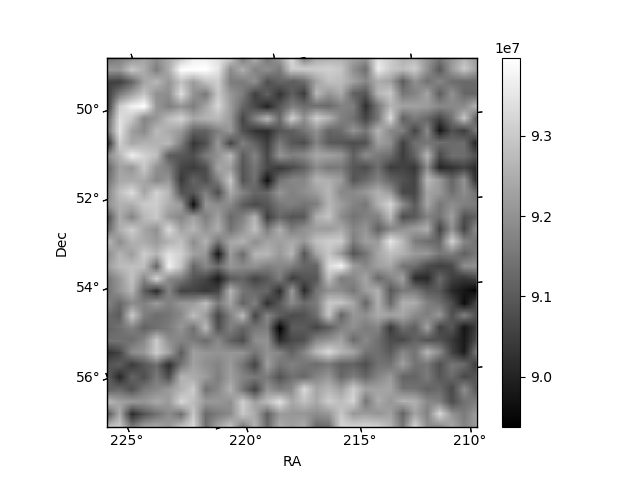
Histogram calculated using DETX and DETY for each event in the final _common_clean file
| Quadrant A | 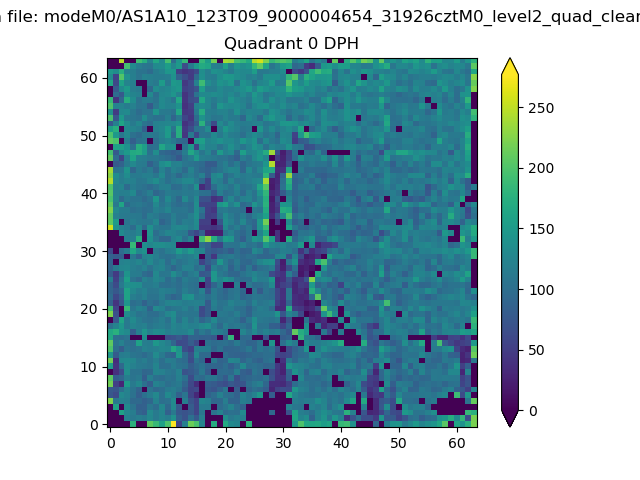 |
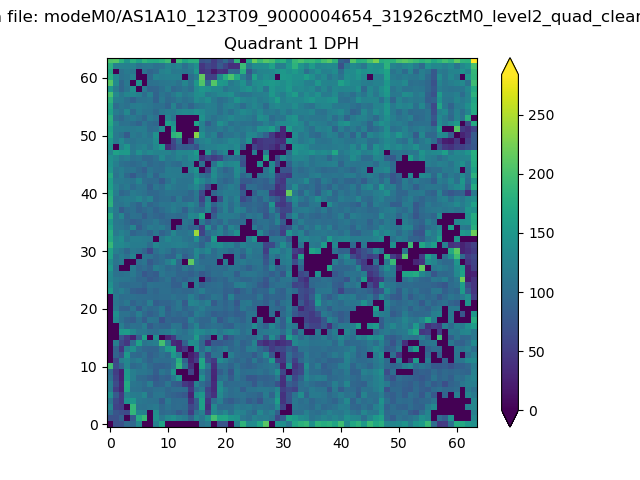 |
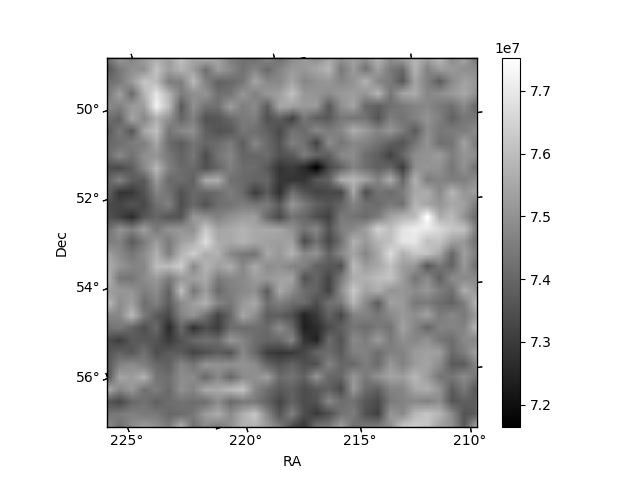
Quadrant B |
|---|---|---|---|
| Quadrant D | 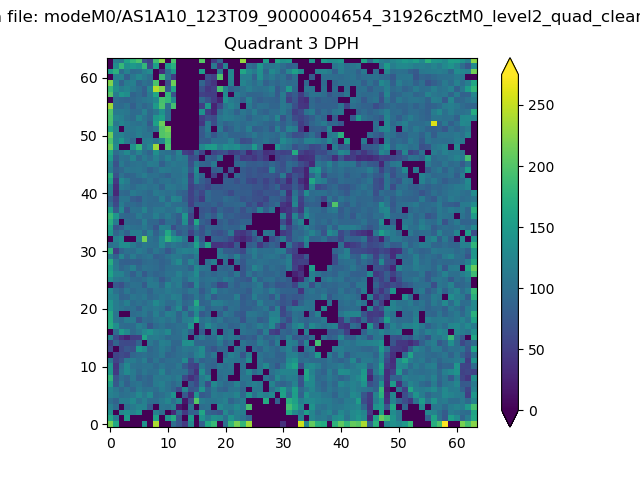 |
 |
Quadrant C |
| Plot type | Count rate plots | Images |
|---|---|---|
| Comparison with Poisson distribution Blue bars denote a histogram of data divided into 1 sec bins. Red curve is a Poisson curve with rate = median count rate of data. |
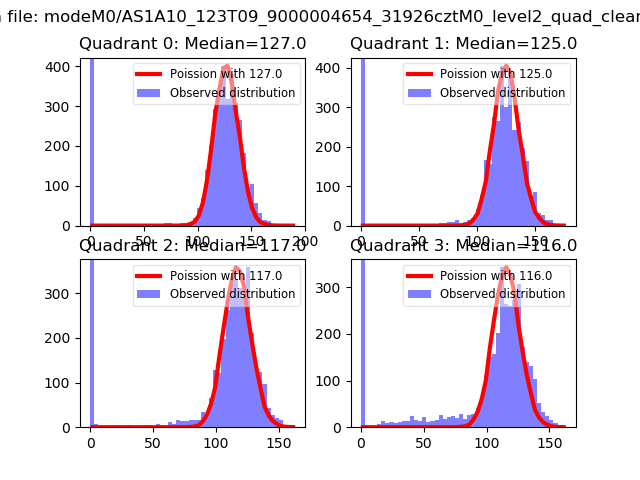 |
 |
| Quadrant-wise count rates Data is divided into 100 sec bins |
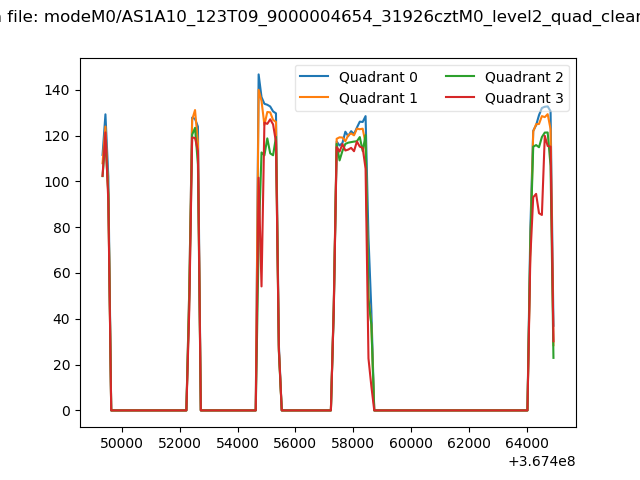 |
|
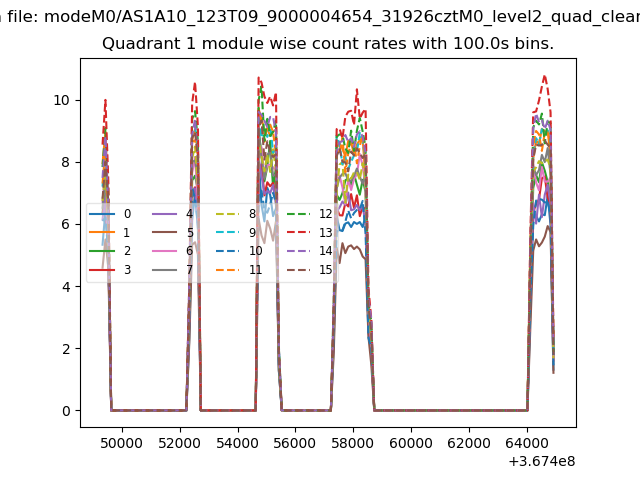
| Module-wise count rates for Quadrant A Data is divided into 100 sec bins |
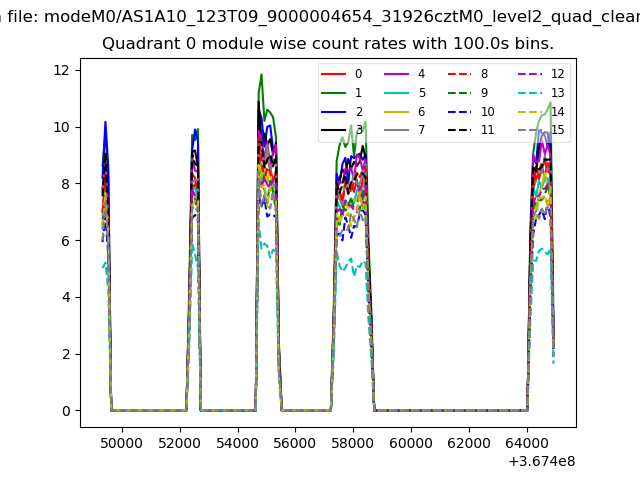 |
 |
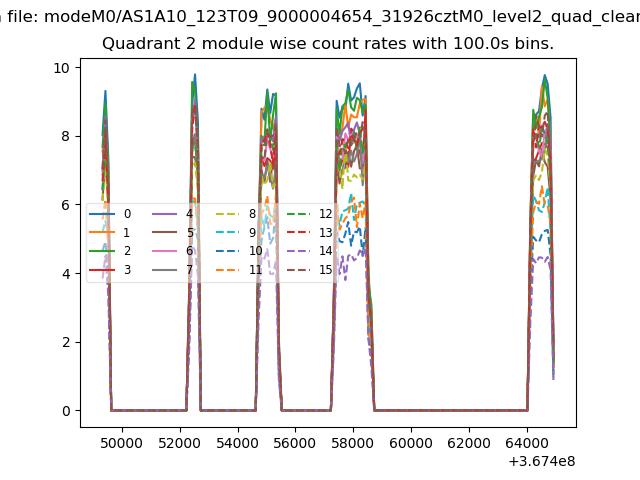
| Module-wise count rates for Quadrant B Data is divided into 100 sec bins |
 |
 |
| Module-wise count rates for Quadrant C Data is divided into 100 sec bins |
 |
 |
| Module-wise count rates for Quadrant D Data is divided into 100 sec bins |
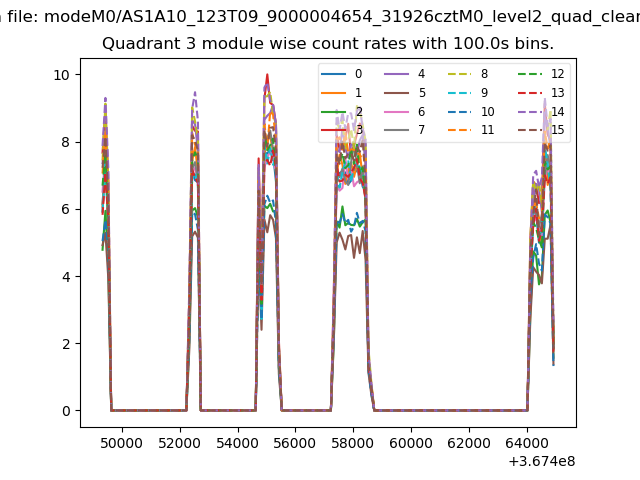 |
 |
| Parameter | Plot |
|---|---|
| CZT HV Monitor | 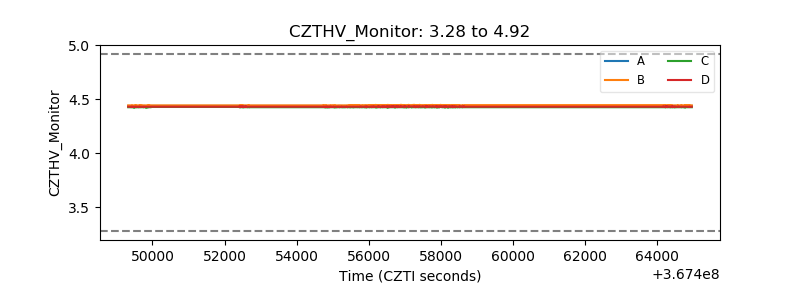 |
| D_VDD | 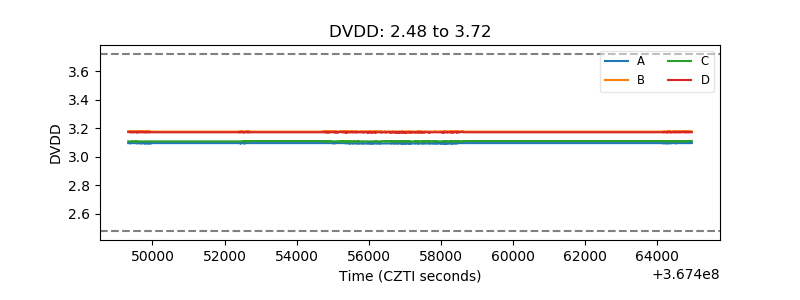 |
| Temperature 1 | 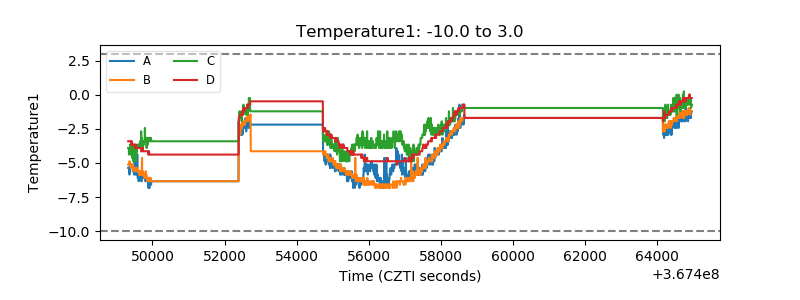 |
| Veto HV Monitor | 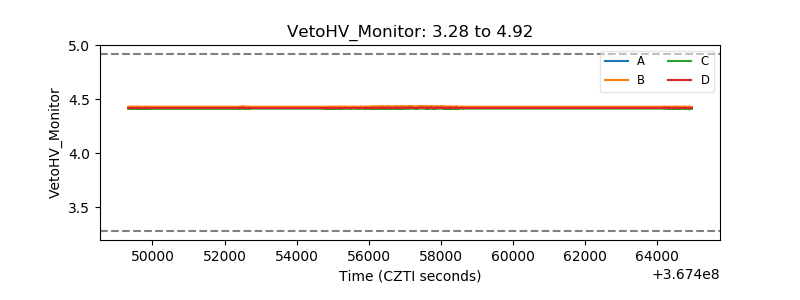 |
| Veto LLD | 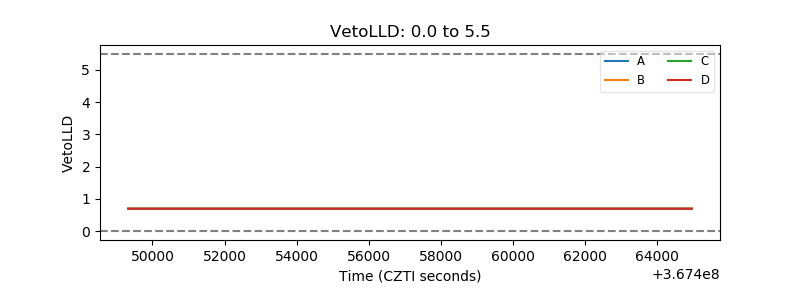 |
| Alpha Counter | 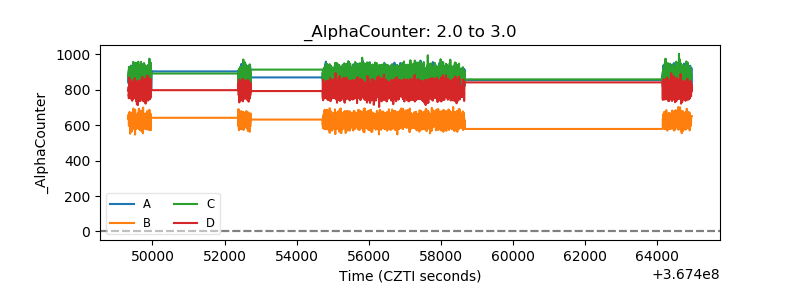 |
| _CPM_Rate | 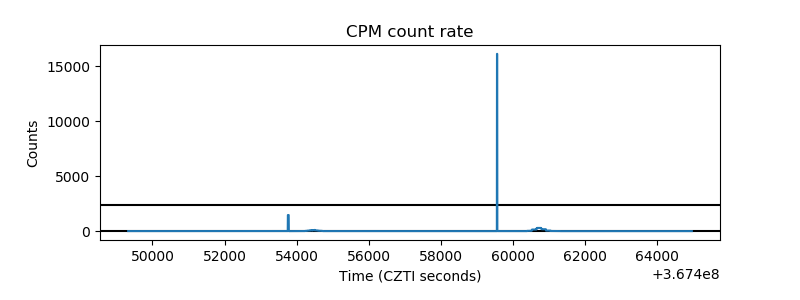 |
| CZT Counter | 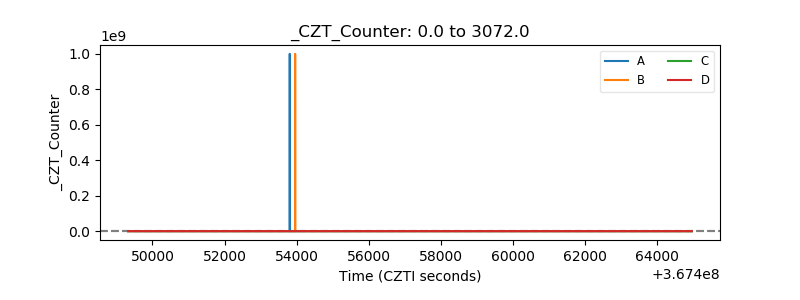 |
| +2.5 Volts monitor |  |
| +5 Volts monitor |  |
| _ROLL_ROT | 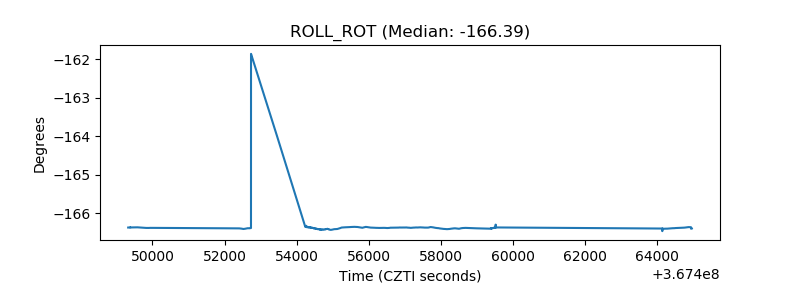 |
| _Roll_DEC | 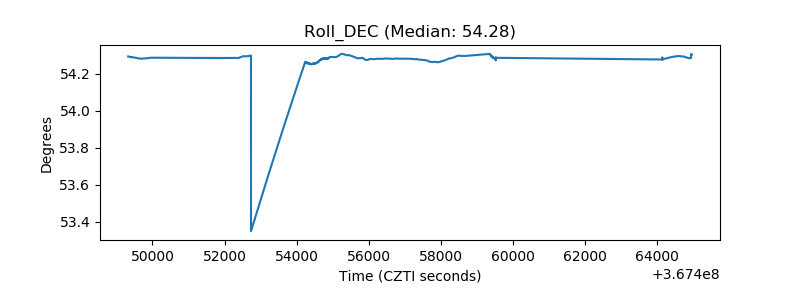 |
| _Roll_RA | 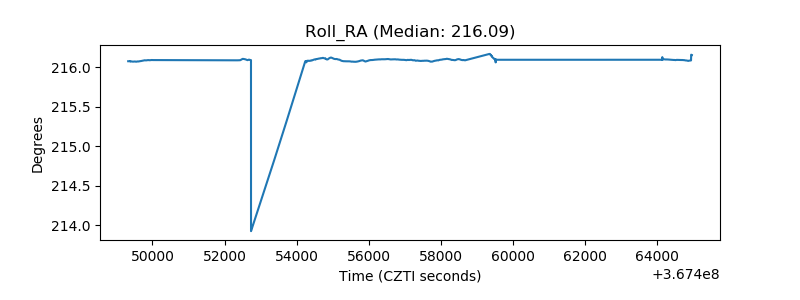 |
| Veto Counter | 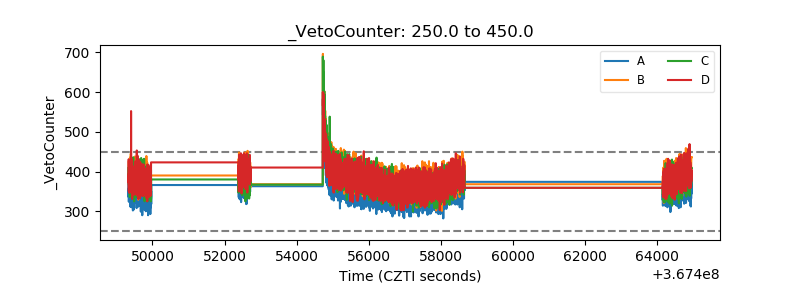 |