| Param | Original file | Final file |
|---|---|---|
| Filename | modeM0/AS1A10_123T09_9000004654_31933cztM0_level2.evt | modeM0/AS1A10_123T09_9000004654_31933cztM0_level2_quad_clean.evt |
| Size (bytes) | 1,052,328,960 | 126,976,320 |
| Size | 1003.6 MB | 121.1 MB |
| Events in quadrant A | 4,571,122 | 842,410 |
| Events in quadrant B | 7,352,743 | 822,569 |
| Events in quadrant C | 7,082,107 | 782,698 |
| Events in quadrant D | 12,226,362 | 740,638 |
| Mode M0 | |||
|---|---|---|---|
| Quadrant | BADHDUFLAG | Total packets | Discarded packets |
| A | 0 | 19523 | 1 |
| B | 0 | 29153 | 1 |
| C | 0 | 27563 | 1 |
| D | 0 | 42864 | 1 |
| Mode SS | |||
|---|---|---|---|
| Quadrant | BADHDUFLAG | Total packets | Discarded packets |
| A | 0 | 192 | 0 |
| B | 0 | 192 | 0 |
| C | 0 | 192 | 0 |
| D | 0 | 192 | 0 |
| Mode M9 | |||
|---|---|---|---|
| Quadrant | BADHDUFLAG | Total packets | Discarded packets |
| A | 0 | 8 | 0 |
| B | 0 | 8 | 0 |
| C | 0 | 8 | 0 |
| D | 0 | 8 | 0 |
| Quadrant | Total seconds | Saturated seconds | Saturation percentage |
|---|---|---|---|
| A | 9469 | 32 | 0.337945% |
| B | 9470 | 113 | 1.193242% |
| C | 9470 | 406 | 4.287223% |
| D | 9470 | 2585 | 27.296727% |
Noise dominated data is calculated using 1-second bins in cleaned event files. If a bin has >2000 counts, and if more than 50% of those come from <1% of pixels, then it is considered to be noise-dominated and hence unusable.
| Quadrant | # 1 sec bins | Bins with >0 counts | Bins with >2000 counts | High rate bins dominated by noise | Noise dominated (total time) | Noise dominated (detector-on time) | Marked lightcurve |
|---|---|---|---|---|---|---|---|
| A | 10294 | 9470 | 4 | 4 | 0.04% | 0.04% | 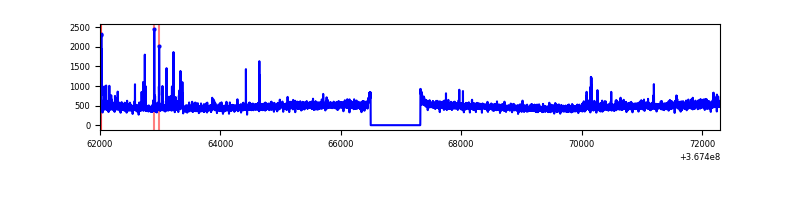 |
| B | 10295 | 9471 | 39 | 39 | 0.38% | 0.41% | 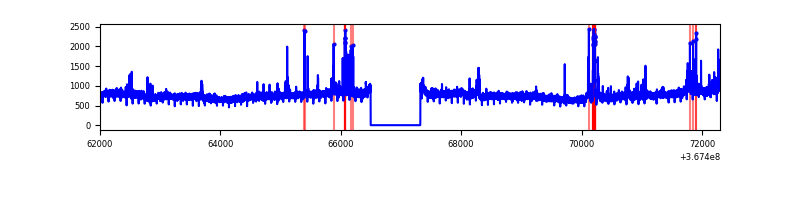 |
| C | 10295 | 9471 | 99 | 99 | 0.96% | 1.05% | 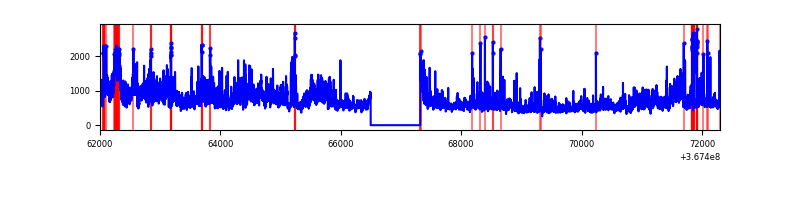 |
| D | 10295 | 9471 | 2518 | 2518 | 24.46% | 26.59% | 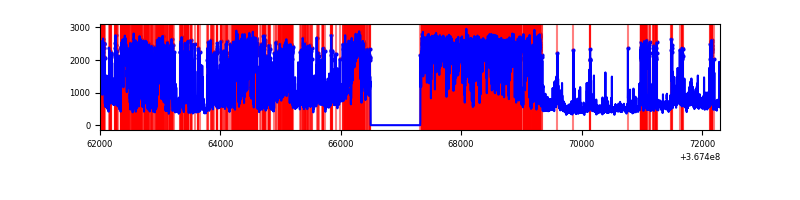 |
Top three noisy pixels from each quadrant. If the there are fewer than three noisy pixels in the level2.evt file, extra rows are filled as -1
| Pixel properties | Quadrant properties | ||||||
|---|---|---|---|---|---|---|---|
| Quadrant | DetID | PixID | Counts | Sigma | Mean | Median | Sigma |
| A | 12 | 96 | 192847 | 849.15 | 1128 | 1103 | 225.8 |
| A | 13 | 6 | 20602 | 86.35 | 1128 | 1103 | 225.8 |
| A | 13 | 254 | 17758 | 73.76 | 1128 | 1103 | 225.8 |
| B | 6 | 159 | 2623267 | 12492.16 | 1106 | 1077 | 209.9 |
| B | 4 | 80 | 157402 | 744.73 | 1106 | 1077 | 209.9 |
| B | 5 | 172 | 91308 | 429.86 | 1106 | 1077 | 209.9 |
| C | 3 | 233 | 2329203 | 9393.49 | 1059 | 1066 | 247.8 |
| C | 0 | 10 | 324739 | 1305.95 | 1059 | 1066 | 247.8 |
| C | 14 | 238 | 207649 | 833.51 | 1059 | 1066 | 247.8 |
| D | 12 | 33 | 6632095 | 28784.42 | 956 | 931 | 230.4 |
| D | 8 | 195 | 882524 | 3826.8 | 956 | 931 | 230.4 |
| D | 12 | 218 | 487274 | 2111.11 | 956 | 931 | 230.4 |
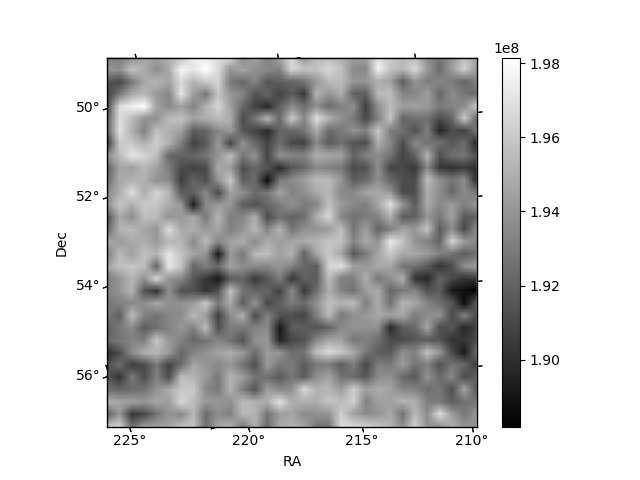
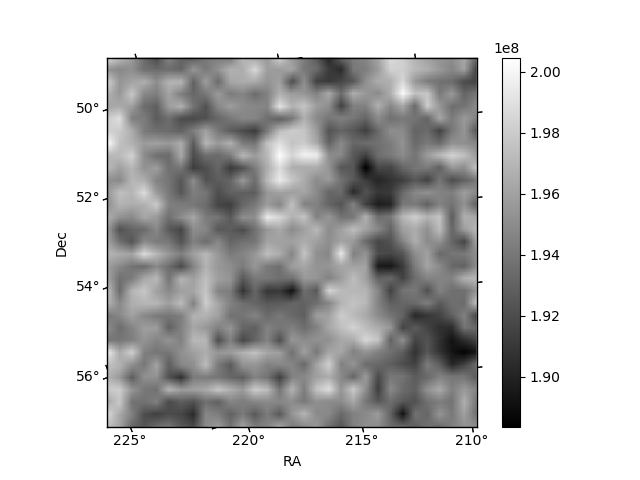
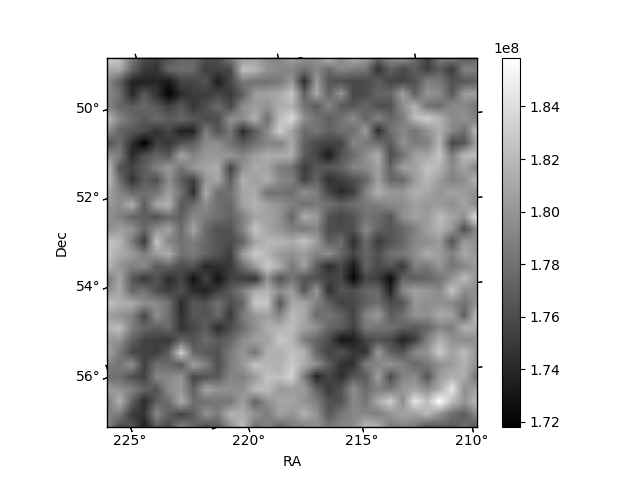
Histogram calculated using DETX and DETY for each event in the final _common_clean file
| Quadrant A | 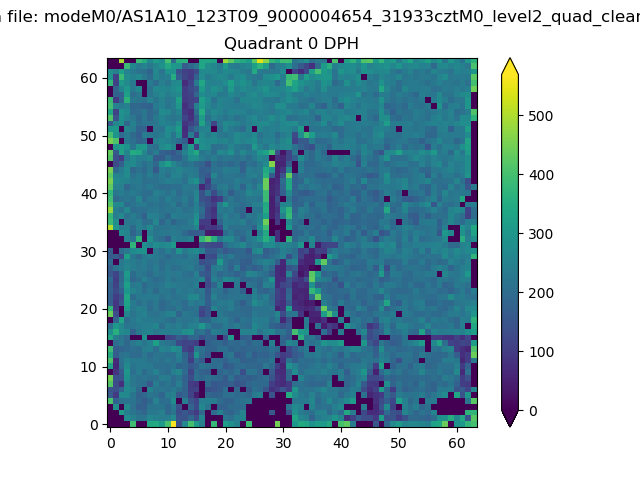 |
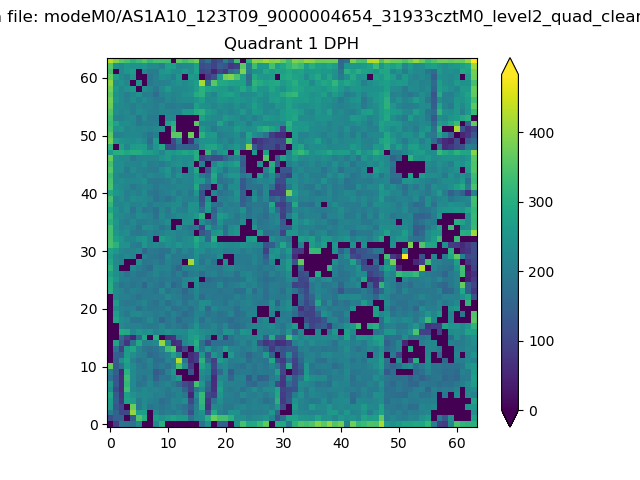 |
Quadrant B |
|---|---|---|---|
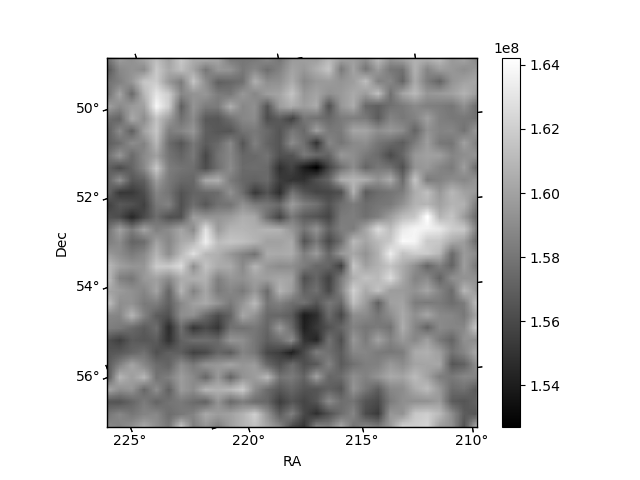
| Quadrant D | 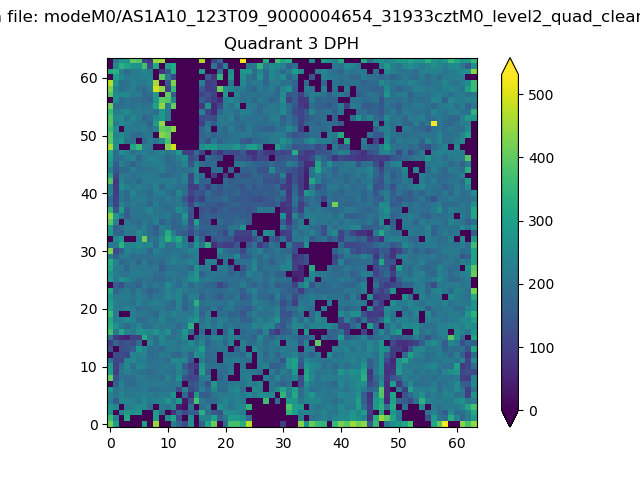 |
 |
Quadrant C |
| Plot type | Count rate plots | Images |
|---|---|---|
| Comparison with Poisson distribution Blue bars denote a histogram of data divided into 1 sec bins. Red curve is a Poisson curve with rate = median count rate of data. |
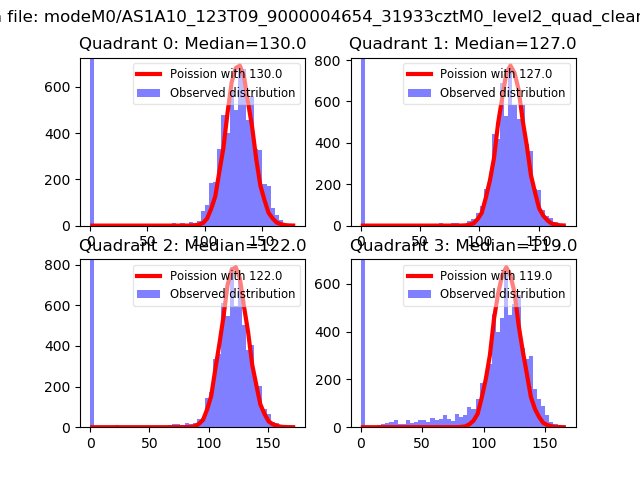 |
 |
| Quadrant-wise count rates Data is divided into 100 sec bins |
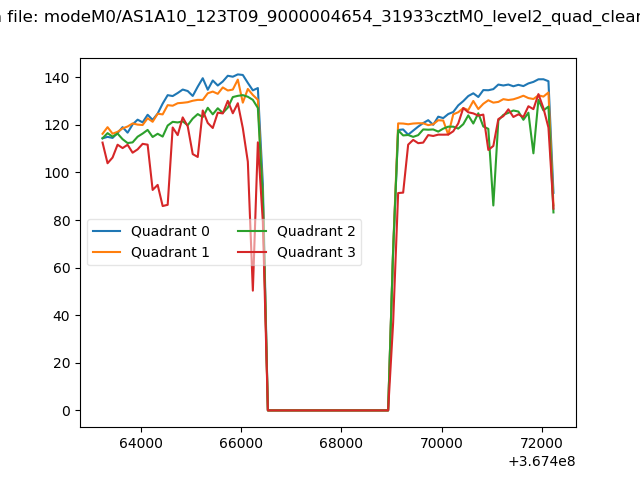 |
|
| Module-wise count rates for Quadrant A Data is divided into 100 sec bins |
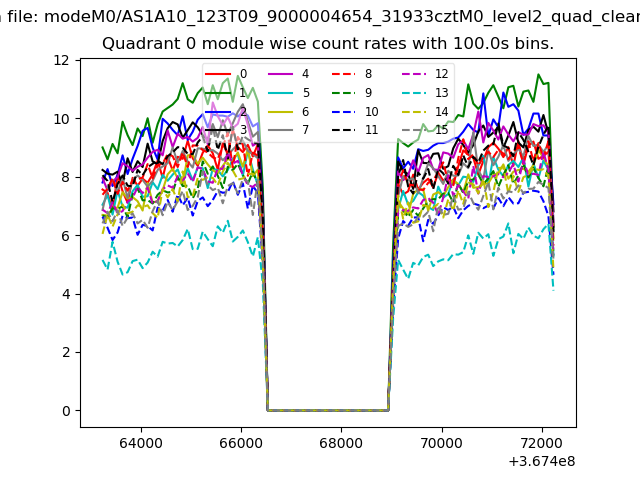 |
 |
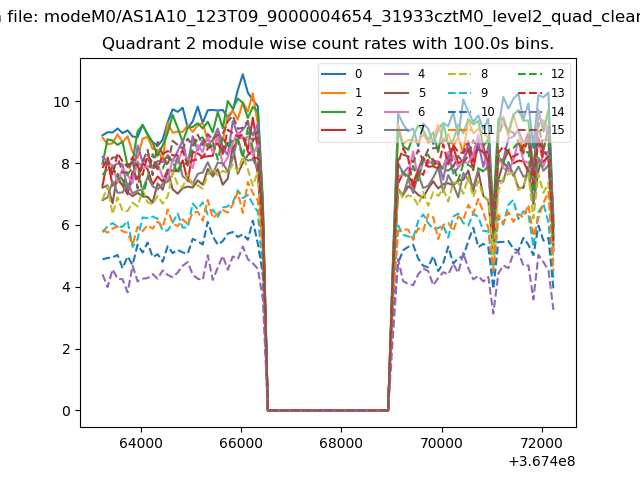
| Module-wise count rates for Quadrant B Data is divided into 100 sec bins |
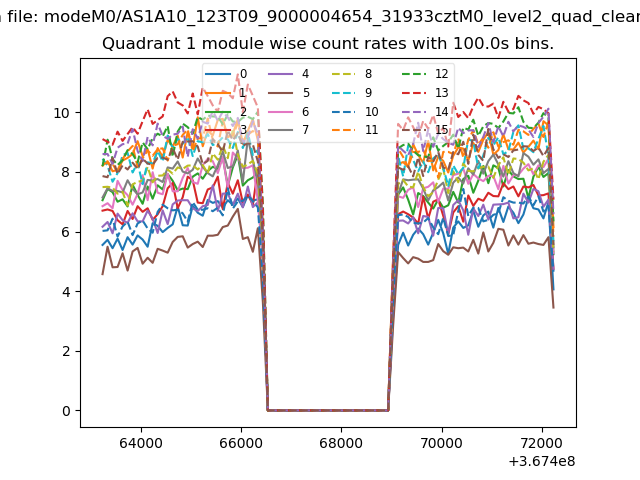 |
 |
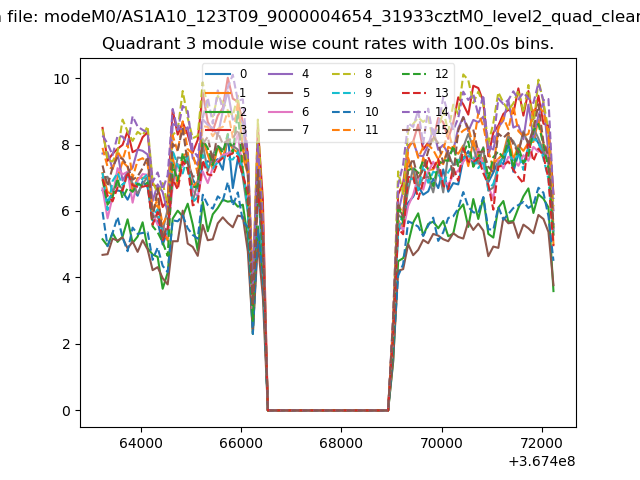
| Module-wise count rates for Quadrant C Data is divided into 100 sec bins |
 |
 |
| Module-wise count rates for Quadrant D Data is divided into 100 sec bins |
 |
 |
| Parameter | Plot |
|---|---|
| CZT HV Monitor | 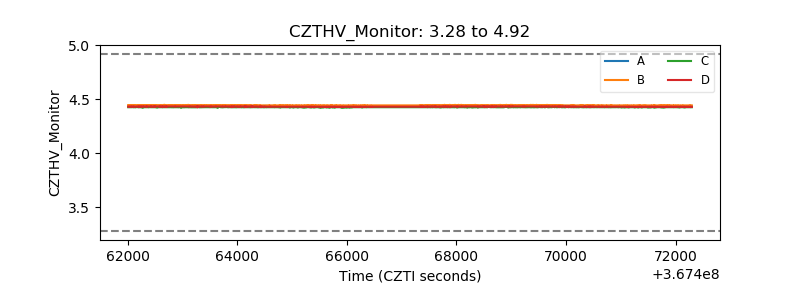 |
| D_VDD | 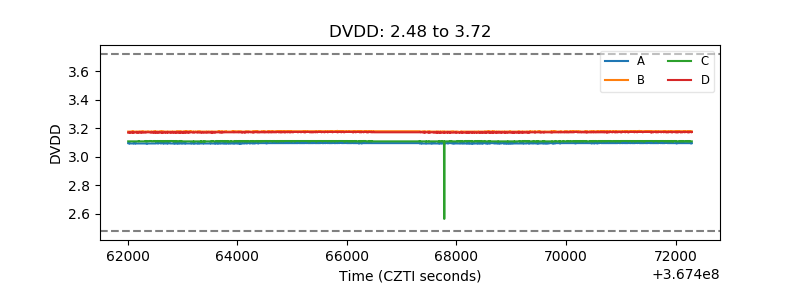 |
| Temperature 1 |  |
| Veto HV Monitor |  |
| Veto LLD |  |
| Alpha Counter | 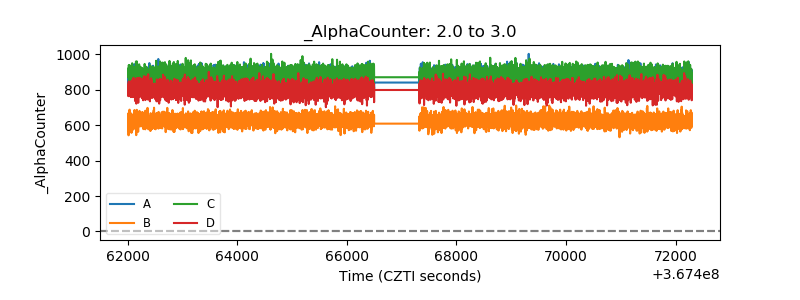 |
| _CPM_Rate | 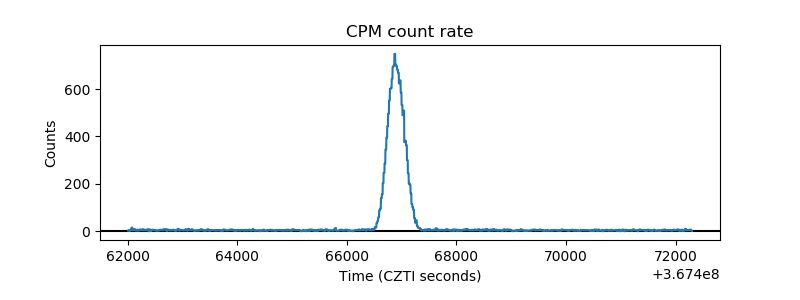 |
| CZT Counter | 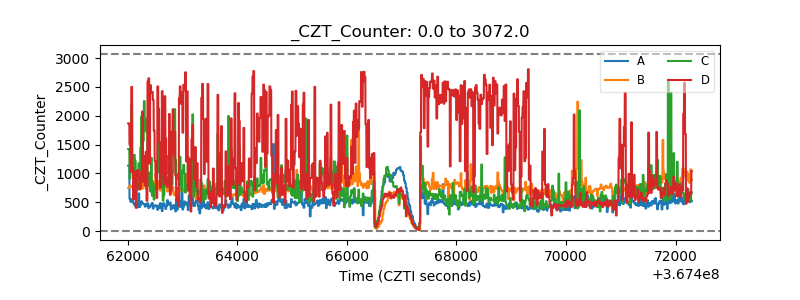 |
| +2.5 Volts monitor |  |
| +5 Volts monitor | 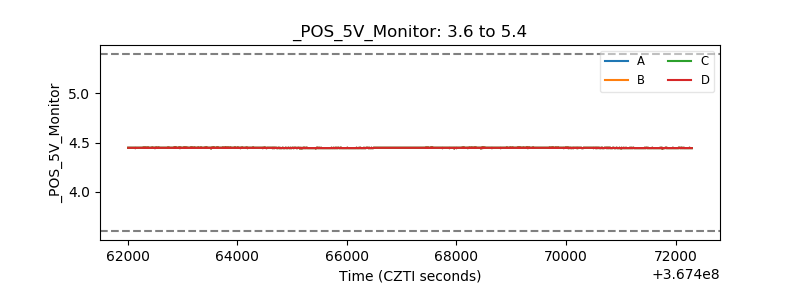 |
| _ROLL_ROT | 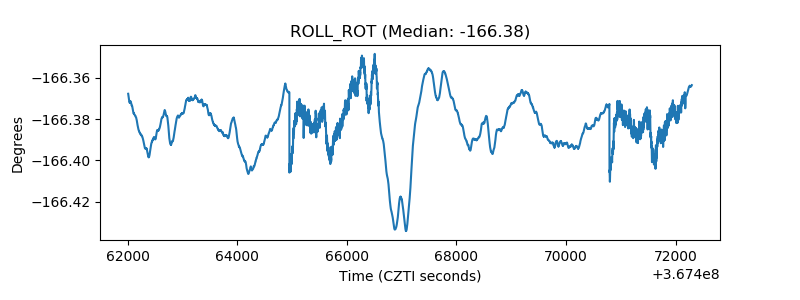 |
| _Roll_DEC | 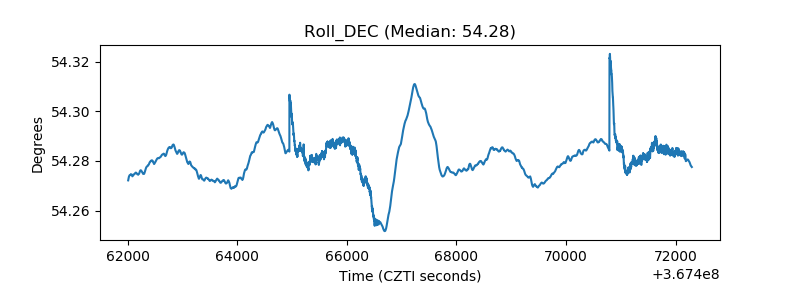 |
| _Roll_RA | 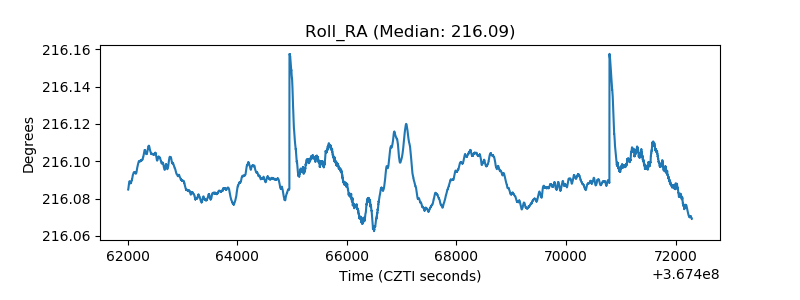 |
| Veto Counter | 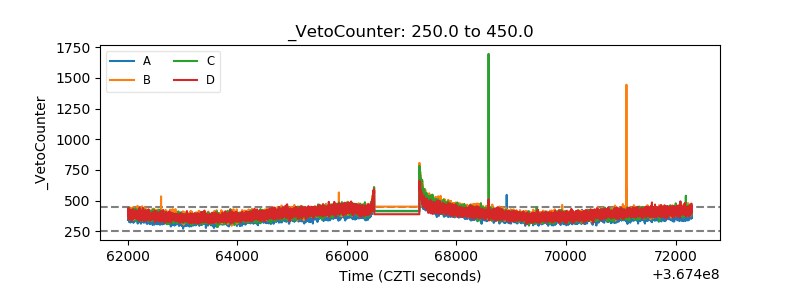 |