| Param | Original file | Final file |
|---|---|---|
| Filename | modeM0/AS1T04_044T01_9000004652cztM0_level2.fits | modeM0/AS1T04_044T01_9000004652cztM0_level2_quad_clean.evt |
| Size (bytes) | 144,319,680 | 122,460,480 |
| Size | 137.6 MB | 116.8 MB |
| Events in quadrant A | 926,826 | 754,407 |
| Events in quadrant B | 844,010 | 686,477 |
| Events in quadrant C | 835,200 | 629,459 |
| Events in quadrant D | 780,574 | 653,643 |
| Mode SS | |||
|---|---|---|---|
| Quadrant | BADHDUFLAG | Total packets | Discarded packets |
| A | 0 | 296 | 0 |
| B | 0 | 294 | 0 |
| C | 0 | 296 | 0 |
| D | 0 | 296 | 0 |
| Mode M9 | |||
|---|---|---|---|
| Quadrant | BADHDUFLAG | Total packets | Discarded packets |
| A | 0 | 25 | 0 |
| B | 0 | 25 | 0 |
| C | 0 | 25 | 0 |
| D | 0 | 25 | 0 |
| Mode M0 | |||
|---|---|---|---|
| Quadrant | BADHDUFLAG | Total packets | Discarded packets |
| A | 0 | 29623 | 0 |
| B | 0 | 48723 | 0 |
| C | 0 | 45647 | 0 |
| D | 0 | 36835 | 0 |
| Quadrant | Total seconds | Saturated seconds | Saturation percentage |
|---|---|---|---|
| A | 14275 | 88 | 0.616462% |
| B | 14138 | 953 | 6.740699% |
| C | 14229 | 1300 | 9.136271% |
| D | 14250 | 153 | 1.073684% |
Noise dominated data is calculated using 1-second bins in cleaned event files. If a bin has >2000 counts, and if more than 50% of those come from <1% of pixels, then it is considered to be noise-dominated and hence unusable.
| Quadrant | # 1 sec bins | Bins with >0 counts | Bins with >2000 counts | High rate bins dominated by noise | Noise dominated (total time) | Noise dominated (detector-on time) | Marked lightcurve |
|---|---|---|---|---|---|---|---|
| A | 17297 | 14334 | 0 | 0 | 0.00% | 0.00% |  |
| B | 17298 | 14188 | 0 | 0 | 0.00% | 0.00% |  |
| C | 17298 | 14266 | 0 | 0 | 0.00% | 0.00% |  |
| D | 17298 | 14303 | 0 | 0 | 0.00% | 0.00% |  |
Top three noisy pixels from each quadrant. If the there are fewer than three noisy pixels in the level2.evt file, extra rows are filled as -1
| Pixel properties | Quadrant properties | ||||||
|---|---|---|---|---|---|---|---|
| Quadrant | DetID | PixID | Counts | Sigma | Mean | Median | Sigma |
| A | 0 | 29 | 869 | 10.59 | 241 | 227 | 60.6 |
| A | 7 | 110 | 748 | 8.59 | 241 | 227 | 60.6 |
| A | 9 | 19 | 702 | 7.83 | 241 | 227 | 60.6 |
| B | 2 | 9 | 669 | 9.99 | 223 | 214 | 45.5 |
| B | 5 | 128 | 585 | 8.15 | 223 | 214 | 45.5 |
| B | 5 | 232 | 583 | 8.1 | 223 | 214 | 45.5 |
| C | 1 | 81 | 644 | 7.58 | 221 | 206 | 57.8 |
| C | 1 | 80 | 600 | 6.82 | 221 | 206 | 57.8 |
| C | 3 | 187 | 577 | 6.42 | 221 | 206 | 57.8 |
| D | 7 | 3 | 597 | 6.52 | 222 | 203 | 60.5 |
| D | 15 | 47 | 570 | 6.07 | 222 | 203 | 60.5 |
| D | 10 | 189 | 568 | 6.04 | 222 | 203 | 60.5 |
Histogram calculated using DETX and DETY for each event in the final _common_clean file
| Quadrant A | 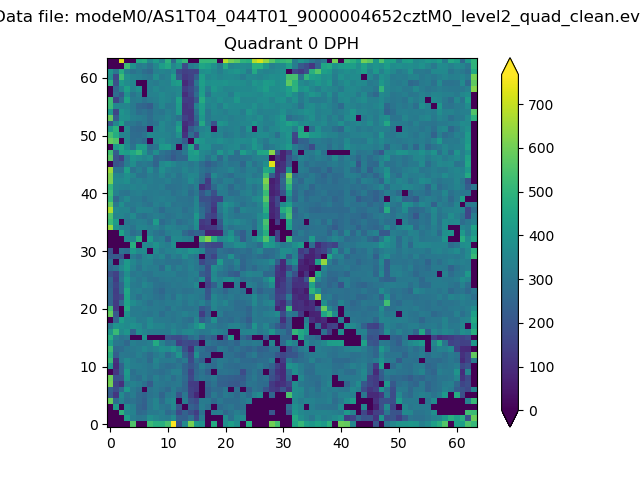 |
 |
Quadrant B |
|---|---|---|---|
| Quadrant D | 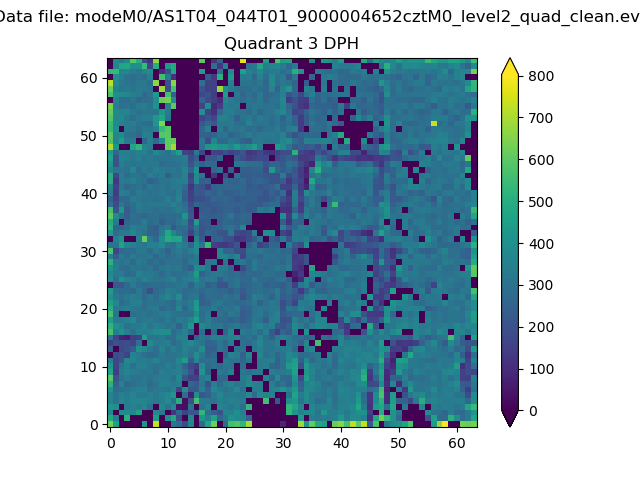 |
 |
Quadrant C |
| Plot type | Count rate plots | Images |
|---|---|---|
| Comparison with Poisson distribution Blue bars denote a histogram of data divided into 1 sec bins. Red curve is a Poisson curve with rate = median count rate of data. |
 |
 |
| Quadrant-wise count rates Data is divided into 100 sec bins |
 |
|
| Module-wise count rates for Quadrant A Data is divided into 100 sec bins |
 |
 |
| Module-wise count rates for Quadrant B Data is divided into 100 sec bins |
 |
 |
| Module-wise count rates for Quadrant C Data is divided into 100 sec bins |
 |
 |
| Module-wise count rates for Quadrant D Data is divided into 100 sec bins |
 |
 |
| Parameter | Plot |
|---|---|
| CZT HV Monitor |  |
| D_VDD |  |
| Temperature 1 |  |
| Veto HV Monitor |  |
| Veto LLD |  |
| Alpha Counter |  |
| _CPM_Rate |  |
| CZT Counter |  |
| +2.5 Volts monitor |  |
| +5 Volts monitor |  |
| _ROLL_ROT |  |
| _Roll_DEC |  |
| _Roll_RA |  |
| Veto Counter |  |