| Param | Original file | Final file |
|---|---|---|
| Filename | modeM0/AS1T04_044T01_9000004652_31898cztM0_level2.evt | modeM0/AS1T04_044T01_9000004652_31898cztM0_level2_quad_clean.evt |
| Size (bytes) | 606,081,600 | 65,980,800 |
| Size | 578.0 MB | 62.9 MB |
| Events in quadrant A | 3,316,873 | 396,995 |
| Events in quadrant B | 5,648,094 | 377,050 |
| Events in quadrant C | 4,635,995 | 378,754 |
| Events in quadrant D | 4,297,927 | 374,540 |
| Mode SS | |||
|---|---|---|---|
| Quadrant | BADHDUFLAG | Total packets | Discarded packets |
| A | 0 | 139 | 1 |
| B | 0 | 140 | 2 |
| C | 0 | 140 | 2 |
| D | 0 | 140 | 0 |
| Mode M9 | |||
|---|---|---|---|
| Quadrant | BADHDUFLAG | Total packets | Discarded packets |
| A | 0 | 14 | 0 |
| B | 0 | 14 | 0 |
| C | 0 | 14 | 0 |
| D | 0 | 14 | 0 |
| Mode M0 | |||
|---|---|---|---|
| Quadrant | BADHDUFLAG | Total packets | Discarded packets |
| A | 0 | 14114 | 169 |
| B | 0 | 22877 | 1211 |
| C | 0 | 18525 | 308 |
| D | 0 | 17488 | 256 |
| Quadrant | Total seconds | Saturated seconds | Saturation percentage |
|---|---|---|---|
| A | 6777 | 49 | 0.723034% |
| B | 6676 | 255 | 3.819652% |
| C | 6756 | 244 | 3.611604% |
| D | 6761 | 97 | 1.434699% |
Noise dominated data is calculated using 1-second bins in cleaned event files. If a bin has >2000 counts, and if more than 50% of those come from <1% of pixels, then it is considered to be noise-dominated and hence unusable.
| Quadrant | # 1 sec bins | Bins with >0 counts | Bins with >2000 counts | High rate bins dominated by noise | Noise dominated (total time) | Noise dominated (detector-on time) | Marked lightcurve |
|---|---|---|---|---|---|---|---|
| A | 7835 | 6826 | 2 | 2 | 0.03% | 0.03% |  |
| B | 7835 | 6731 | 119 | 119 | 1.52% | 1.77% | 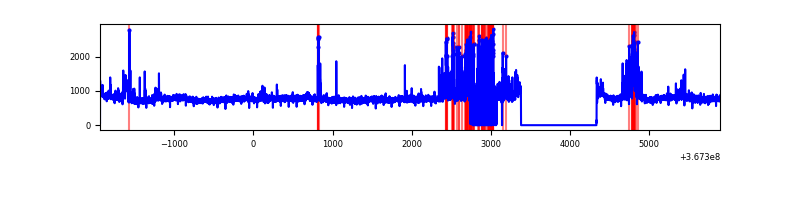 |
| C | 7835 | 6824 | 45 | 45 | 0.57% | 0.66% | 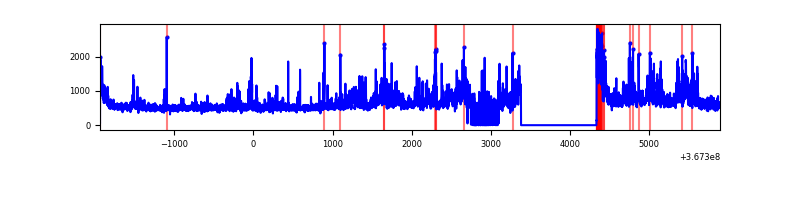 |
| D | 7835 | 6820 | 51 | 51 | 0.65% | 0.75% | 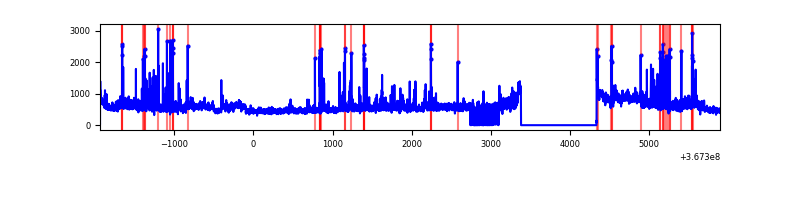 |
Top three noisy pixels from each quadrant. If the there are fewer than three noisy pixels in the level2.evt file, extra rows are filled as -1
| Pixel properties | Quadrant properties | ||||||
|---|---|---|---|---|---|---|---|
| Quadrant | DetID | PixID | Counts | Sigma | Mean | Median | Sigma |
| A | 15 | 174 | 12405 | 67.01 | 856 | 838 | 172.6 |
| A | 13 | 254 | 9482 | 50.07 | 856 | 838 | 172.6 |
| A | 3 | 137 | 8870 | 46.53 | 856 | 838 | 172.6 |
| B | 6 | 159 | 1762889 | 10960.42 | 831 | 808 | 160.8 |
| B | 10 | 245 | 594963 | 3695.73 | 831 | 808 | 160.8 |
| B | 12 | 111 | 20312 | 121.31 | 831 | 808 | 160.8 |
| C | 0 | 10 | 666433 | 3528.32 | 804 | 809 | 188.7 |
| C | 3 | 233 | 639310 | 3384.54 | 804 | 809 | 188.7 |
| C | 14 | 238 | 133284 | 702.22 | 804 | 809 | 188.7 |
| D | 8 | 195 | 784068 | 3989.47 | 817 | 793 | 196.3 |
| D | 2 | 250 | 229014 | 1162.4 | 817 | 793 | 196.3 |
| D | 12 | 233 | 97650 | 493.32 | 817 | 793 | 196.3 |
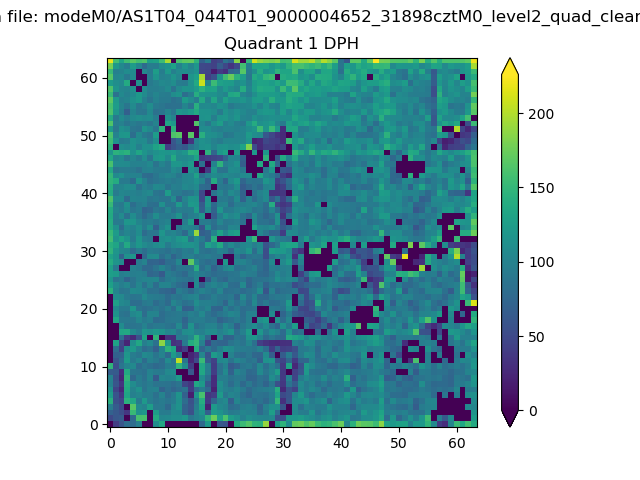
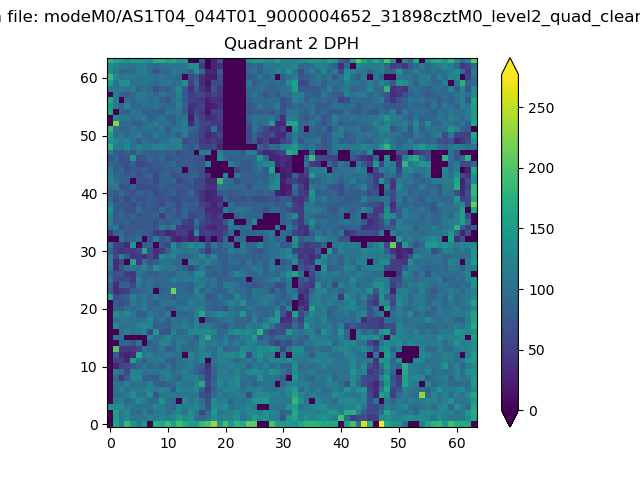
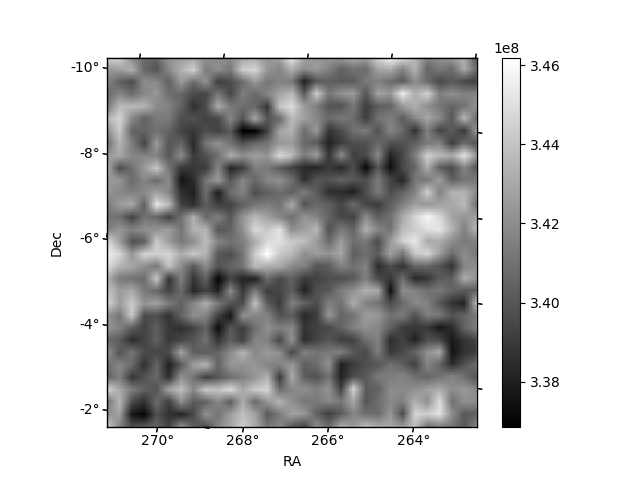
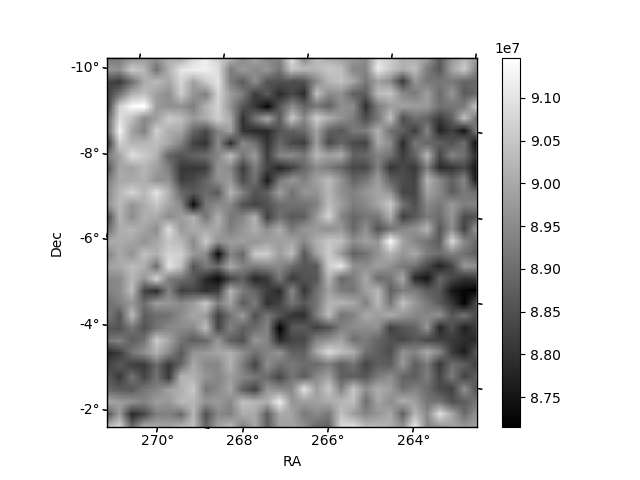
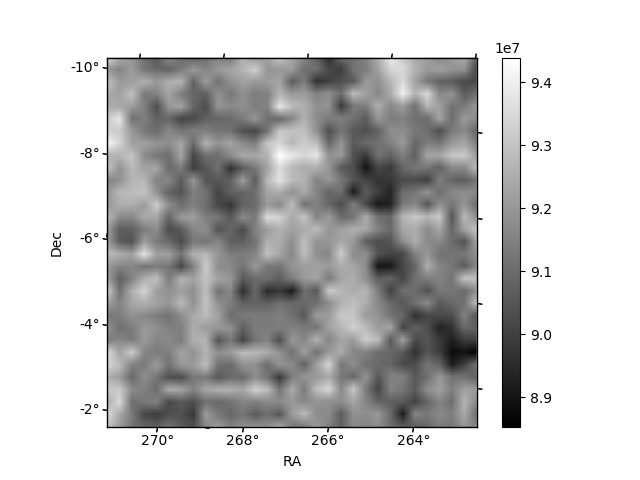
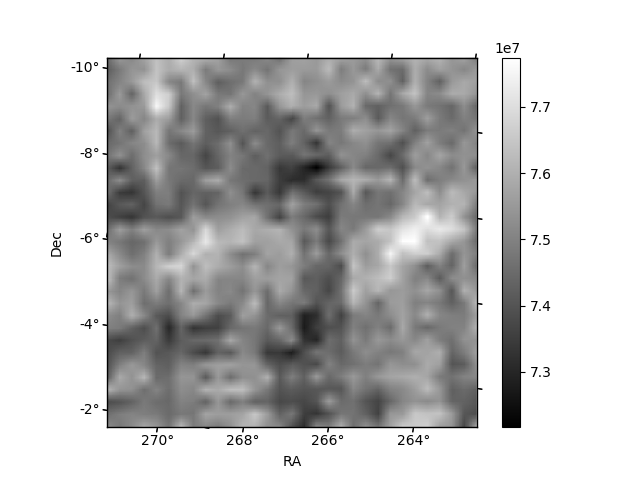
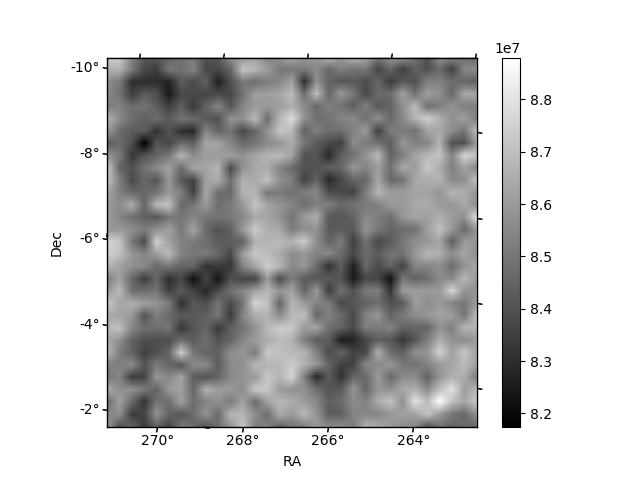
Histogram calculated using DETX and DETY for each event in the final _common_clean file
| Quadrant A | 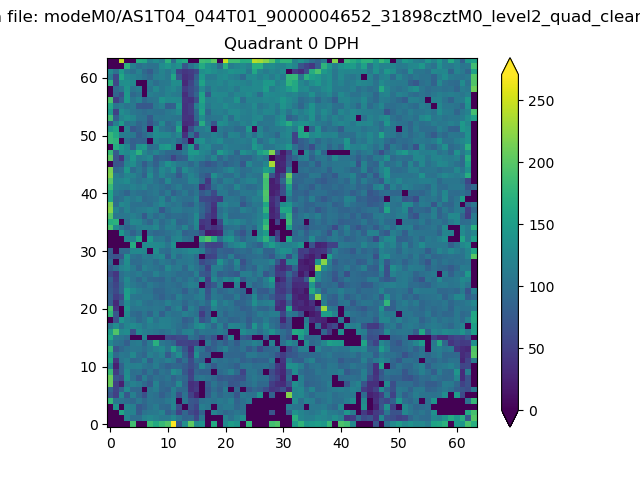 |
 |
Quadrant B |
|---|---|---|---|
| Quadrant D | 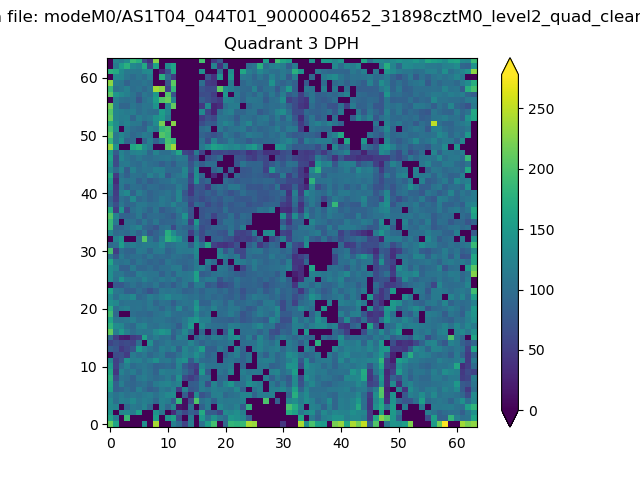 |
 |
Quadrant C |
| Plot type | Count rate plots | Images |
|---|---|---|
| Comparison with Poisson distribution Blue bars denote a histogram of data divided into 1 sec bins. Red curve is a Poisson curve with rate = median count rate of data. |
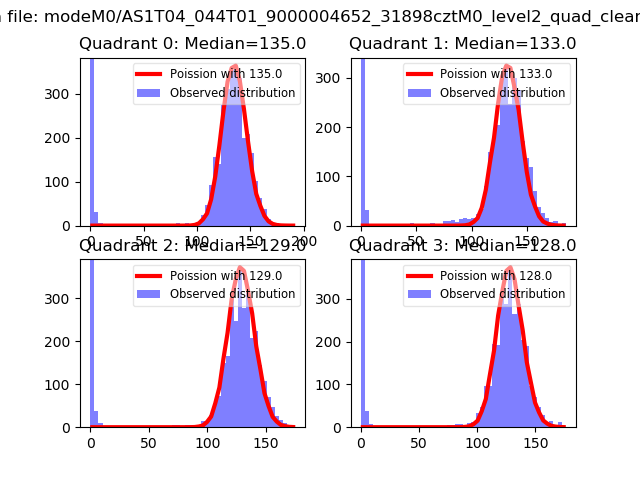 |
 |
| Quadrant-wise count rates Data is divided into 100 sec bins |
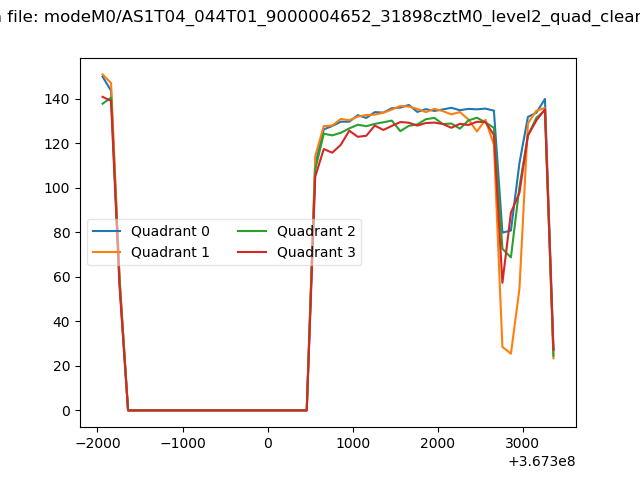 |
|
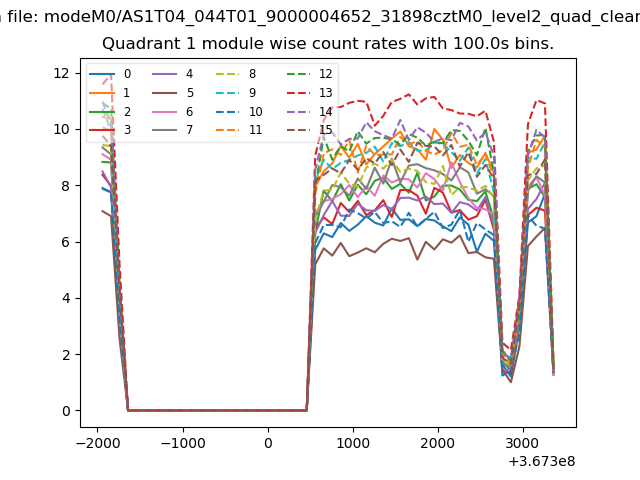
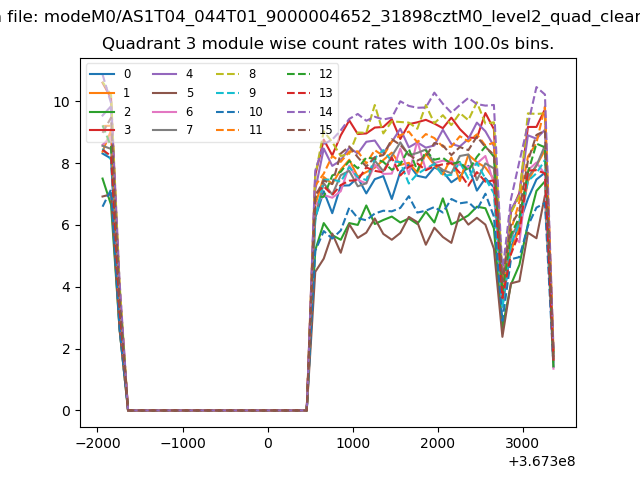
| Module-wise count rates for Quadrant A Data is divided into 100 sec bins |
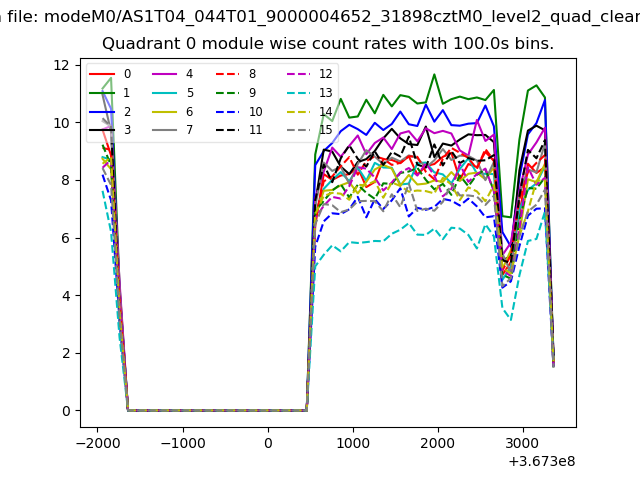 |
 |
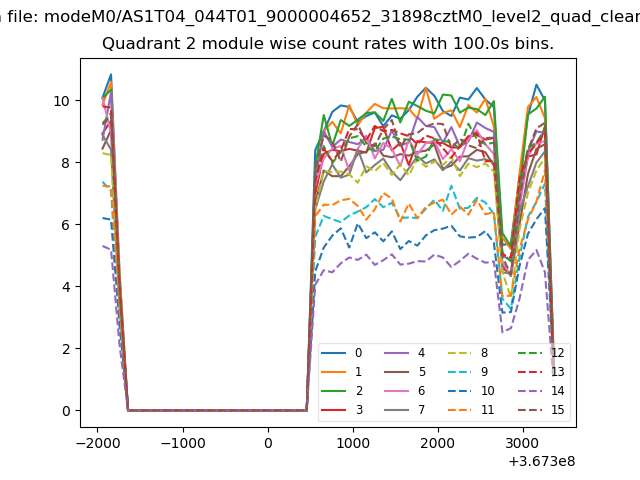
| Module-wise count rates for Quadrant B Data is divided into 100 sec bins |
 |
 |
| Module-wise count rates for Quadrant C Data is divided into 100 sec bins |
 |
 |
| Module-wise count rates for Quadrant D Data is divided into 100 sec bins |
 |
 |
| Parameter | Plot |
|---|---|
| CZT HV Monitor | 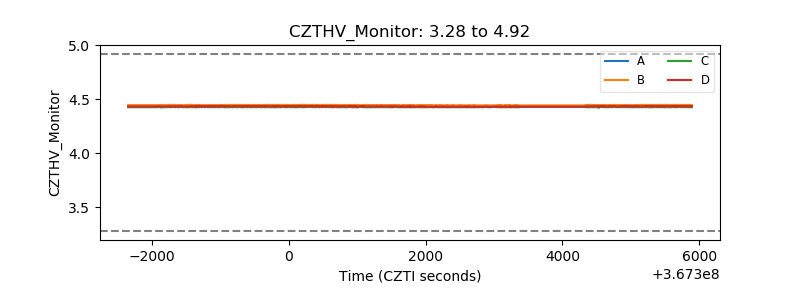 |
| D_VDD | 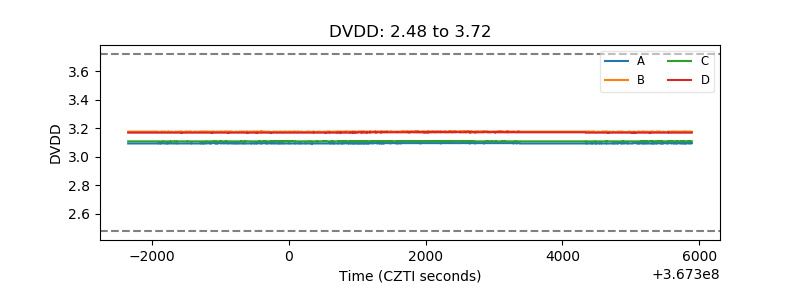 |
| Temperature 1 | 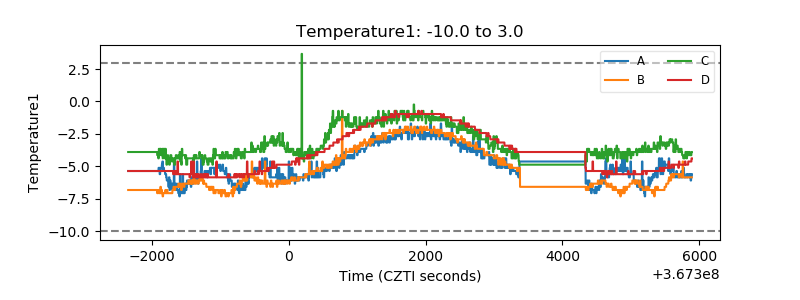 |
| Veto HV Monitor | 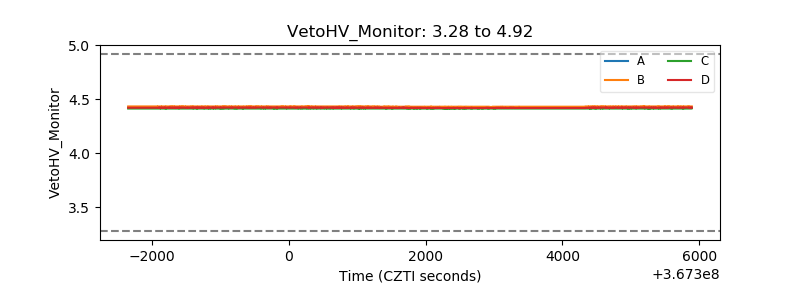 |
| Veto LLD | 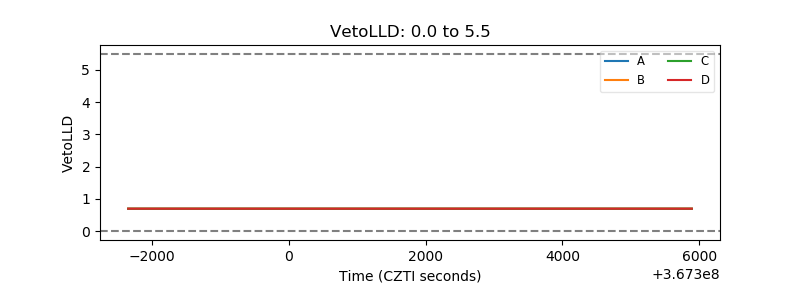 |
| Alpha Counter | 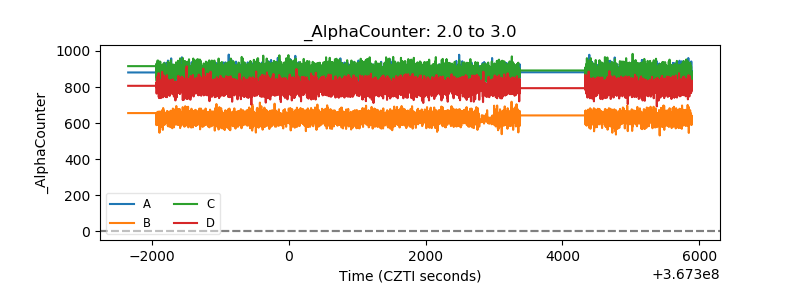 |
| _CPM_Rate | 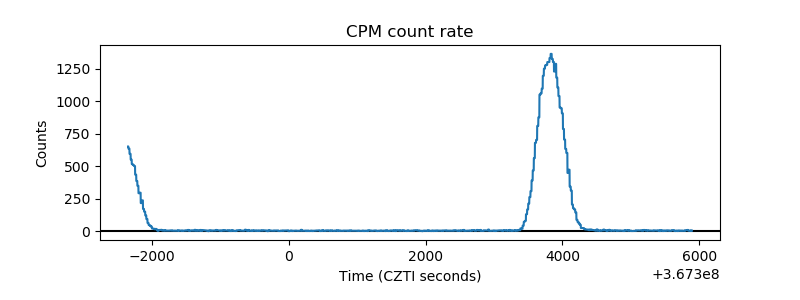 |
| CZT Counter | 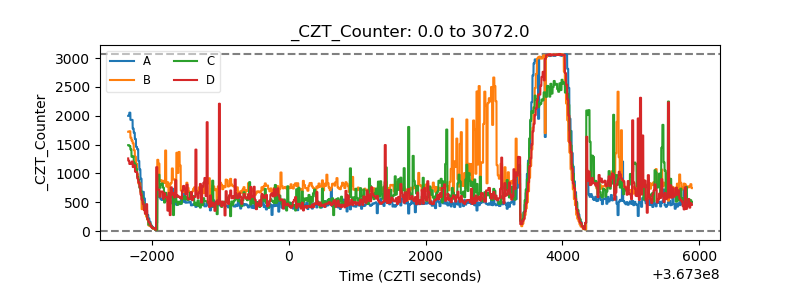 |
| +2.5 Volts monitor |  |
| +5 Volts monitor |  |
| _ROLL_ROT | 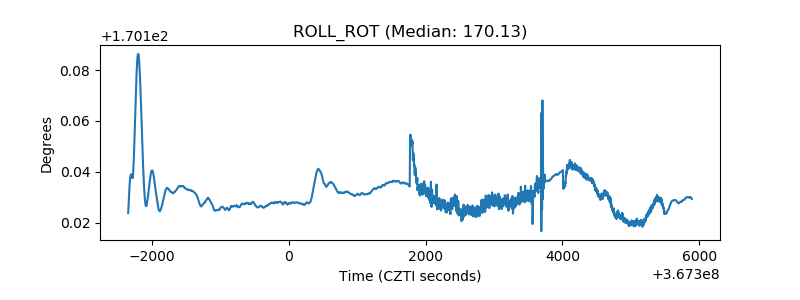 |
| _Roll_DEC | 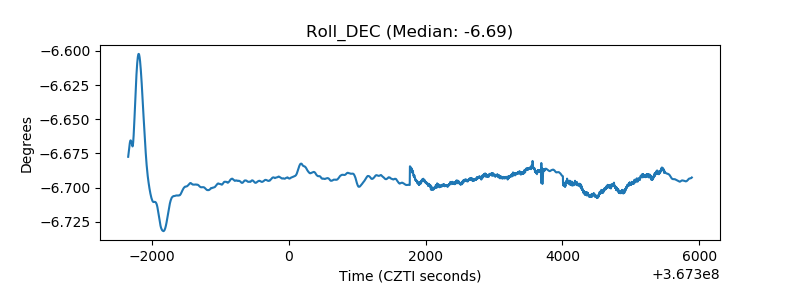 |
| _Roll_RA | 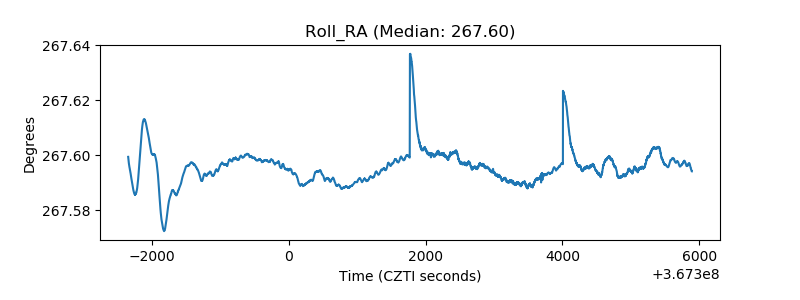 |
| Veto Counter | 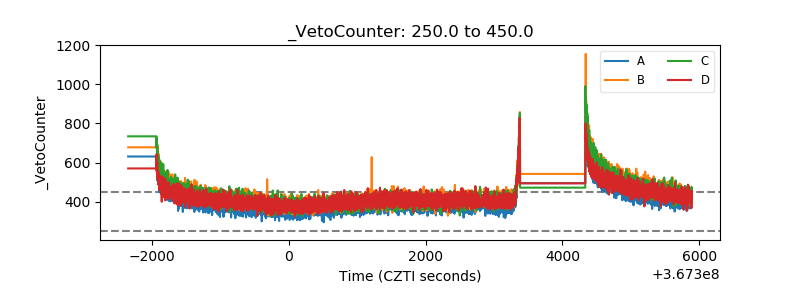 |