| Param | Original file | Final file |
|---|---|---|
| Filename | modeM0/AS1T04_044T01_9000004652_31900cztM0_level2.evt | modeM0/AS1T04_044T01_9000004652_31900cztM0_level2_quad_clean.evt |
| Size (bytes) | 709,341,120 | 68,437,440 |
| Size | 676.5 MB | 65.3 MB |
| Events in quadrant A | 3,376,625 | 425,718 |
| Events in quadrant B | 7,072,728 | 395,267 |
| Events in quadrant C | 6,220,255 | 394,096 |
| Events in quadrant D | 4,370,229 | 398,896 |
| Mode SS | |||
|---|---|---|---|
| Quadrant | BADHDUFLAG | Total packets | Discarded packets |
| A | 0 | 134 | 0 |
| B | 0 | 134 | 0 |
| C | 0 | 134 | 0 |
| D | 0 | 134 | 0 |
| Mode M9 | |||
|---|---|---|---|
| Quadrant | BADHDUFLAG | Total packets | Discarded packets |
| A | 0 | 14 | 0 |
| B | 0 | 15 | 0 |
| C | 0 | 14 | 0 |
| D | 0 | 15 | 0 |
| Mode M0 | |||
|---|---|---|---|
| Quadrant | BADHDUFLAG | Total packets | Discarded packets |
| A | 0 | 13930 | 3 |
| B | 0 | 25541 | 2 |
| C | 0 | 23229 | 2 |
| D | 0 | 17323 | 2 |
| Quadrant | Total seconds | Saturated seconds | Saturation percentage |
|---|---|---|---|
| A | 6560 | 43 | 0.655488% |
| B | 6561 | 890 | 13.565005% |
| C | 6561 | 624 | 9.510745% |
| D | 6561 | 74 | 1.127877% |
Noise dominated data is calculated using 1-second bins in cleaned event files. If a bin has >2000 counts, and if more than 50% of those come from <1% of pixels, then it is considered to be noise-dominated and hence unusable.
| Quadrant | # 1 sec bins | Bins with >0 counts | Bins with >2000 counts | High rate bins dominated by noise | Noise dominated (total time) | Noise dominated (detector-on time) | Marked lightcurve |
|---|---|---|---|---|---|---|---|
| A | 7666 | 6562 | 0 | 0 | 0.00% | 0.00% | 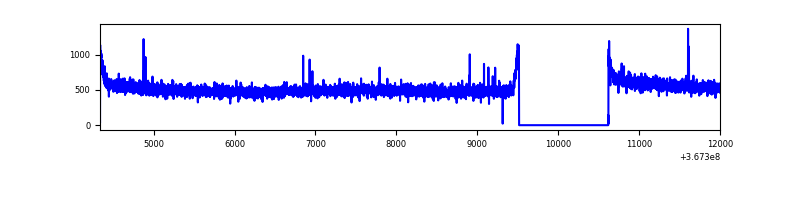 |
| B | 7666 | 6562 | 562 | 562 | 7.33% | 8.56% | 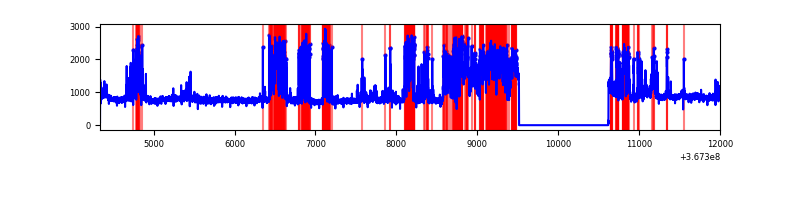 |
| C | 7666 | 6562 | 251 | 251 | 3.27% | 3.83% | 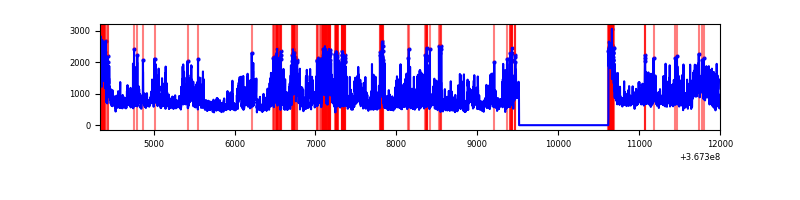 |
| D | 7666 | 6562 | 34 | 34 | 0.44% | 0.52% | 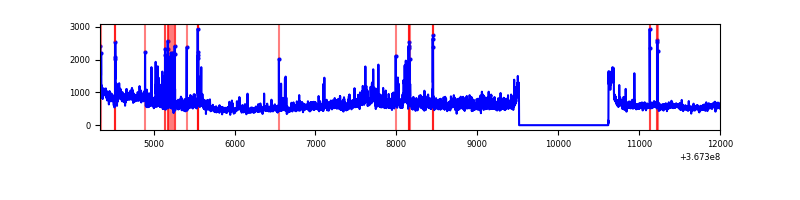 |
Top three noisy pixels from each quadrant. If the there are fewer than three noisy pixels in the level2.evt file, extra rows are filled as -1
| Pixel properties | Quadrant properties | ||||||
|---|---|---|---|---|---|---|---|
| Quadrant | DetID | PixID | Counts | Sigma | Mean | Median | Sigma |
| A | 12 | 96 | 10601 | 56.21 | 871 | 855 | 173.4 |
| A | 13 | 254 | 9876 | 52.03 | 871 | 855 | 173.4 |
| A | 3 | 137 | 8885 | 46.31 | 871 | 855 | 173.4 |
| B | 10 | 245 | 2096412 | 13134.61 | 835 | 815 | 159.5 |
| B | 6 | 159 | 1667215 | 10444.52 | 835 | 815 | 159.5 |
| B | 0 | 213 | 24427 | 147.99 | 835 | 815 | 159.5 |
| C | 3 | 233 | 2287624 | 12332.75 | 799 | 805 | 185.4 |
| C | 0 | 10 | 644097 | 3469.26 | 799 | 805 | 185.4 |
| C | 14 | 238 | 134366 | 720.29 | 799 | 805 | 185.4 |
| D | 8 | 195 | 883331 | 4506.98 | 829 | 808 | 195.8 |
| D | 2 | 250 | 134883 | 684.71 | 829 | 808 | 195.8 |
| D | 1 | 52 | 102646 | 520.08 | 829 | 808 | 195.8 |
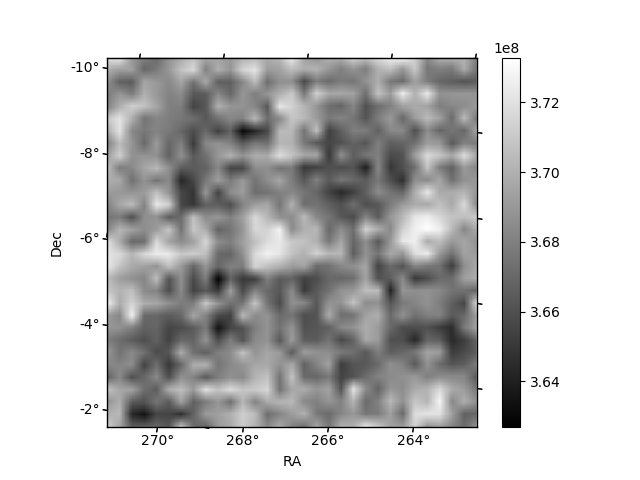
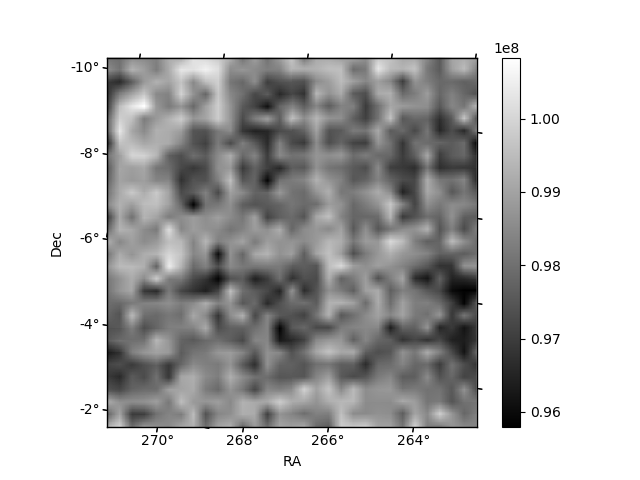
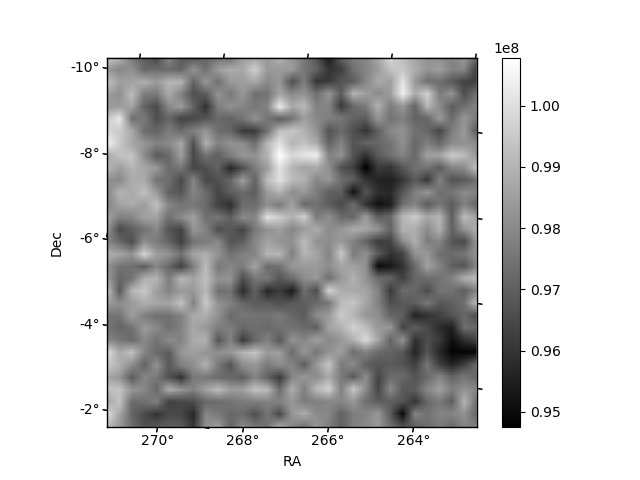
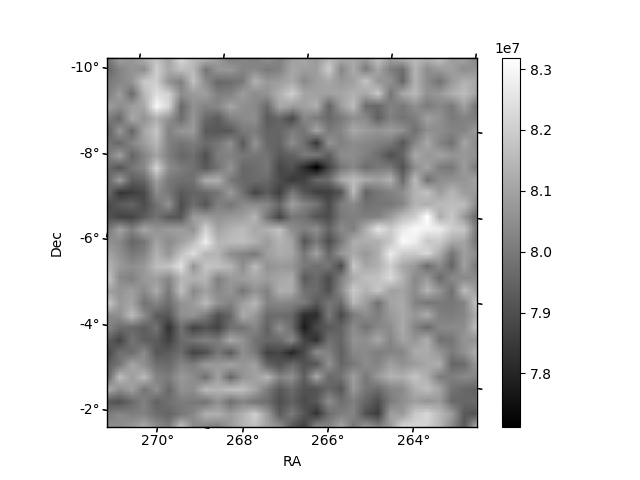
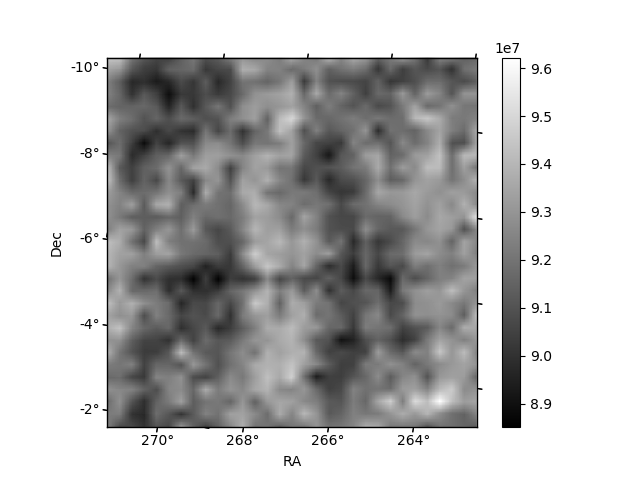
Histogram calculated using DETX and DETY for each event in the final _common_clean file
| Quadrant A | 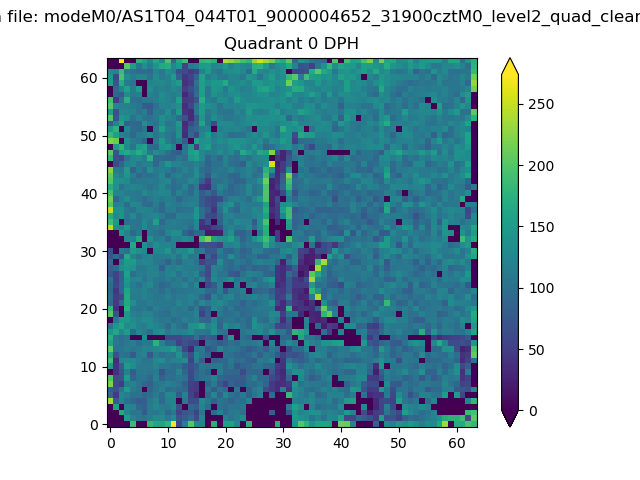 |
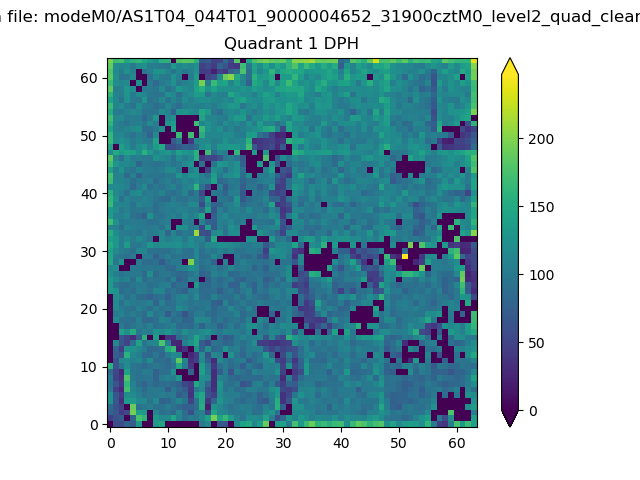 |
Quadrant B |
|---|---|---|---|
| Quadrant D | 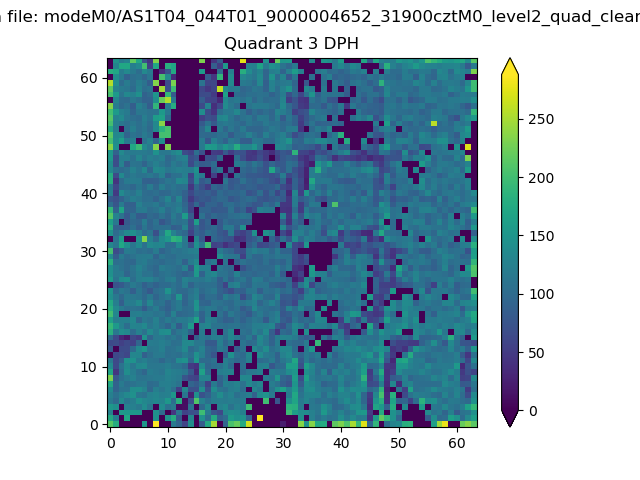 |
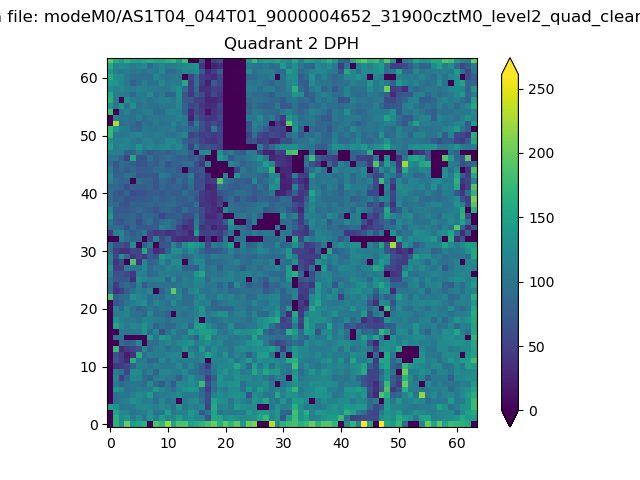 |
Quadrant C |
| Plot type | Count rate plots | Images |
|---|---|---|
| Comparison with Poisson distribution Blue bars denote a histogram of data divided into 1 sec bins. Red curve is a Poisson curve with rate = median count rate of data. |
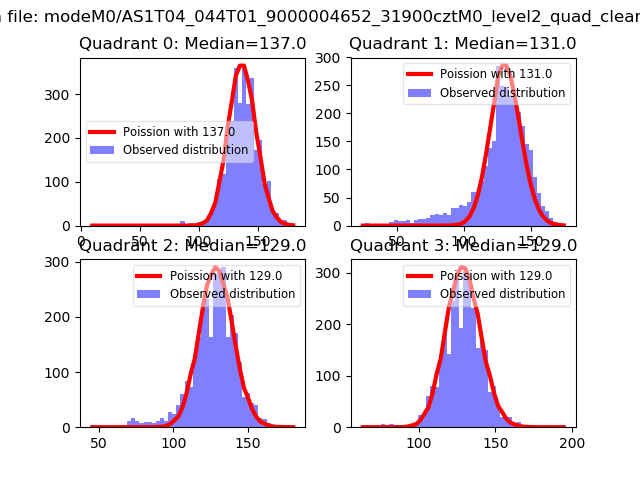 |
 |
| Quadrant-wise count rates Data is divided into 100 sec bins |
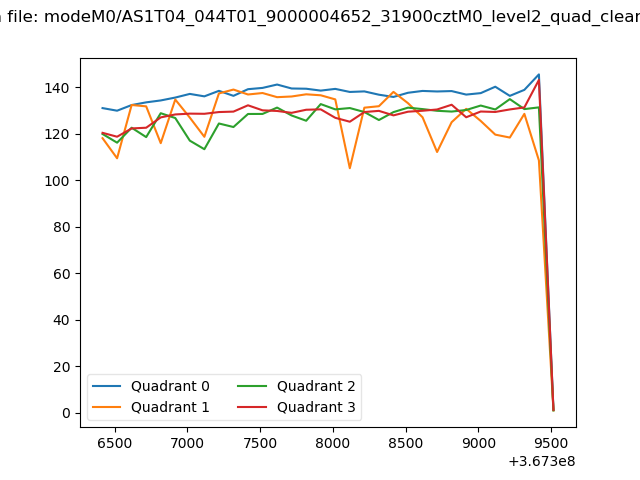 |
|
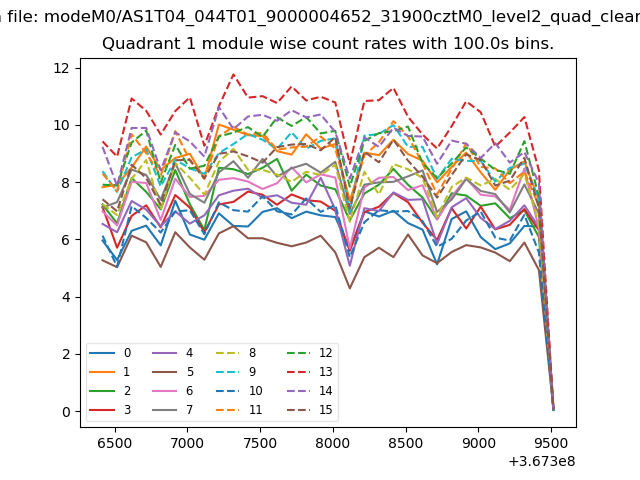
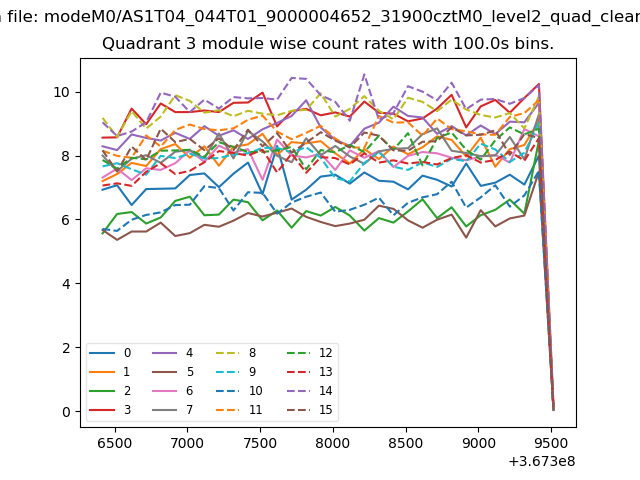
| Module-wise count rates for Quadrant A Data is divided into 100 sec bins |
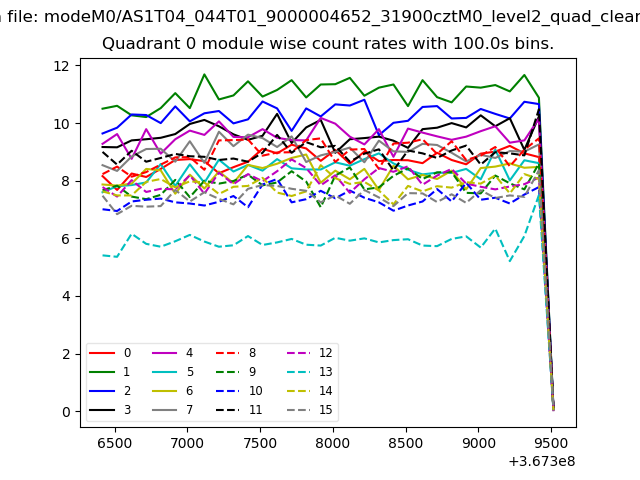 |
 |
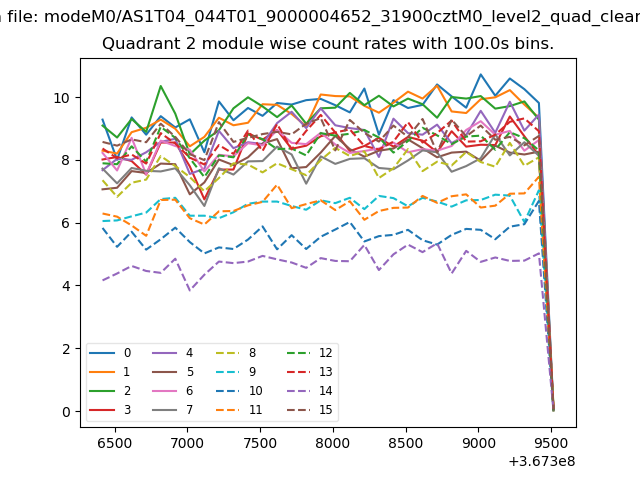
| Module-wise count rates for Quadrant B Data is divided into 100 sec bins |
 |
 |
| Module-wise count rates for Quadrant C Data is divided into 100 sec bins |
 |
 |
| Module-wise count rates for Quadrant D Data is divided into 100 sec bins |
 |
 |
| Parameter | Plot |
|---|---|
| CZT HV Monitor |  |
| D_VDD | 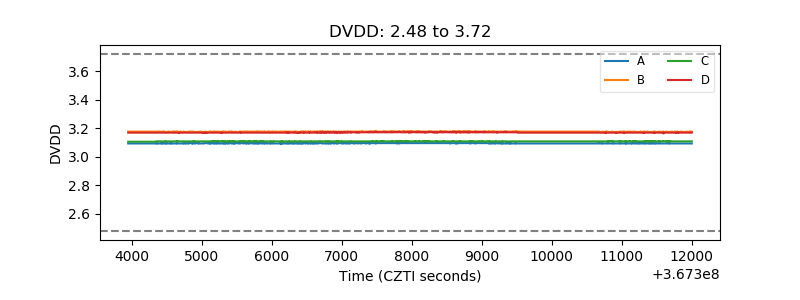 |
| Temperature 1 | 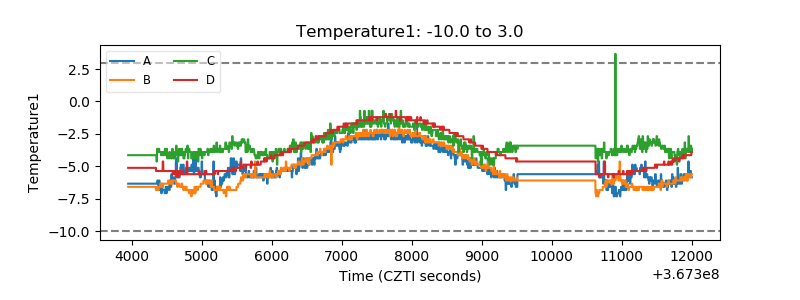 |
| Veto HV Monitor | 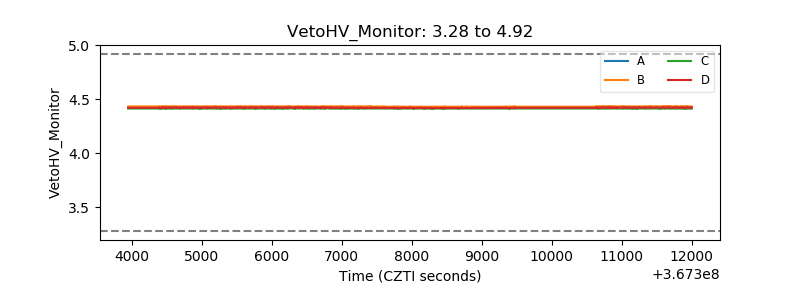 |
| Veto LLD | 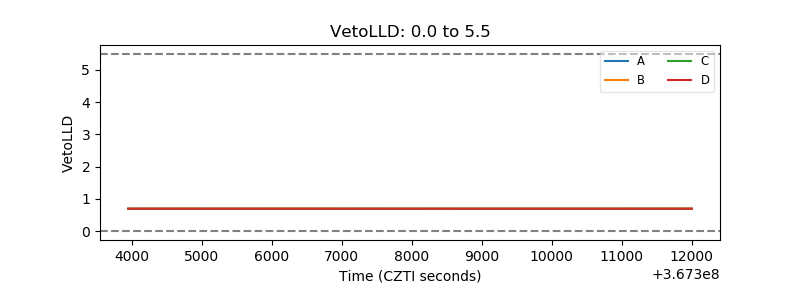 |
| Alpha Counter | 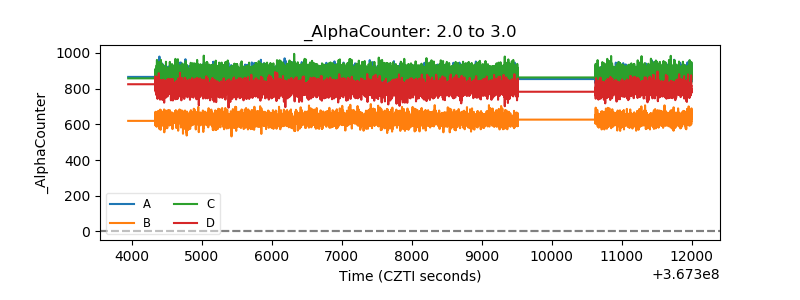 |
| _CPM_Rate | 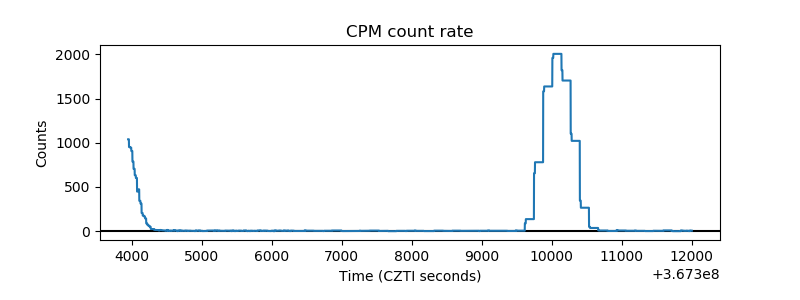 |
| CZT Counter | 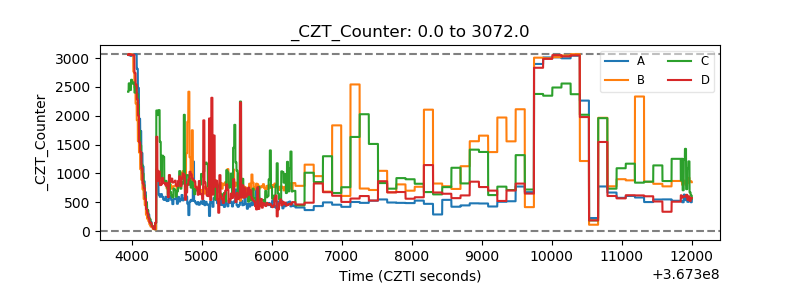 |
| +2.5 Volts monitor |  |
| +5 Volts monitor |  |
| _ROLL_ROT | 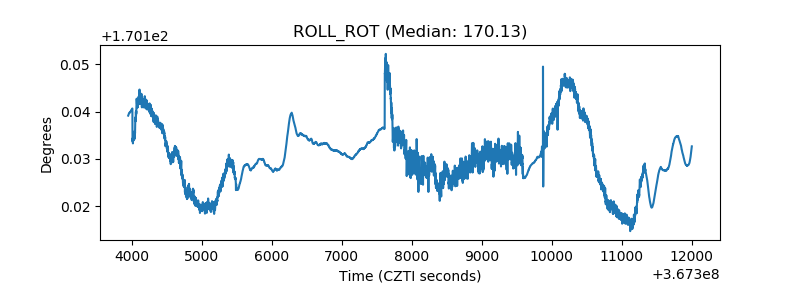 |
| _Roll_DEC | 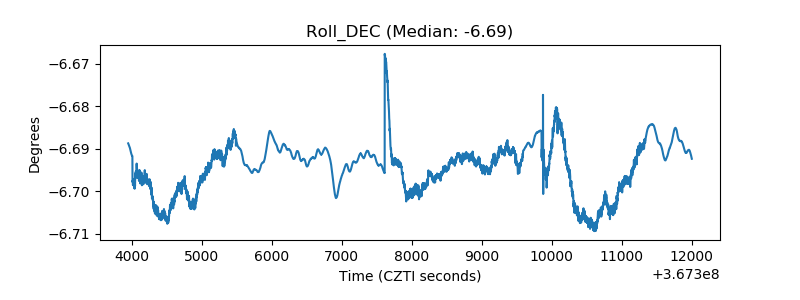 |
| _Roll_RA |  |
| Veto Counter | 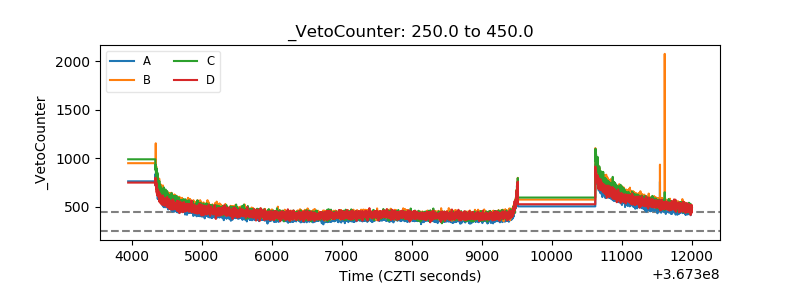 |