| Param | Original file | Final file |
|---|---|---|
| Filename | modeM0/AS1T04_044T01_9000004652_31901cztM0_level2.evt | modeM0/AS1T04_044T01_9000004652_31901cztM0_level2_quad_clean.evt |
| Size (bytes) | 488,805,120 | 66,651,840 |
| Size | 466.2 MB | 63.6 MB |
| Events in quadrant A | 2,466,716 | 445,329 |
| Events in quadrant B | 4,009,885 | 446,892 |
| Events in quadrant C | 4,954,799 | 374,666 |
| Events in quadrant D | 3,050,801 | 417,975 |
| Mode SS | |||
|---|---|---|---|
| Quadrant | BADHDUFLAG | Total packets | Discarded packets |
| A | 0 | 96 | 0 |
| B | 0 | 96 | 0 |
| C | 0 | 96 | 0 |
| D | 0 | 96 | 0 |
| Mode M9 | |||
|---|---|---|---|
| Quadrant | BADHDUFLAG | Total packets | Discarded packets |
| A | 0 | 3 | 0 |
| B | 0 | 4 | 0 |
| C | 0 | 4 | 0 |
| D | 0 | 4 | 0 |
| Mode M0 | |||
|---|---|---|---|
| Quadrant | BADHDUFLAG | Total packets | Discarded packets |
| A | 0 | 10041 | 1 |
| B | 0 | 15260 | 1 |
| C | 0 | 18116 | 1 |
| D | 0 | 12291 | 1 |
| Quadrant | Total seconds | Saturated seconds | Saturation percentage |
|---|---|---|---|
| A | 4738 | 17 | 0.358801% |
| B | 4738 | 205 | 4.326720% |
| C | 4738 | 839 | 17.707894% |
| D | 4738 | 35 | 0.738708% |
Noise dominated data is calculated using 1-second bins in cleaned event files. If a bin has >2000 counts, and if more than 50% of those come from <1% of pixels, then it is considered to be noise-dominated and hence unusable.
| Quadrant | # 1 sec bins | Bins with >0 counts | Bins with >2000 counts | High rate bins dominated by noise | Noise dominated (total time) | Noise dominated (detector-on time) | Marked lightcurve |
|---|---|---|---|---|---|---|---|
| A | 4738 | 4738 | 2 | 2 | 0.04% | 0.04% | 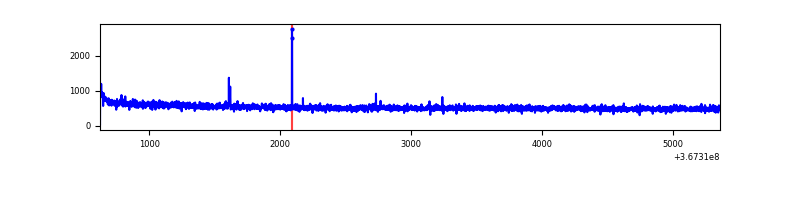 |
| B | 4738 | 4738 | 79 | 79 | 1.67% | 1.67% | 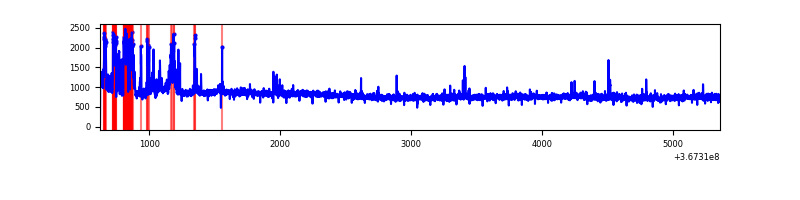 |
| C | 4738 | 4738 | 600 | 600 | 12.66% | 12.66% | 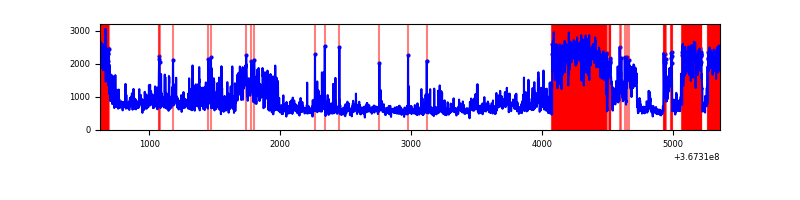 |
| D | 4738 | 4738 | 14 | 14 | 0.30% | 0.30% | 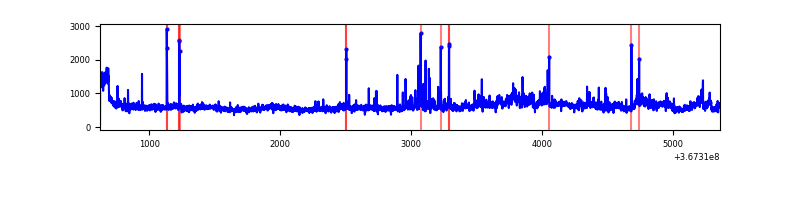 |
Top three noisy pixels from each quadrant. If the there are fewer than three noisy pixels in the level2.evt file, extra rows are filled as -1
| Pixel properties | Quadrant properties | ||||||
|---|---|---|---|---|---|---|---|
| Quadrant | DetID | PixID | Counts | Sigma | Mean | Median | Sigma |
| A | 12 | 96 | 13412 | 101.33 | 633 | 623 | 126.2 |
| A | 13 | 6 | 11764 | 88.27 | 633 | 623 | 126.2 |
| A | 13 | 254 | 6950 | 50.13 | 633 | 623 | 126.2 |
| B | 6 | 159 | 1231444 | 10407.3 | 619 | 606 | 118.3 |
| B | 10 | 245 | 321777 | 2715.65 | 619 | 606 | 118.3 |
| B | 12 | 111 | 13978 | 113.07 | 619 | 606 | 118.3 |
| C | 3 | 233 | 2296639 | 18007.69 | 550 | 553 | 127.5 |
| C | 0 | 10 | 394690 | 3091.13 | 550 | 553 | 127.5 |
| C | 14 | 238 | 91532 | 713.53 | 550 | 553 | 127.5 |
| D | 8 | 195 | 494877 | 3484.16 | 603 | 589 | 141.9 |
| D | 13 | 174 | 93577 | 655.46 | 603 | 589 | 141.9 |
| D | 12 | 233 | 53943 | 376.08 | 603 | 589 | 141.9 |
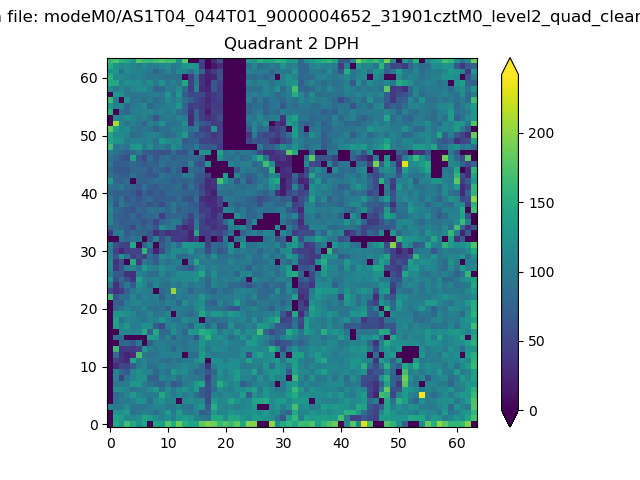
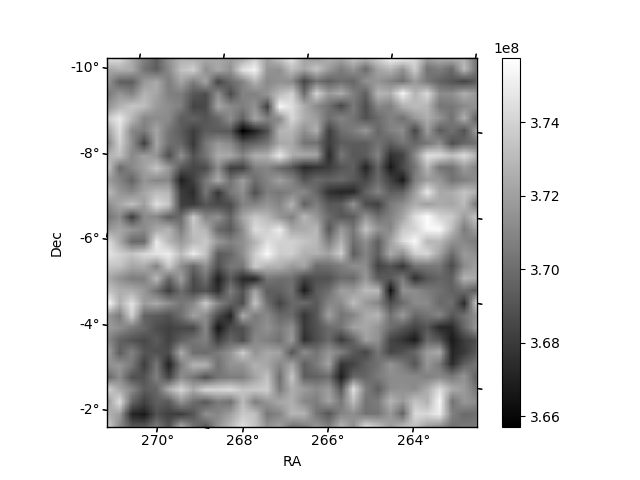
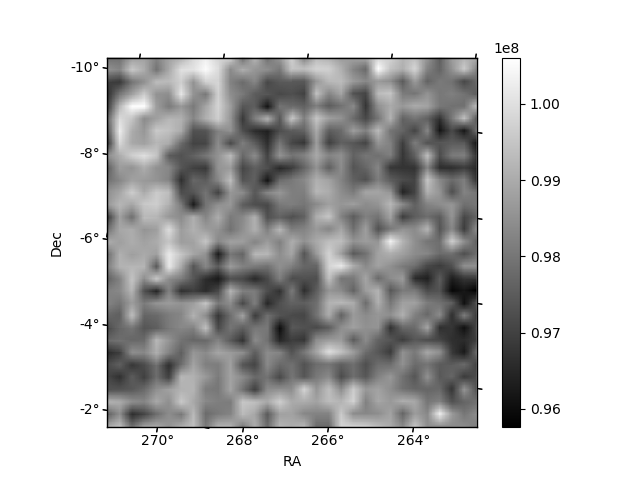
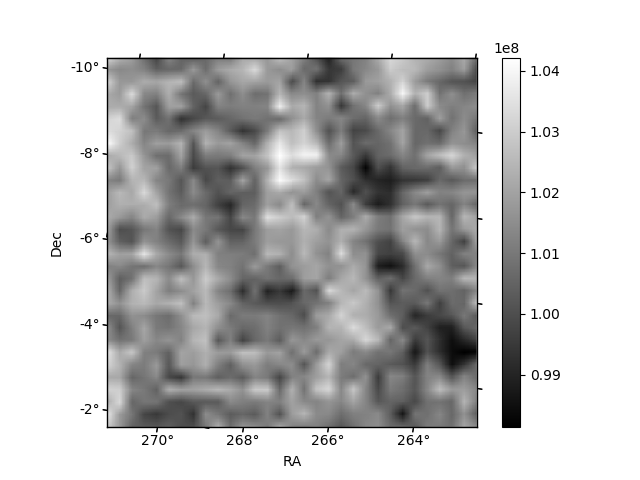
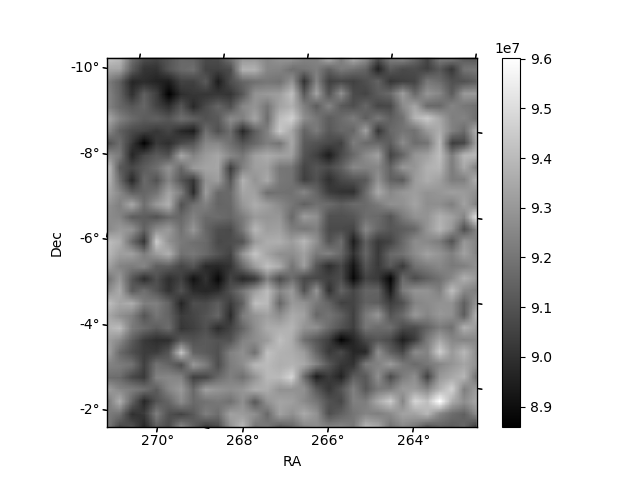
Histogram calculated using DETX and DETY for each event in the final _common_clean file
| Quadrant A | 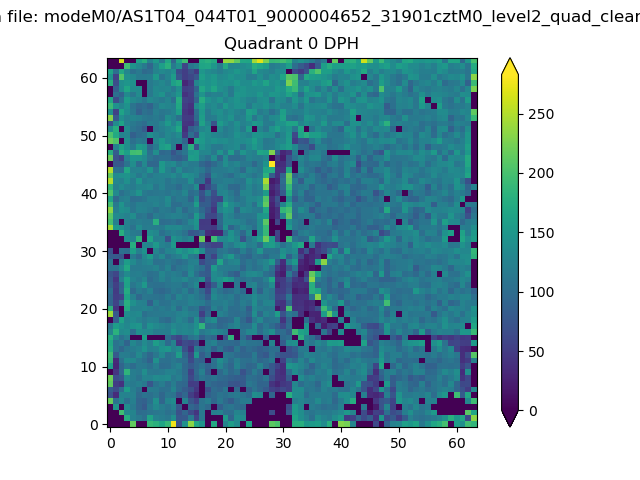 |
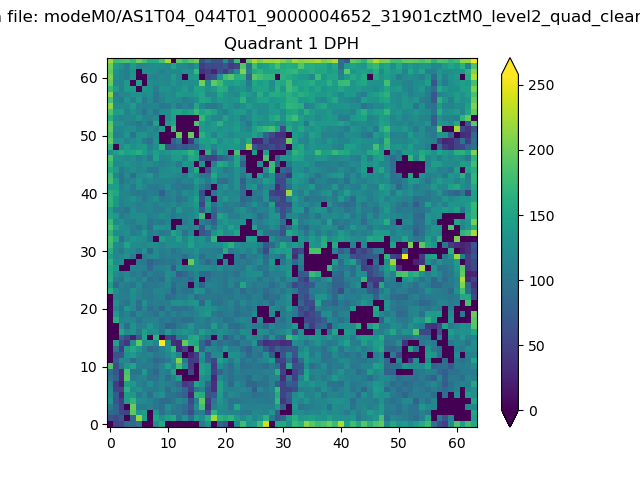 |
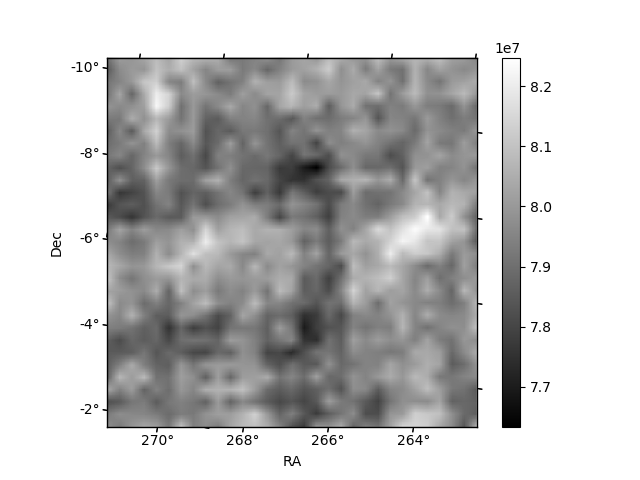
Quadrant B |
|---|---|---|---|
| Quadrant D | 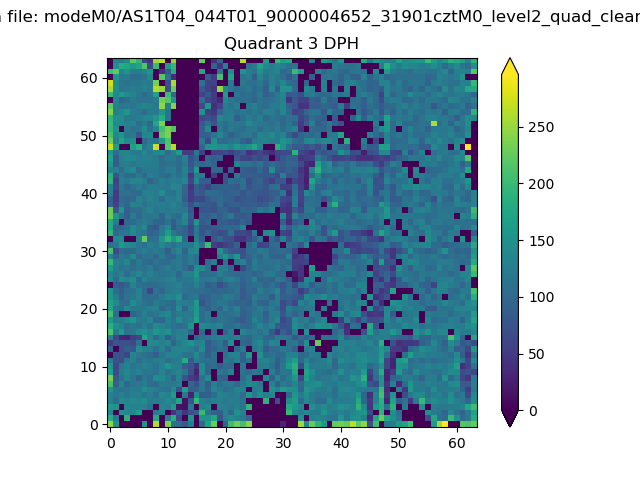 |
 |
Quadrant C |
| Plot type | Count rate plots | Images |
|---|---|---|
| Comparison with Poisson distribution Blue bars denote a histogram of data divided into 1 sec bins. Red curve is a Poisson curve with rate = median count rate of data. |
 |
 |
| Quadrant-wise count rates Data is divided into 100 sec bins |
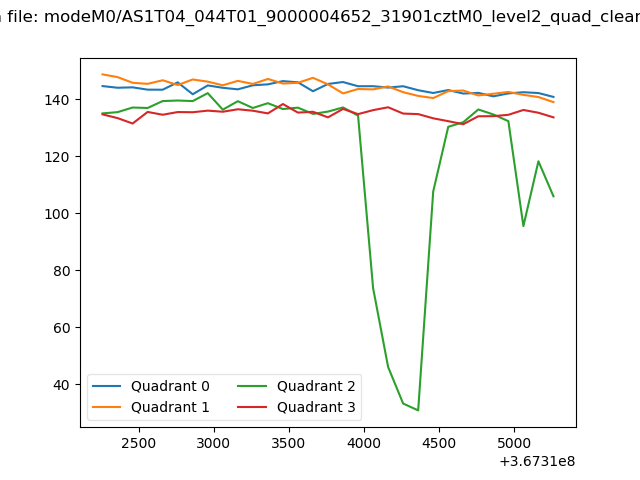 |
|
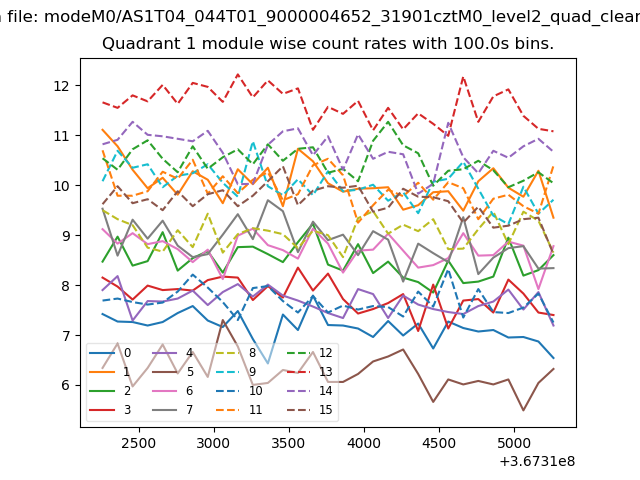
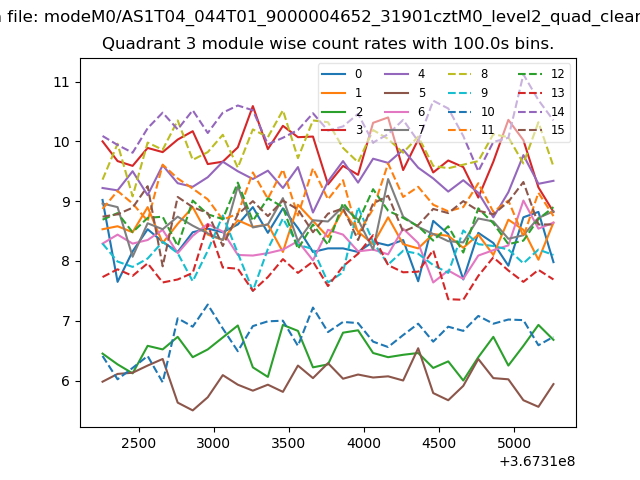
| Module-wise count rates for Quadrant A Data is divided into 100 sec bins |
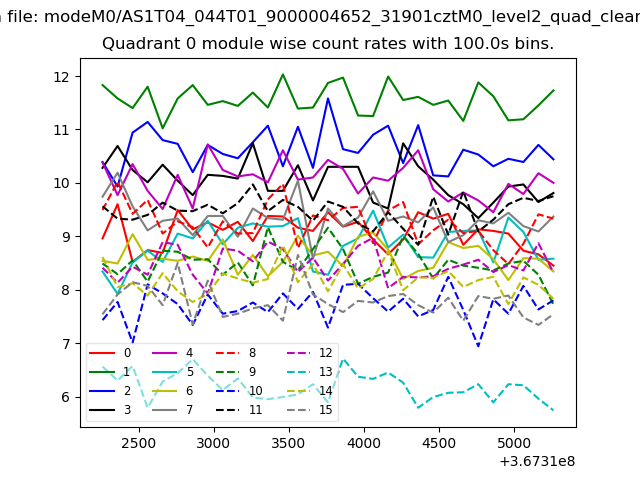 |
 |
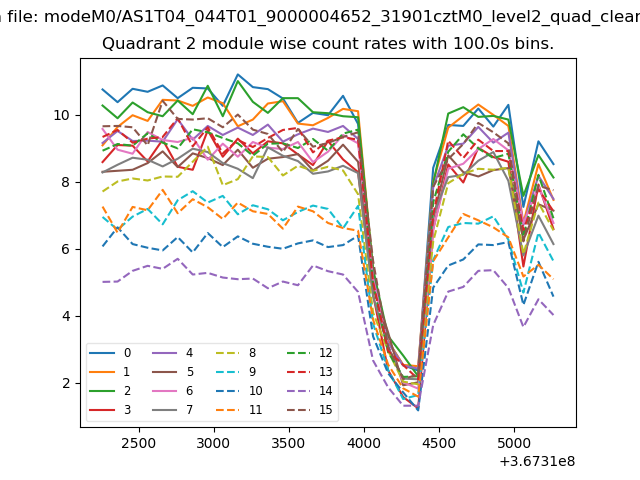
| Module-wise count rates for Quadrant B Data is divided into 100 sec bins |
 |
 |
| Module-wise count rates for Quadrant C Data is divided into 100 sec bins |
 |
 |
| Module-wise count rates for Quadrant D Data is divided into 100 sec bins |
 |
 |
| Parameter | Plot |
|---|---|
| CZT HV Monitor | 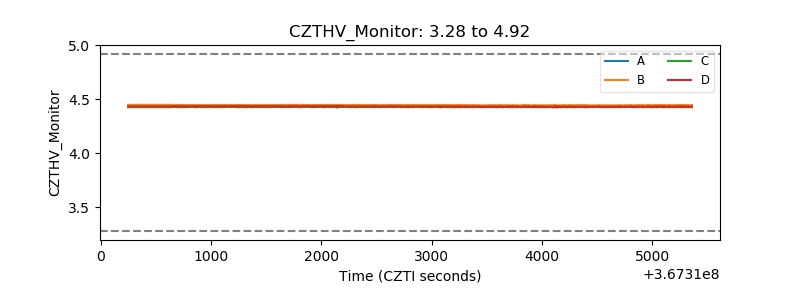 |
| D_VDD | 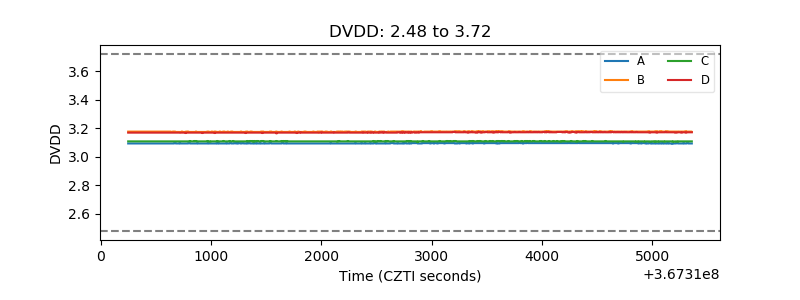 |
| Temperature 1 | 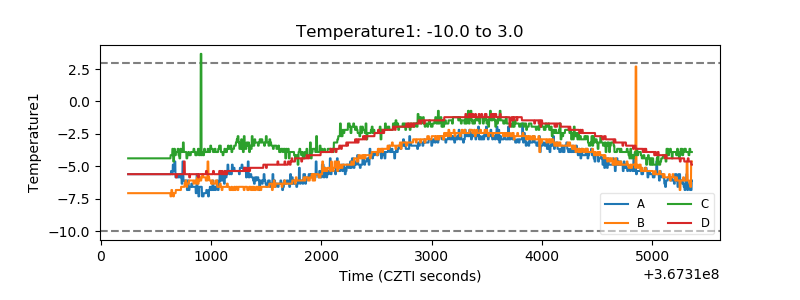 |
| Veto HV Monitor | 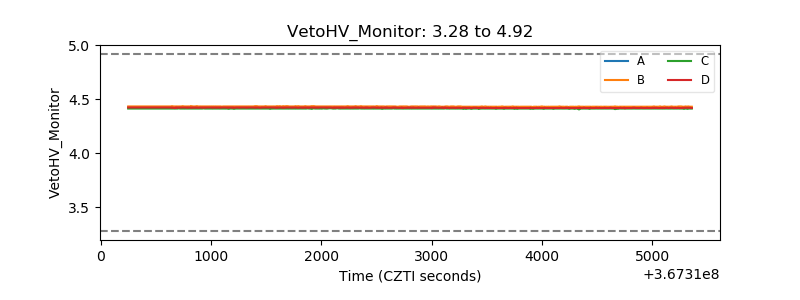 |
| Veto LLD | 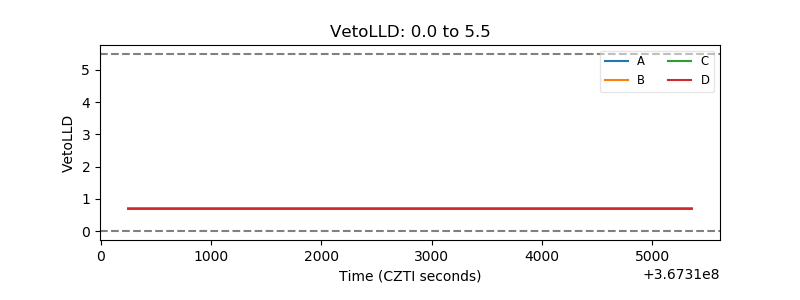 |
| Alpha Counter | 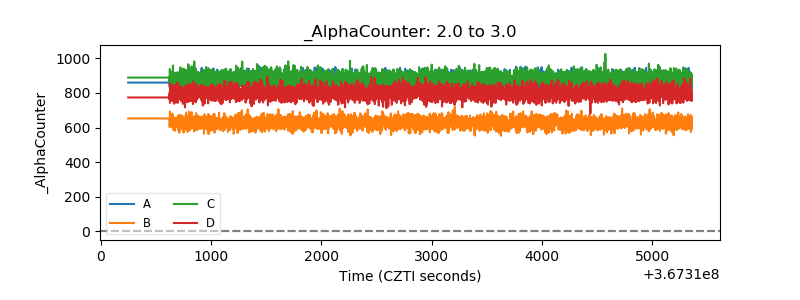 |
| _CPM_Rate | 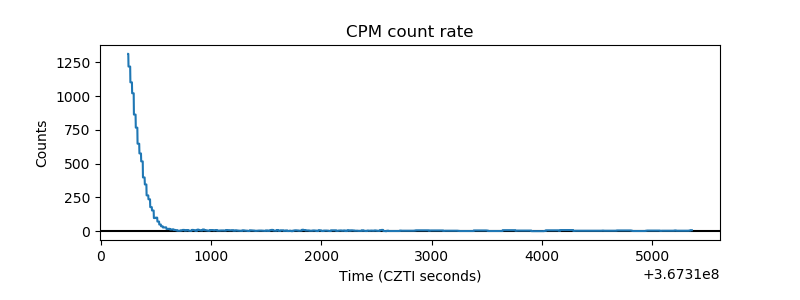 |
| CZT Counter | 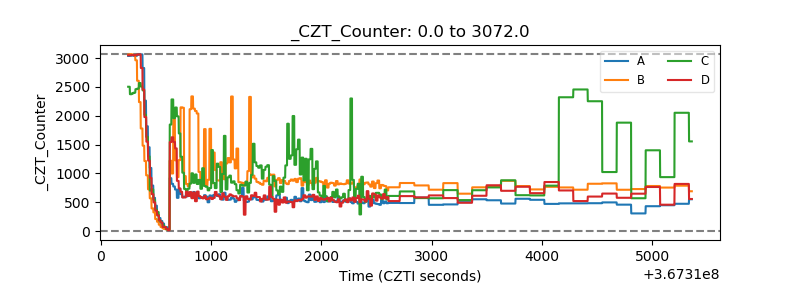 |
| +2.5 Volts monitor |  |
| +5 Volts monitor |  |
| _ROLL_ROT | 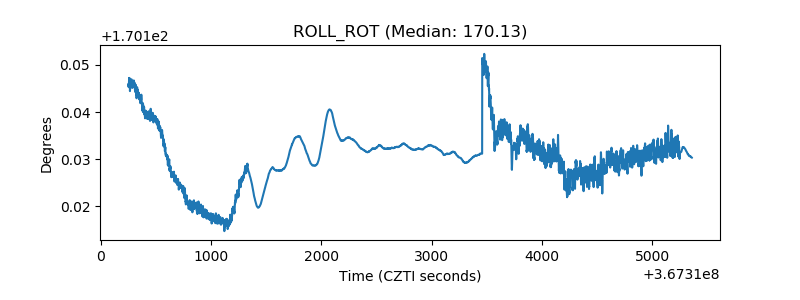 |
| _Roll_DEC | 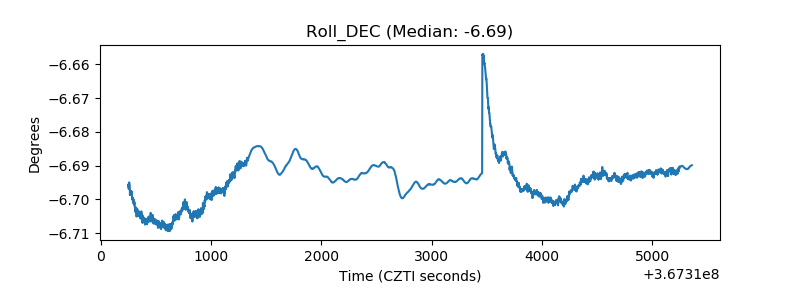 |
| _Roll_RA | 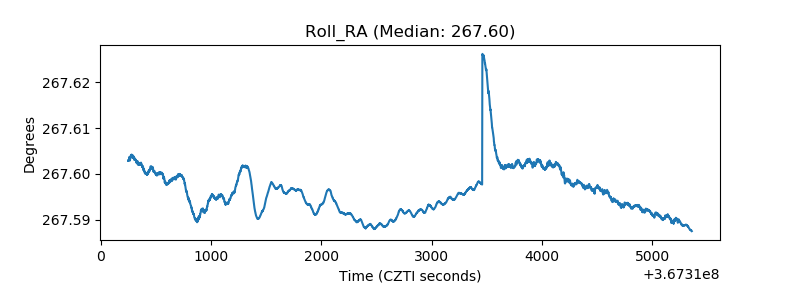 |
| Veto Counter | 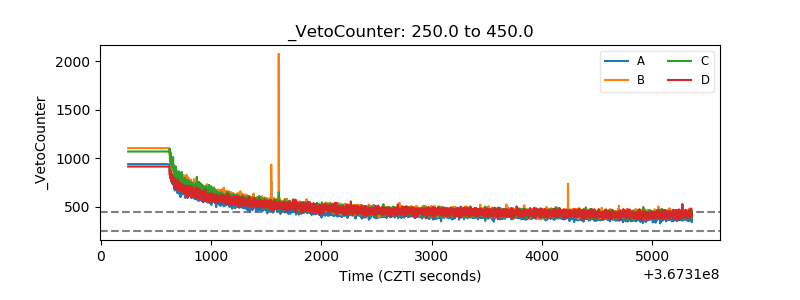 |