| Param | Original file | Final file |
|---|---|---|
| Filename | modeM0/AS1A10_059T01_9000004656cztM0_level2.fits | modeM0/AS1A10_059T01_9000004656cztM0_level2_quad_clean.evt |
| Size (bytes) | 336,957,120 | 213,955,200 |
| Size | 321.3 MB | 204.0 MB |
| Events in quadrant A | 2,223,352 | 1,200,713 |
| Events in quadrant B | 2,031,214 | 1,145,932 |
| Events in quadrant C | 2,053,796 | 1,124,075 |
| Events in quadrant D | 1,755,370 | 867,671 |
| Mode M0 | |||
|---|---|---|---|
| Quadrant | BADHDUFLAG | Total packets | Discarded packets |
| A | 0 | 70331 | 0 |
| B | 0 | 103331 | 0 |
| C | 0 | 101926 | 0 |
| D | 0 | 127474 | 0 |
| Mode M9 | |||
|---|---|---|---|
| Quadrant | BADHDUFLAG | Total packets | Discarded packets |
| A | 0 | 71 | 0 |
| B | 0 | 71 | 0 |
| C | 0 | 71 | 0 |
| D | 0 | 71 | 0 |
| Mode SS | |||
|---|---|---|---|
| Quadrant | BADHDUFLAG | Total packets | Discarded packets |
| A | 0 | 634 | 0 |
| B | 0 | 634 | 0 |
| C | 0 | 634 | 0 |
| D | 0 | 634 | 0 |
| Quadrant | Total seconds | Saturated seconds | Saturation percentage |
|---|---|---|---|
| A | 31119 | 532 | 1.709567% |
| B | 31119 | 1437 | 4.617758% |
| C | 31119 | 2296 | 7.378129% |
| D | 31119 | 4494 | 14.441338% |
Noise dominated data is calculated using 1-second bins in cleaned event files. If a bin has >2000 counts, and if more than 50% of those come from <1% of pixels, then it is considered to be noise-dominated and hence unusable.
| Quadrant | # 1 sec bins | Bins with >0 counts | Bins with >2000 counts | High rate bins dominated by noise | Noise dominated (total time) | Noise dominated (detector-on time) | Marked lightcurve |
|---|---|---|---|---|---|---|---|
| A | 38363 | 31113 | 0 | 0 | 0.00% | 0.00% |  |
| B | 38363 | 31112 | 0 | 0 | 0.00% | 0.00% |  |
| C | 38364 | 31111 | 0 | 0 | 0.00% | 0.00% |  |
| D | 38364 | 30982 | 0 | 0 | 0.00% | 0.00% |  |
Top three noisy pixels from each quadrant. If the there are fewer than three noisy pixels in the level2.evt file, extra rows are filled as -1
| Pixel properties | Quadrant properties | ||||||
|---|---|---|---|---|---|---|---|
| Quadrant | DetID | PixID | Counts | Sigma | Mean | Median | Sigma |
| A | 0 | 29 | 2098 | 10.96 | 581 | 554 | 140.9 |
| A | 7 | 110 | 1711 | 8.21 | 581 | 554 | 140.9 |
| A | 0 | 30 | 1670 | 7.92 | 581 | 554 | 140.9 |
| B | 2 | 9 | 1617 | 10.43 | 539 | 520 | 105.1 |
| B | 3 | 80 | 1421 | 8.57 | 539 | 520 | 105.1 |
| B | 5 | 255 | 1364 | 8.03 | 539 | 520 | 105.1 |
| C | 1 | 81 | 1618 | 8.1 | 544 | 516 | 136.0 |
| C | 1 | 80 | 1584 | 7.85 | 544 | 516 | 136.0 |
| C | 9 | 209 | 1444 | 6.82 | 544 | 516 | 136.0 |
| D | 10 | 189 | 1348 | 6.72 | 502 | 464 | 131.6 |
| D | 6 | 67 | 1290 | 6.28 | 502 | 464 | 131.6 |
| D | 7 | 3 | 1223 | 5.77 | 502 | 464 | 131.6 |
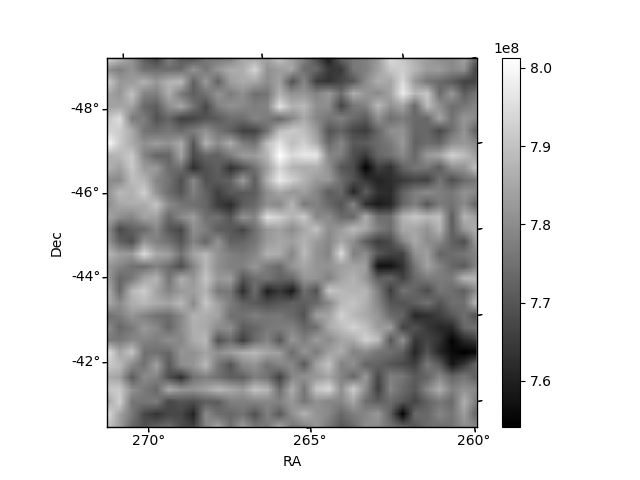
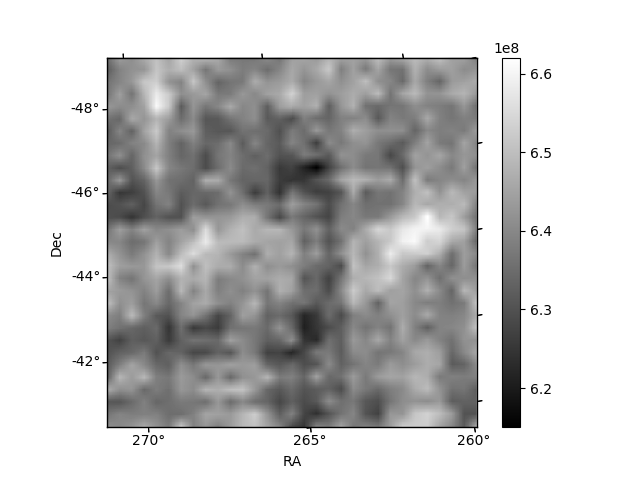
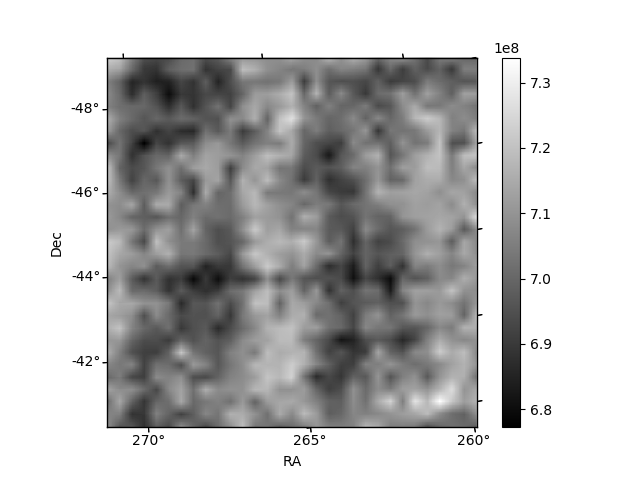
Histogram calculated using DETX and DETY for each event in the final _common_clean file
| Quadrant A | 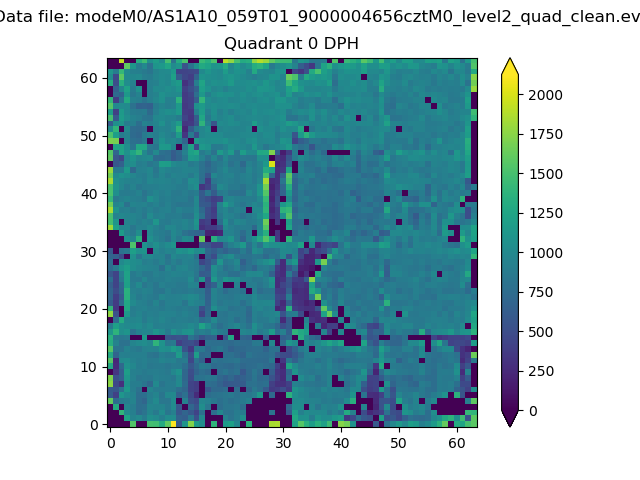 |
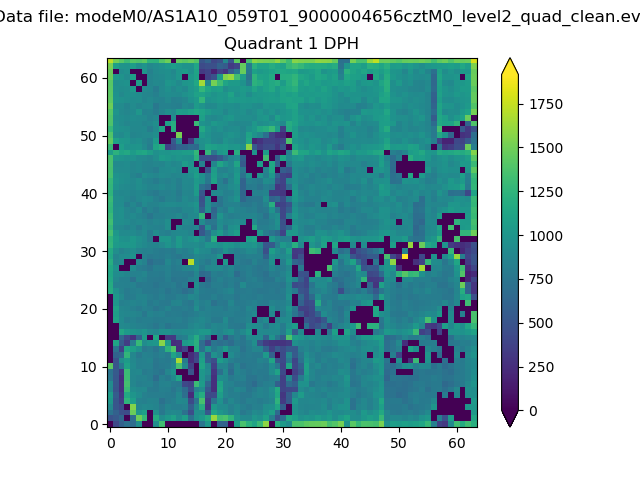 |
Quadrant B |
|---|---|---|---|
| Quadrant D | 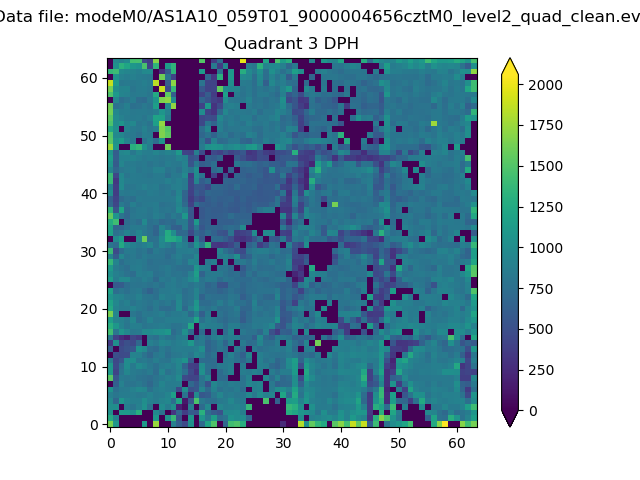 |
 |
Quadrant C |
| Plot type | Count rate plots | Images |
|---|---|---|
| Comparison with Poisson distribution Blue bars denote a histogram of data divided into 1 sec bins. Red curve is a Poisson curve with rate = median count rate of data. |
 |
 |
| Quadrant-wise count rates Data is divided into 100 sec bins |
 |
|
| Module-wise count rates for Quadrant A Data is divided into 100 sec bins |
 |
 |
| Module-wise count rates for Quadrant B Data is divided into 100 sec bins |
 |
 |
| Module-wise count rates for Quadrant C Data is divided into 100 sec bins |
 |
 |
| Module-wise count rates for Quadrant D Data is divided into 100 sec bins |
 |
 |
| Parameter | Plot |
|---|---|
| CZT HV Monitor |  |
| D_VDD | 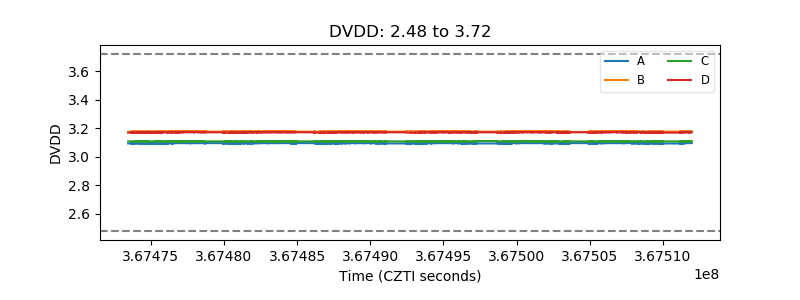 |
| Temperature 1 |  |
| Veto HV Monitor |  |
| Veto LLD | 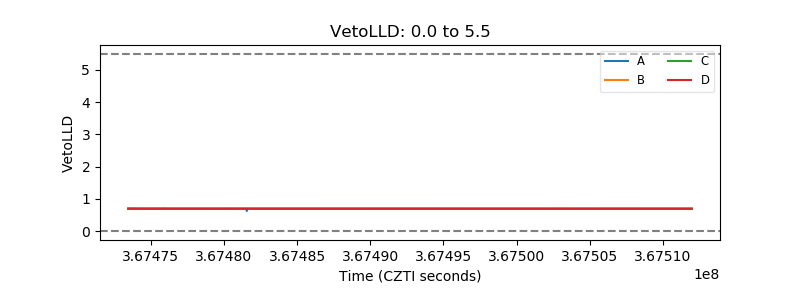 |
| Alpha Counter |  |
| _CPM_Rate |  |
| CZT Counter |  |
| +2.5 Volts monitor |  |
| +5 Volts monitor |  |
| _ROLL_ROT |  |
| _Roll_DEC |  |
| _Roll_RA |  |
| Veto Counter | 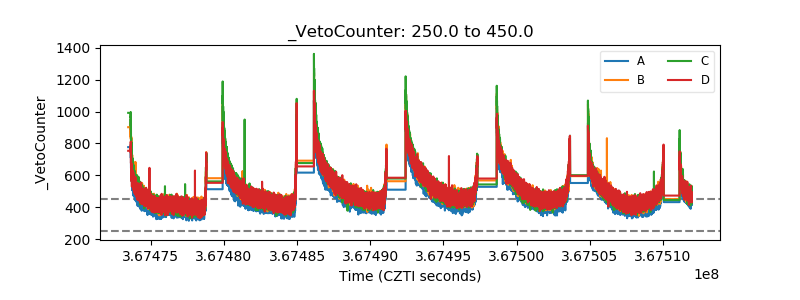 |