| Param | Original file | Final file |
|---|---|---|
| Filename | modeM0/AS1A10_059T01_9000004656_31930cztM0_level2.evt | modeM0/AS1A10_059T01_9000004656_31930cztM0_level2_quad_clean.evt |
| Size (bytes) | 416,934,720 | 45,095,040 |
| Size | 397.6 MB | 43.0 MB |
| Events in quadrant A | 2,259,098 | 306,784 |
| Events in quadrant B | 2,912,725 | 308,167 |
| Events in quadrant C | 2,746,725 | 302,822 |
| Events in quadrant D | 4,469,712 | 197,874 |
| Mode M0 | |||
|---|---|---|---|
| Quadrant | BADHDUFLAG | Total packets | Discarded packets |
| A | 0 | 9476 | 397 |
| B | 0 | 11451 | 314 |
| C | 0 | 10800 | 250 |
| D | 0 | 16047 | 238 |
| Mode M9 | |||
|---|---|---|---|
| Quadrant | BADHDUFLAG | Total packets | Discarded packets |
| A | 0 | 12 | 0 |
| B | 0 | 12 | 0 |
| C | 0 | 12 | 0 |
| D | 0 | 12 | 0 |
| Mode SS | |||
|---|---|---|---|
| Quadrant | BADHDUFLAG | Total packets | Discarded packets |
| A | 0 | 74 | 2 |
| B | 0 | 73 | 3 |
| C | 0 | 74 | 2 |
| D | 0 | 73 | 1 |
| Quadrant | Total seconds | Saturated seconds | Saturation percentage |
|---|---|---|---|
| A | 3513 | 147 | 4.184458% |
| B | 3514 | 135 | 3.841776% |
| C | 3520 | 257 | 7.301136% |
| D | 3524 | 1098 | 31.157775% |
Noise dominated data is calculated using 1-second bins in cleaned event files. If a bin has >2000 counts, and if more than 50% of those come from <1% of pixels, then it is considered to be noise-dominated and hence unusable.
| Quadrant | # 1 sec bins | Bins with >0 counts | Bins with >2000 counts | High rate bins dominated by noise | Noise dominated (total time) | Noise dominated (detector-on time) | Marked lightcurve |
|---|---|---|---|---|---|---|---|
| A | 4809 | 3522 | 49 | 49 | 1.02% | 1.39% |  |
| B | 4814 | 3525 | 6 | 6 | 0.12% | 0.17% | 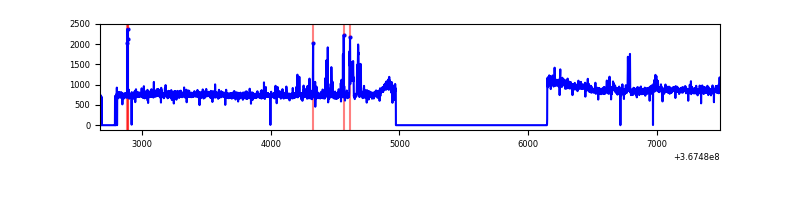 |
| C | 4820 | 3534 | 24 | 24 | 0.50% | 0.68% |  |
| D | 4820 | 3537 | 945 | 945 | 19.61% | 26.72% | 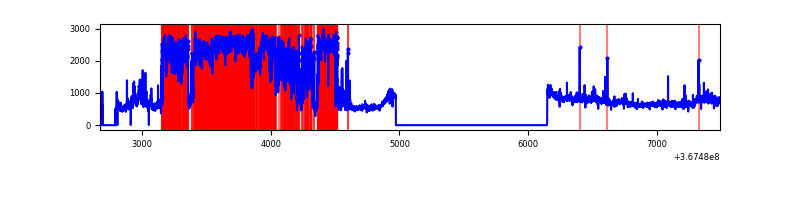 |
Top three noisy pixels from each quadrant. If the there are fewer than three noisy pixels in the level2.evt file, extra rows are filled as -1
| Pixel properties | Quadrant properties | ||||||
|---|---|---|---|---|---|---|---|
| Quadrant | DetID | PixID | Counts | Sigma | Mean | Median | Sigma |
| A | 12 | 96 | 374647 | 3828.53 | 487 | 479 | 97.7 |
| A | 13 | 254 | 6753 | 64.2 | 487 | 479 | 97.7 |
| A | 13 | 6 | 5065 | 46.92 | 487 | 479 | 97.7 |
| B | 6 | 159 | 906765 | 9992.67 | 482 | 472 | 90.7 |
| B | 4 | 80 | 71190 | 779.73 | 482 | 472 | 90.7 |
| B | 10 | 245 | 15099 | 161.28 | 482 | 472 | 90.7 |
| C | 3 | 233 | 612564 | 5753.95 | 461 | 465 | 106.4 |
| C | 0 | 10 | 186958 | 1753.1 | 461 | 465 | 106.4 |
| C | 14 | 238 | 75418 | 704.59 | 461 | 465 | 106.4 |
| D | 13 | 249 | 2018859 | 21522.2 | 396 | 386 | 93.8 |
| D | 12 | 33 | 615045 | 6553.87 | 396 | 386 | 93.8 |
| D | 8 | 195 | 273808 | 2915.39 | 396 | 386 | 93.8 |
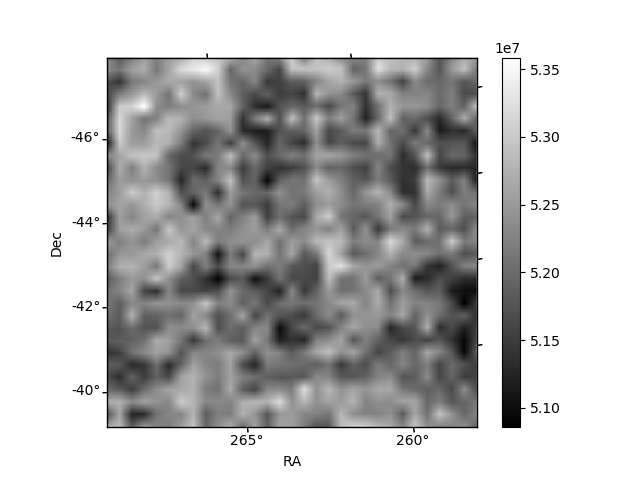
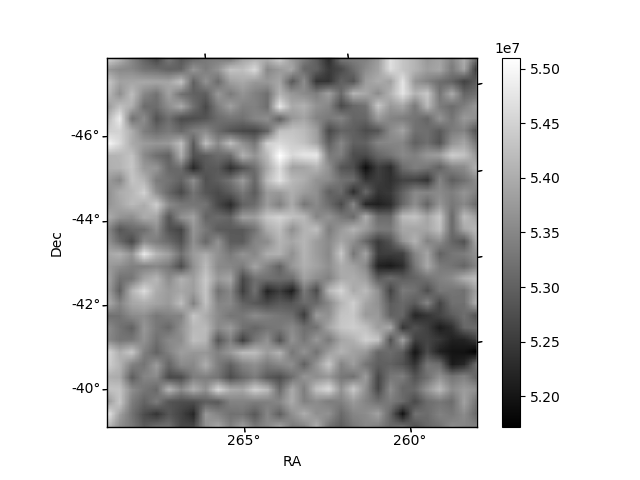
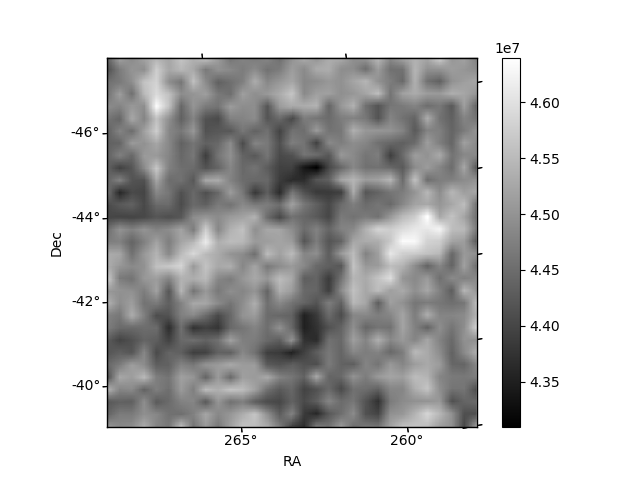
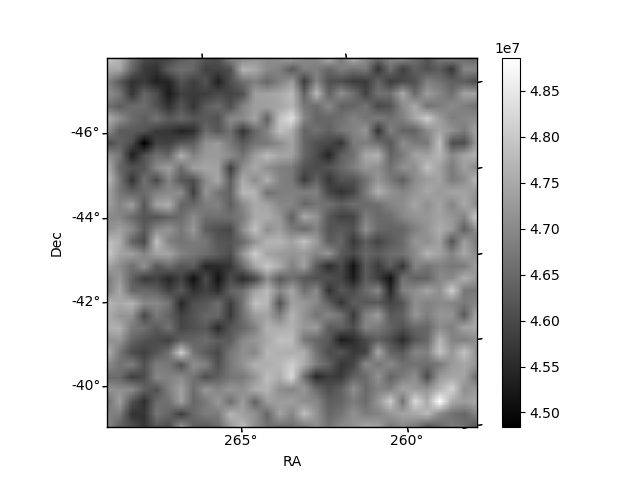
Histogram calculated using DETX and DETY for each event in the final _common_clean file
| Quadrant A | 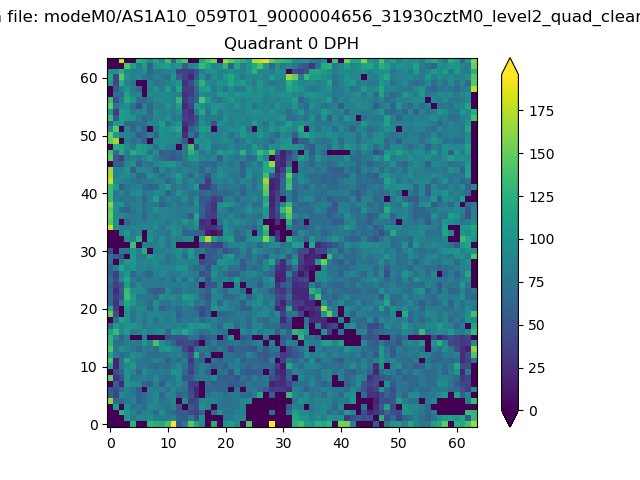 |
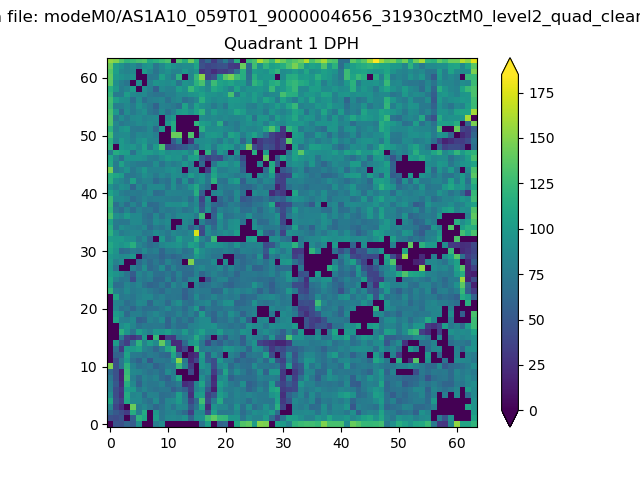 |
Quadrant B |
|---|---|---|---|
| Quadrant D |  |
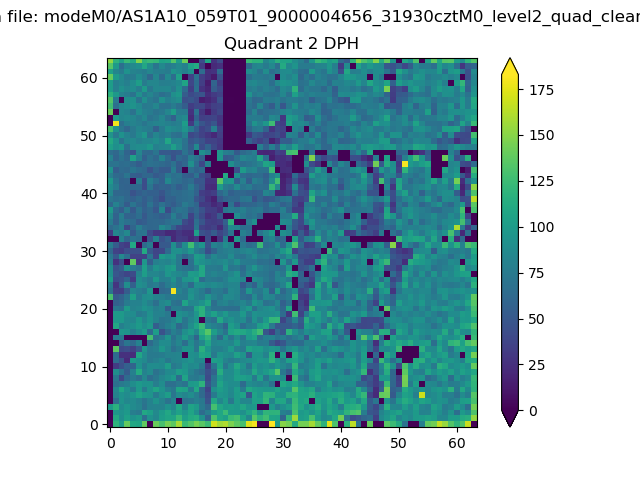 |
Quadrant C |
| Plot type | Count rate plots | Images |
|---|---|---|
| Comparison with Poisson distribution Blue bars denote a histogram of data divided into 1 sec bins. Red curve is a Poisson curve with rate = median count rate of data. |
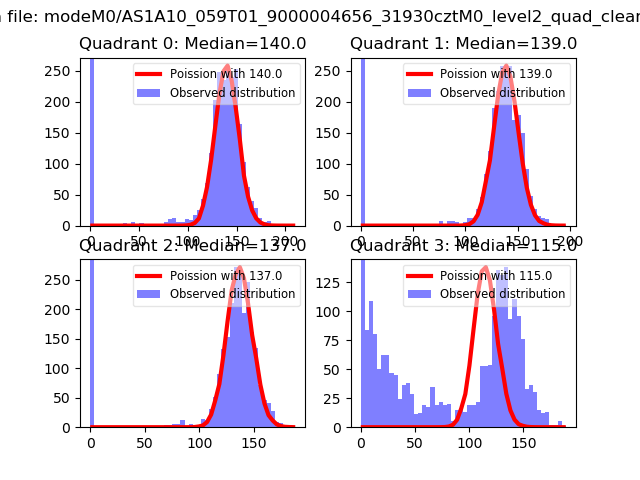 |
 |
| Quadrant-wise count rates Data is divided into 100 sec bins |
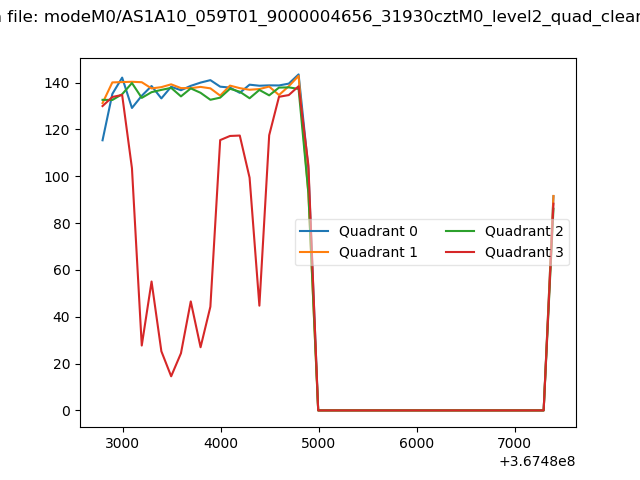 |
|
| Module-wise count rates for Quadrant A Data is divided into 100 sec bins |
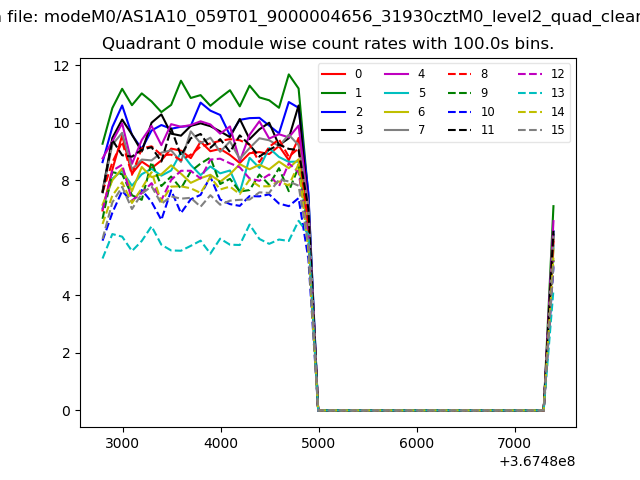 |
 |
| Module-wise count rates for Quadrant B Data is divided into 100 sec bins |
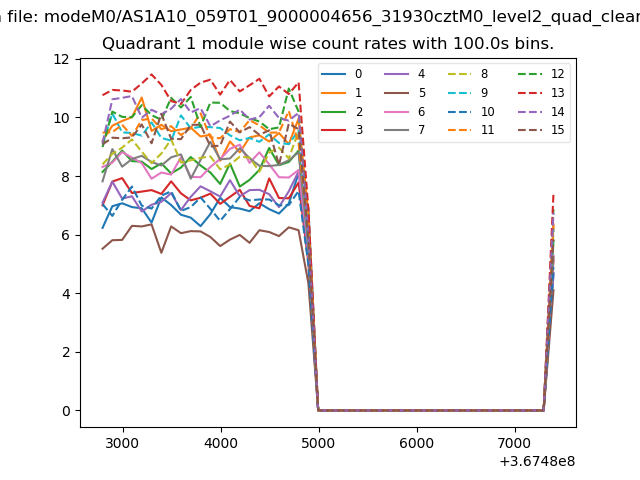 |
 |
| Module-wise count rates for Quadrant C Data is divided into 100 sec bins |
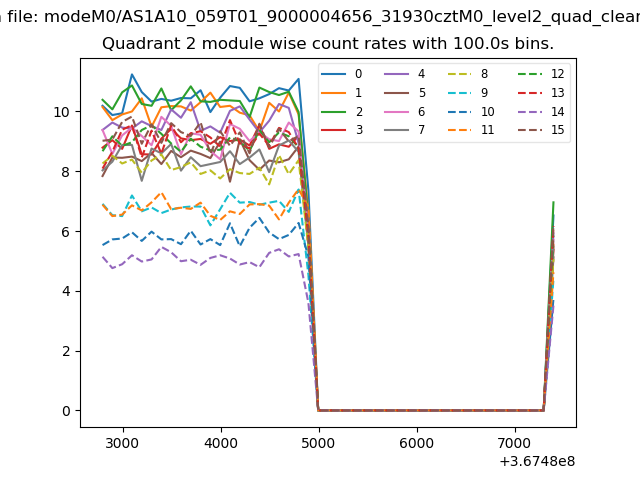 |
 |
| Module-wise count rates for Quadrant D Data is divided into 100 sec bins |
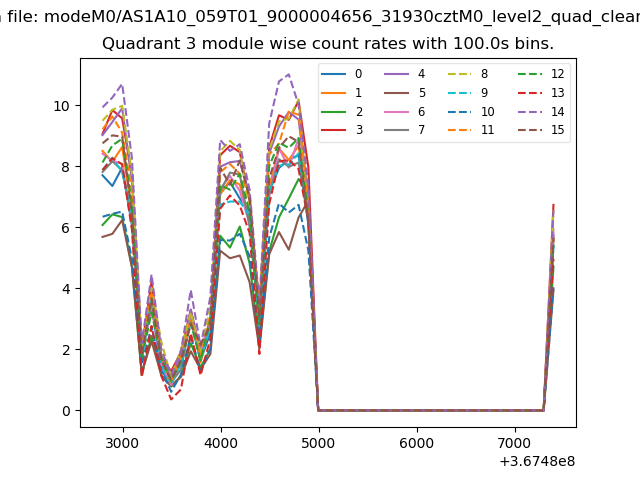 |
 |
| Parameter | Plot |
|---|---|
| CZT HV Monitor | 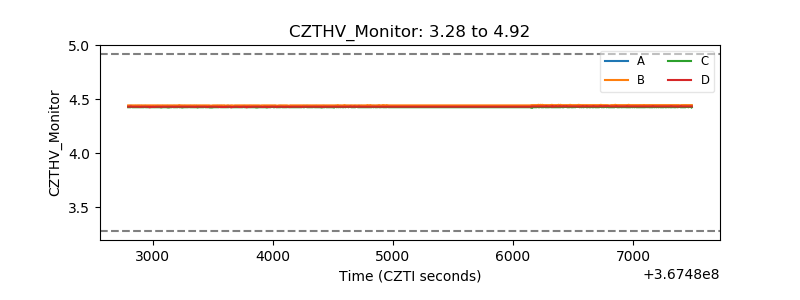 |
| D_VDD | 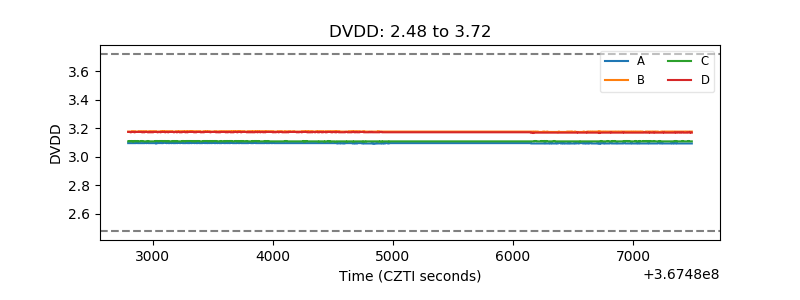 |
| Temperature 1 | 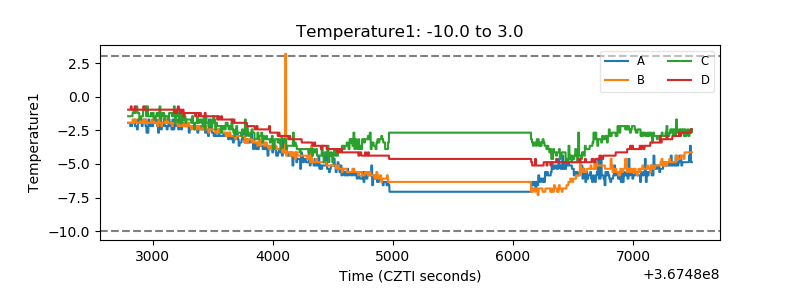 |
| Veto HV Monitor | 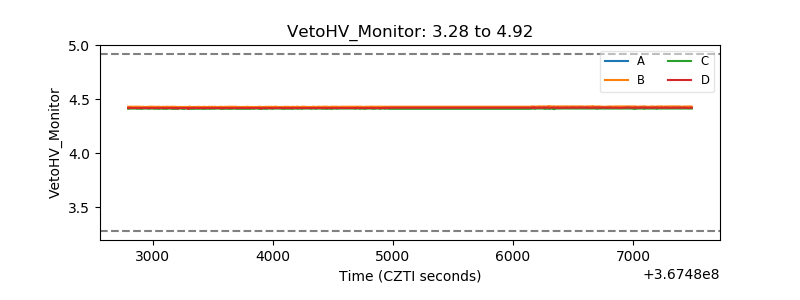 |
| Veto LLD | 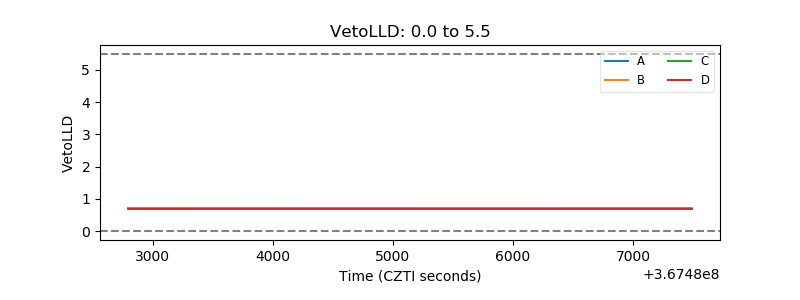 |
| Alpha Counter | 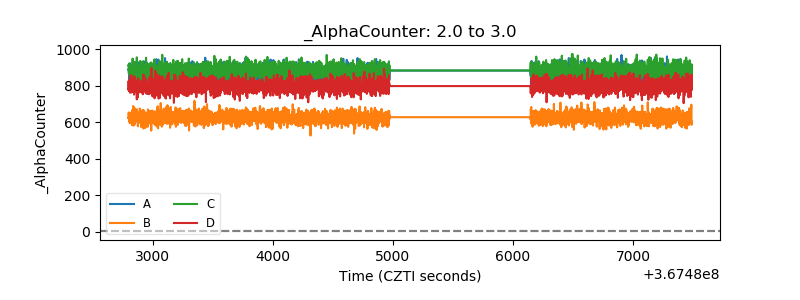 |
| _CPM_Rate | 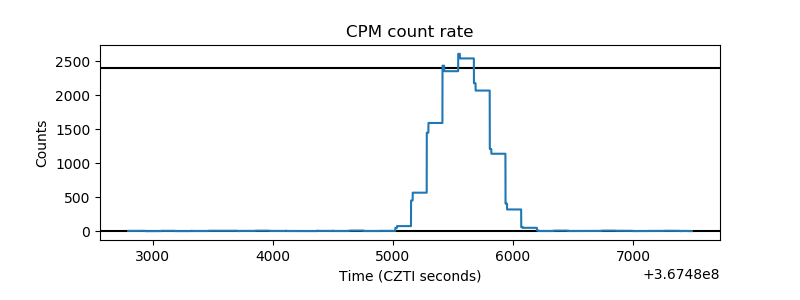 |
| CZT Counter | 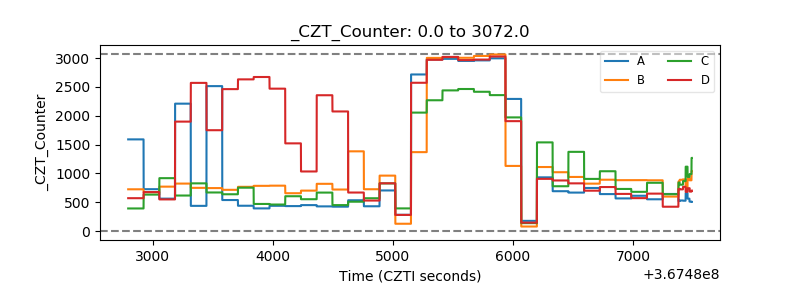 |
| +2.5 Volts monitor |  |
| +5 Volts monitor |  |
| _ROLL_ROT | 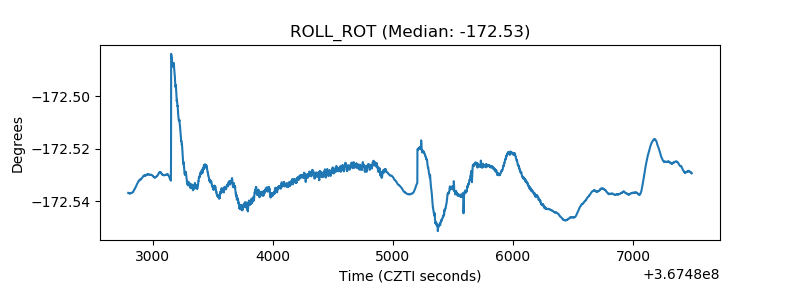 |
| _Roll_DEC | 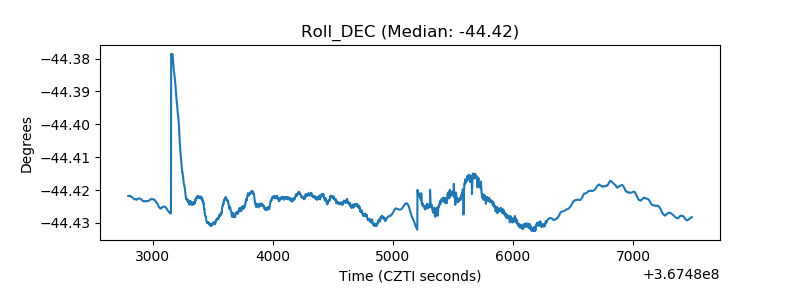 |
| _Roll_RA | 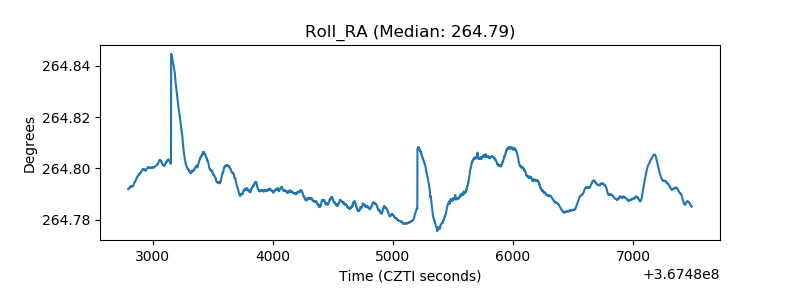 |
| Veto Counter | 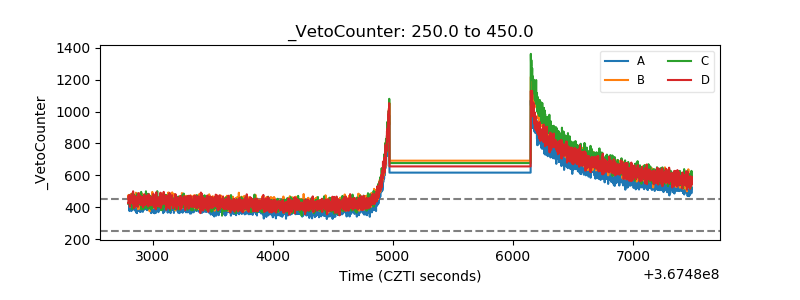 |