| Param | Original file | Final file |
|---|---|---|
| Filename | modeM0/AS1A10_059T01_9000004656_31933cztM0_level2.evt | modeM0/AS1A10_059T01_9000004656_31933cztM0_level2_quad_clean.evt |
| Size (bytes) | 3,119,909,760 | 430,790,400 |
| Size | 2.9 GB | 410.8 MB |
| Events in quadrant A | 15,029,002 | 2,960,000 |
| Events in quadrant B | 22,653,571 | 2,919,906 |
| Events in quadrant C | 23,824,511 | 2,802,294 |
| Events in quadrant D | 31,184,540 | 2,519,821 |
| Mode M0 | |||
|---|---|---|---|
| Quadrant | BADHDUFLAG | Total packets | Discarded packets |
| A | 0 | 61275 | 6 |
| B | 0 | 86091 | 6 |
| C | 0 | 90150 | 6 |
| D | 0 | 111461 | 6 |
| Mode M9 | |||
|---|---|---|---|
| Quadrant | BADHDUFLAG | Total packets | Discarded packets |
| A | 0 | 60 | 0 |
| B | 0 | 60 | 0 |
| C | 0 | 60 | 0 |
| D | 0 | 60 | 0 |
| Mode SS | |||
|---|---|---|---|
| Quadrant | BADHDUFLAG | Total packets | Discarded packets |
| A | 0 | 546 | 0 |
| B | 0 | 546 | 0 |
| C | 0 | 546 | 0 |
| D | 0 | 546 | 0 |
| Quadrant | Total seconds | Saturated seconds | Saturation percentage |
|---|---|---|---|
| A | 26828 | 462 | 1.722081% |
| B | 26828 | 905 | 3.373341% |
| C | 26828 | 2136 | 7.961831% |
| D | 26828 | 4207 | 15.681378% |
Noise dominated data is calculated using 1-second bins in cleaned event files. If a bin has >2000 counts, and if more than 50% of those come from <1% of pixels, then it is considered to be noise-dominated and hence unusable.
| Quadrant | # 1 sec bins | Bins with >0 counts | Bins with >2000 counts | High rate bins dominated by noise | Noise dominated (total time) | Noise dominated (detector-on time) | Marked lightcurve |
|---|---|---|---|---|---|---|---|
| A | 32984 | 26830 | 90 | 90 | 0.27% | 0.34% | 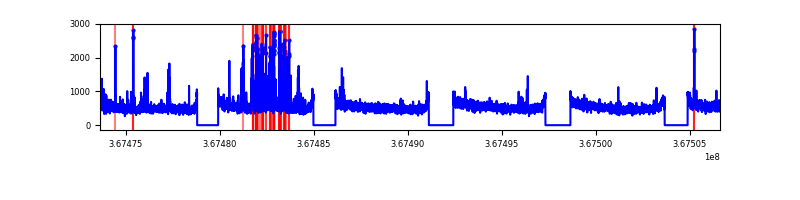 |
| B | 32984 | 26831 | 216 | 216 | 0.65% | 0.81% | 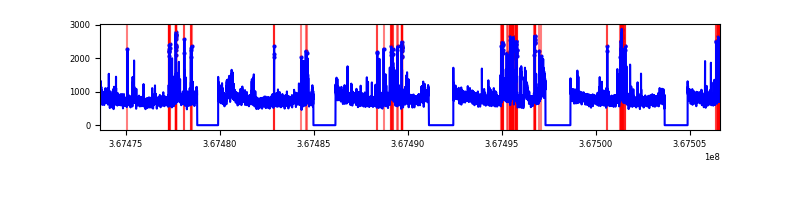 |
| C | 32984 | 26831 | 613 | 613 | 1.86% | 2.28% | 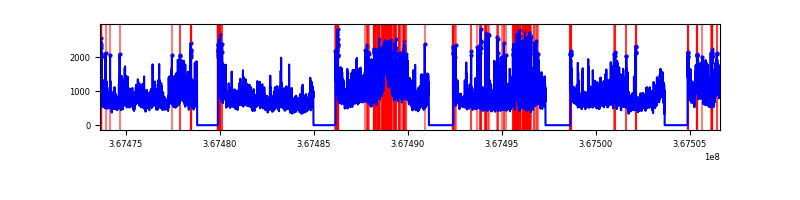 |
| D | 32984 | 26832 | 4103 | 4103 | 12.44% | 15.29% | 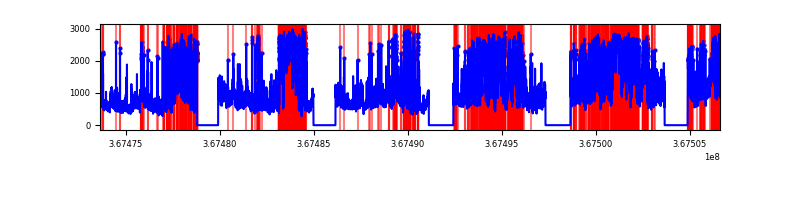 |
Top three noisy pixels from each quadrant. If the there are fewer than three noisy pixels in the level2.evt file, extra rows are filled as -1
| Pixel properties | Quadrant properties | ||||||
|---|---|---|---|---|---|---|---|
| Quadrant | DetID | PixID | Counts | Sigma | Mean | Median | Sigma |
| A | 12 | 96 | 972186 | 1363.92 | 3631 | 3570 | 710.2 |
| A | 13 | 254 | 51546 | 67.55 | 3631 | 3570 | 710.2 |
| A | 13 | 6 | 38398 | 49.04 | 3631 | 3570 | 710.2 |
| B | 6 | 159 | 7063277 | 10840.39 | 3549 | 3468 | 651.3 |
| B | 4 | 80 | 957096 | 1464.3 | 3549 | 3468 | 651.3 |
| B | 5 | 172 | 410444 | 624.91 | 3549 | 3468 | 651.3 |
| C | 3 | 233 | 8310229 | 10835.91 | 3388 | 3416 | 766.6 |
| C | 0 | 10 | 1464417 | 1905.82 | 3388 | 3416 | 766.6 |
| C | 14 | 238 | 574705 | 745.22 | 3388 | 3416 | 766.6 |
| D | 12 | 33 | 9252873 | 11942.84 | 3318 | 3243 | 774.5 |
| D | 8 | 195 | 4173098 | 5383.99 | 3318 | 3243 | 774.5 |
| D | 13 | 249 | 3408347 | 4396.57 | 3318 | 3243 | 774.5 |
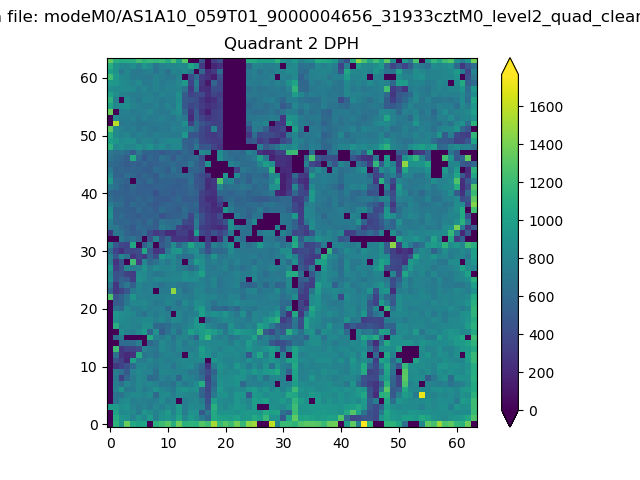
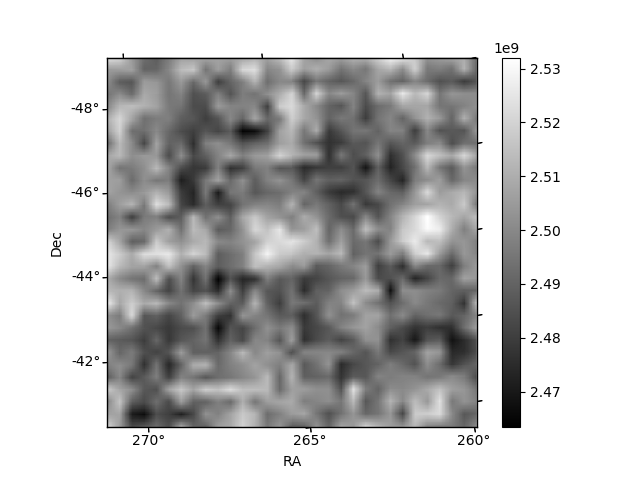
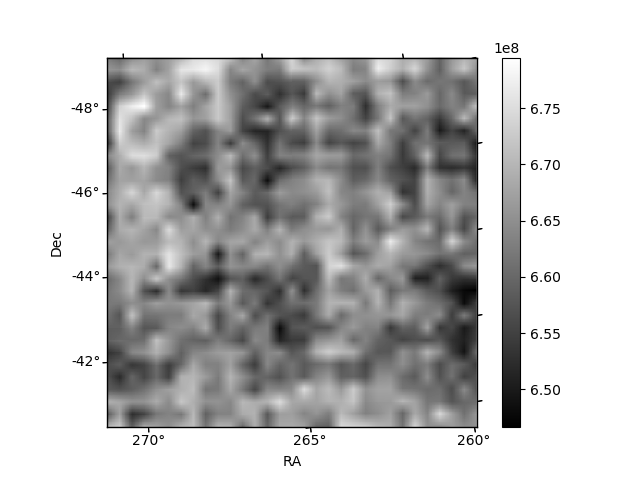
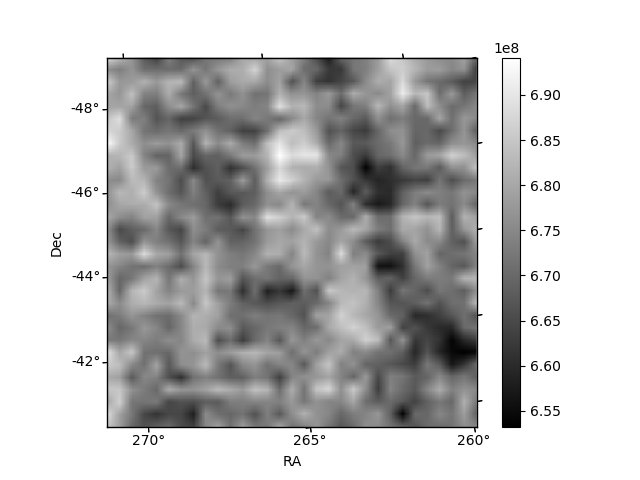
Histogram calculated using DETX and DETY for each event in the final _common_clean file
| Quadrant A | 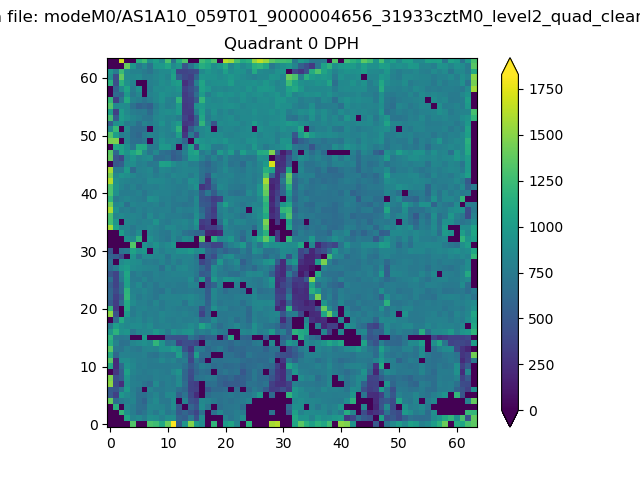 |
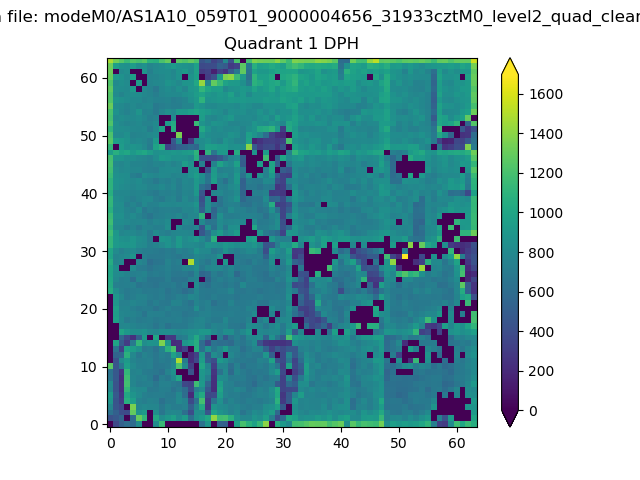 |
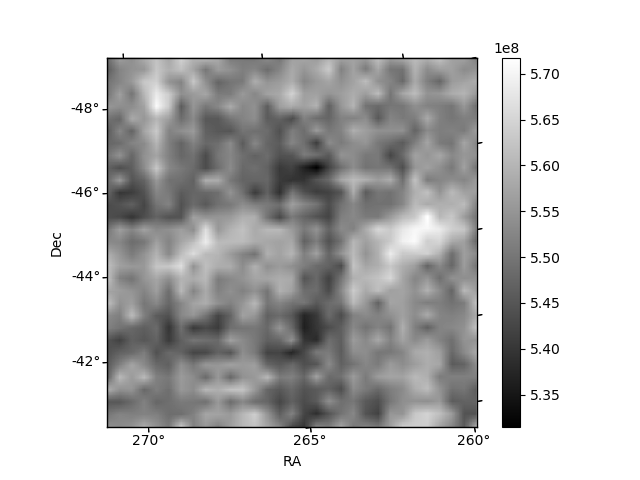
Quadrant B |
|---|---|---|---|
| Quadrant D | 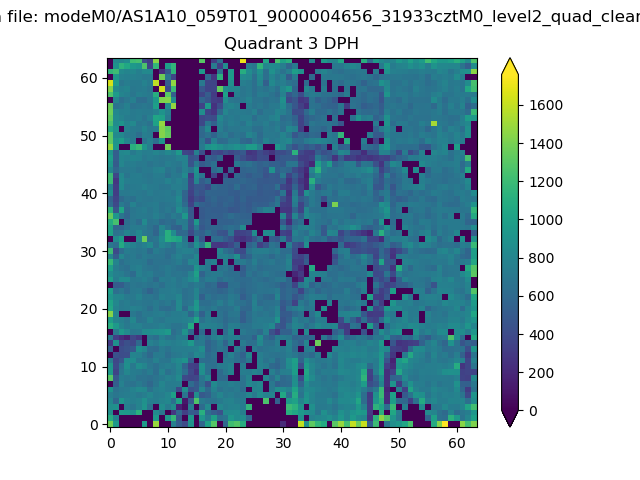 |
 |
Quadrant C |
| Plot type | Count rate plots | Images |
|---|---|---|
| Comparison with Poisson distribution Blue bars denote a histogram of data divided into 1 sec bins. Red curve is a Poisson curve with rate = median count rate of data. |
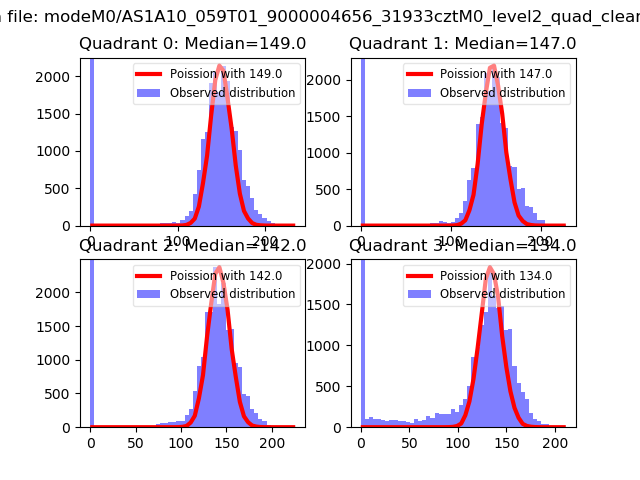 |
 |
| Quadrant-wise count rates Data is divided into 100 sec bins |
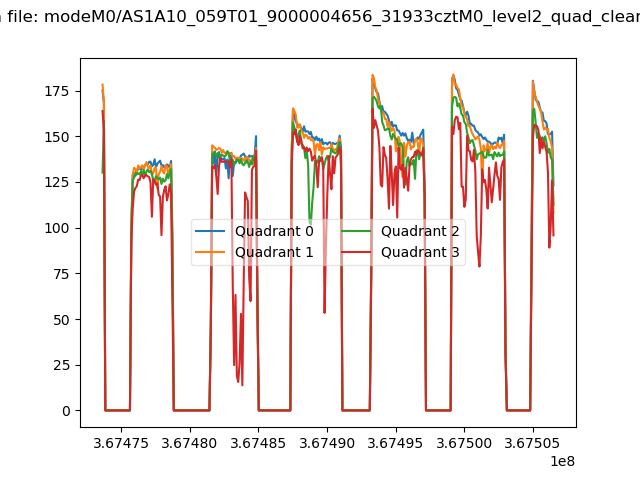 |
|
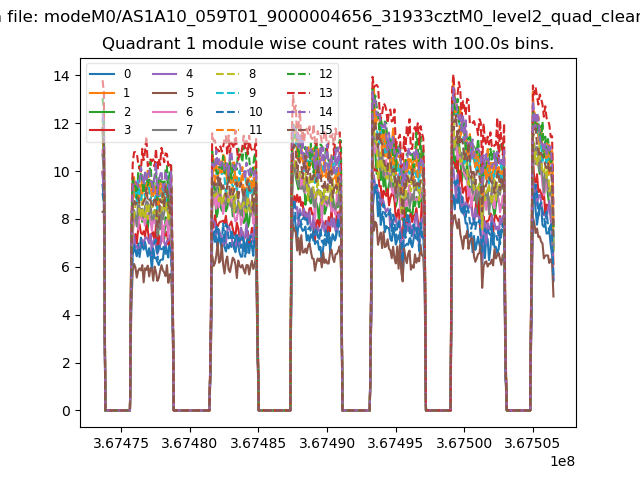
| Module-wise count rates for Quadrant A Data is divided into 100 sec bins |
 |
 |
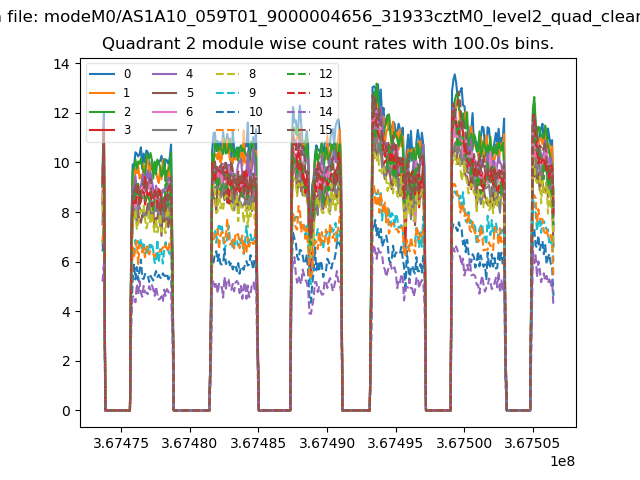
| Module-wise count rates for Quadrant B Data is divided into 100 sec bins |
 |
 |
| Module-wise count rates for Quadrant C Data is divided into 100 sec bins |
 |
 |
| Module-wise count rates for Quadrant D Data is divided into 100 sec bins |
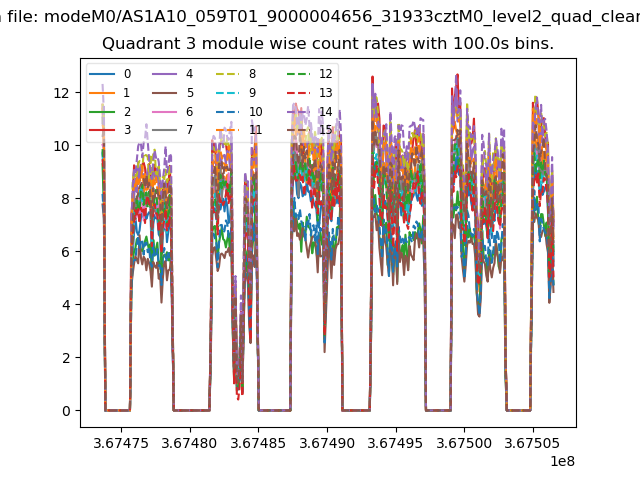 |
 |
| Parameter | Plot |
|---|---|
| CZT HV Monitor | 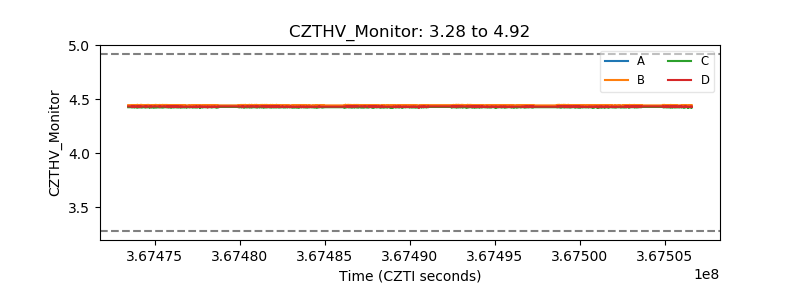 |
| D_VDD | 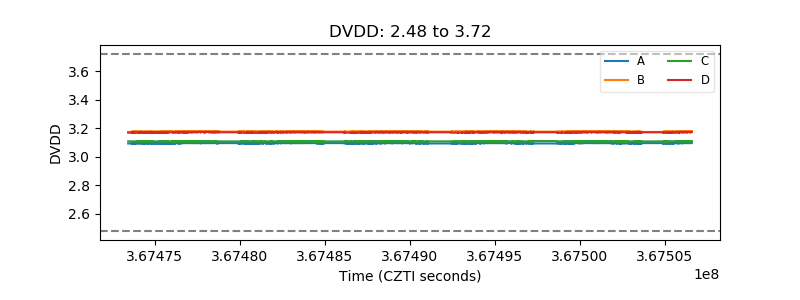 |
| Temperature 1 |  |
| Veto HV Monitor | 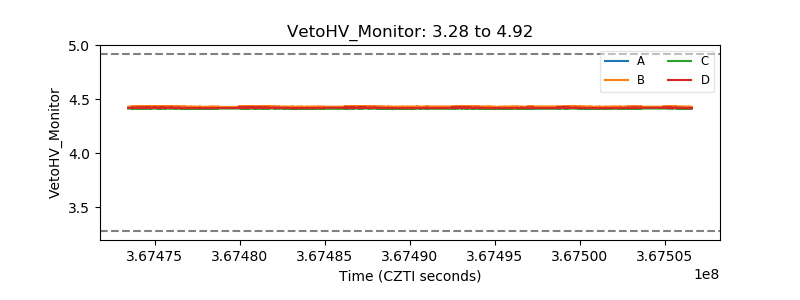 |
| Veto LLD | 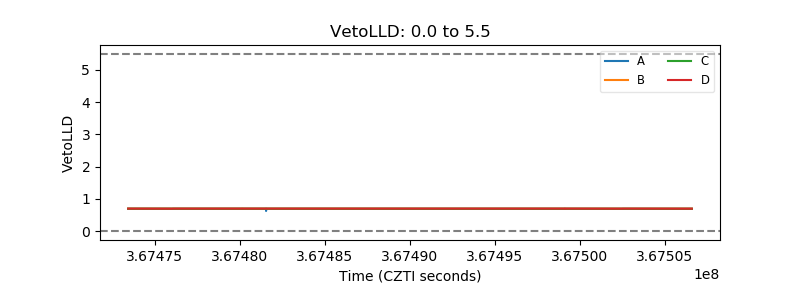 |
| Alpha Counter | 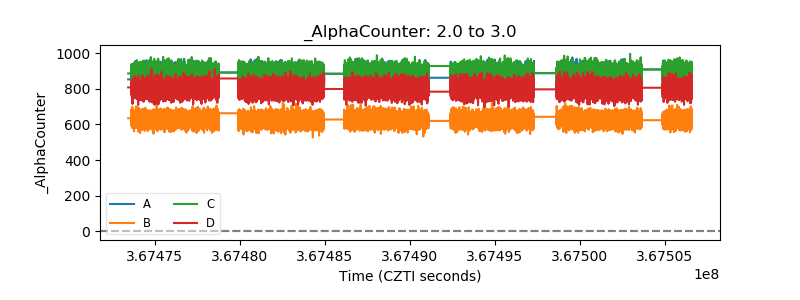 |
| _CPM_Rate | 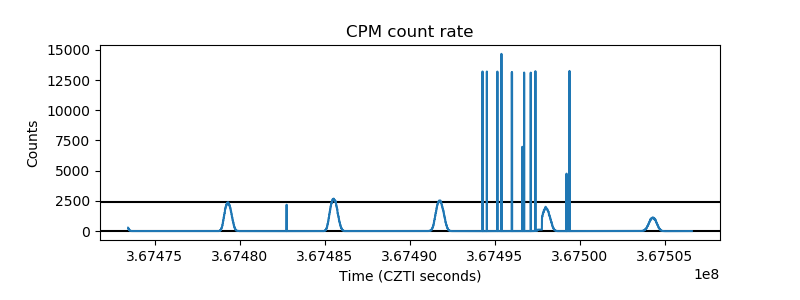 |
| CZT Counter | 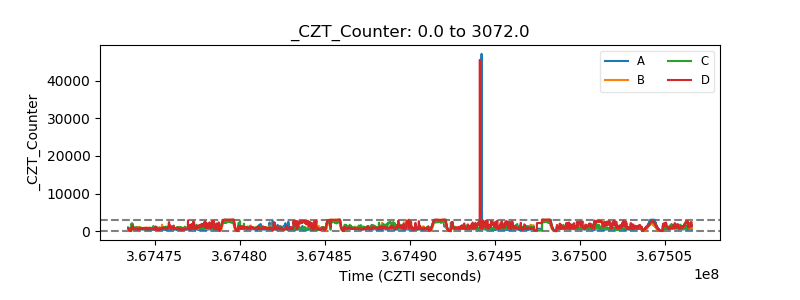 |
| +2.5 Volts monitor |  |
| +5 Volts monitor |  |
| _ROLL_ROT | 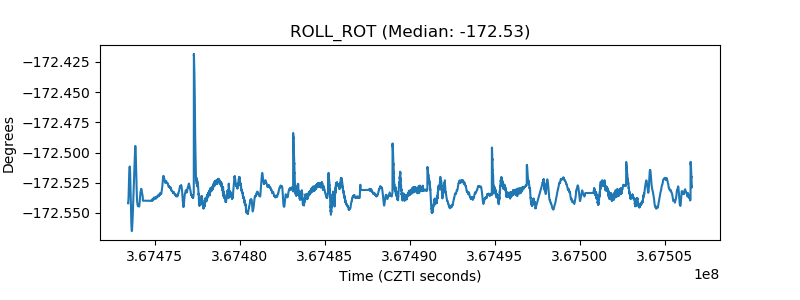 |
| _Roll_DEC | 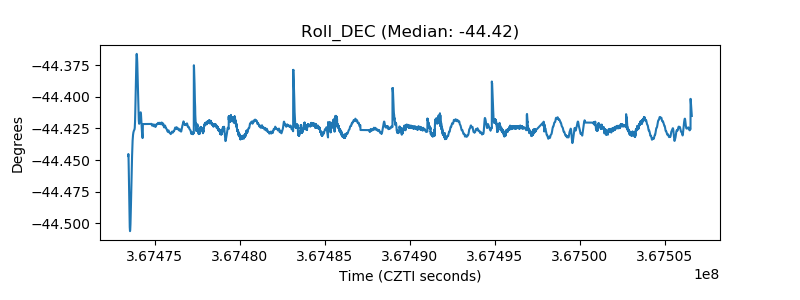 |
| _Roll_RA | 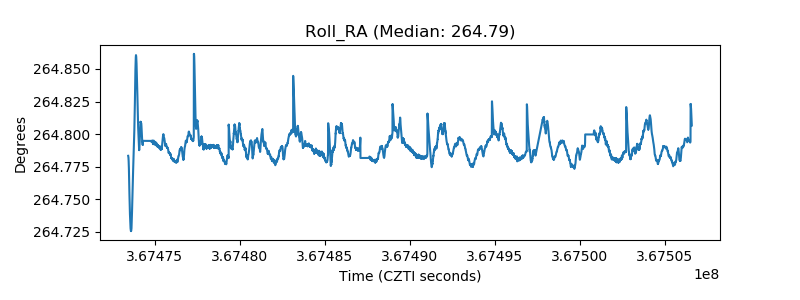 |
| Veto Counter | 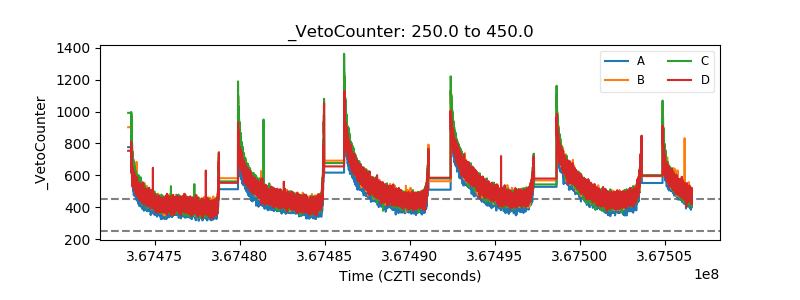 |