| Param | Original file | Final file |
|---|---|---|
| Filename | modeM0/AS1A10_059T01_9000004656_31935cztM0_level2.evt | modeM0/AS1A10_059T01_9000004656_31935cztM0_level2_quad_clean.evt |
| Size (bytes) | 1,659,870,720 | 245,079,360 |
| Size | 1.5 GB | 233.7 MB |
| Events in quadrant A | 7,174,359 | 1,718,371 |
| Events in quadrant B | 13,040,765 | 1,661,839 |
| Events in quadrant C | 11,498,275 | 1,612,830 |
| Events in quadrant D | 17,638,224 | 1,483,406 |
| Mode M0 | |||
|---|---|---|---|
| Quadrant | BADHDUFLAG | Total packets | Discarded packets |
| A | 0 | 29795 | 3 |
| B | 0 | 48163 | 3 |
| C | 0 | 43844 | 3 |
| D | 0 | 62248 | 3 |
| Mode M9 | |||
|---|---|---|---|
| Quadrant | BADHDUFLAG | Total packets | Discarded packets |
| A | 0 | 37 | 0 |
| B | 0 | 37 | 0 |
| C | 0 | 37 | 0 |
| D | 0 | 37 | 0 |
| Mode SS | |||
|---|---|---|---|
| Quadrant | BADHDUFLAG | Total packets | Discarded packets |
| A | 0 | 280 | 0 |
| B | 0 | 280 | 0 |
| C | 0 | 280 | 0 |
| D | 0 | 280 | 0 |
| Quadrant | Total seconds | Saturated seconds | Saturation percentage |
|---|---|---|---|
| A | 13696 | 242 | 1.766939% |
| B | 13697 | 1049 | 7.658611% |
| C | 13697 | 971 | 7.089144% |
| D | 13697 | 2341 | 17.091334% |
Noise dominated data is calculated using 1-second bins in cleaned event files. If a bin has >2000 counts, and if more than 50% of those come from <1% of pixels, then it is considered to be noise-dominated and hence unusable.
| Quadrant | # 1 sec bins | Bins with >0 counts | Bins with >2000 counts | High rate bins dominated by noise | Noise dominated (total time) | Noise dominated (detector-on time) | Marked lightcurve |
|---|---|---|---|---|---|---|---|
| A | 17342 | 13697 | 4 | 4 | 0.02% | 0.03% | 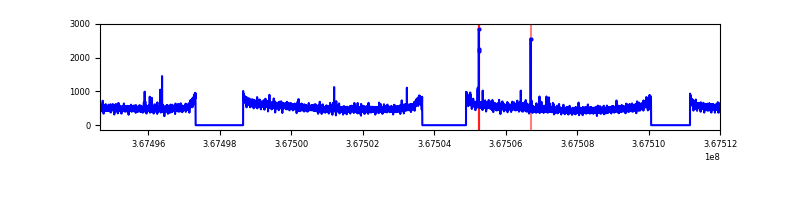 |
| B | 17341 | 13696 | 491 | 491 | 2.83% | 3.58% | 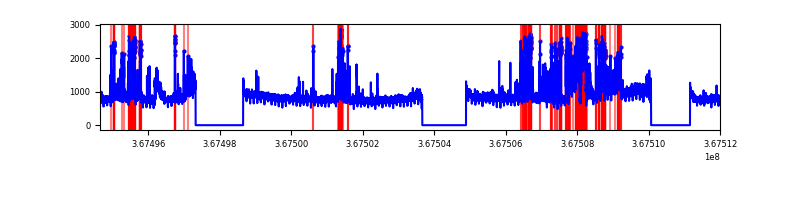 |
| C | 17341 | 13696 | 174 | 174 | 1.00% | 1.27% | 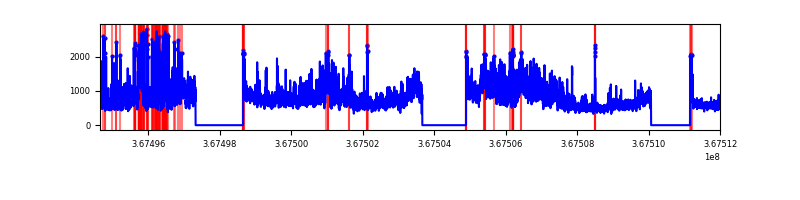 |
| D | 17342 | 13698 | 2362 | 2362 | 13.62% | 17.24% | 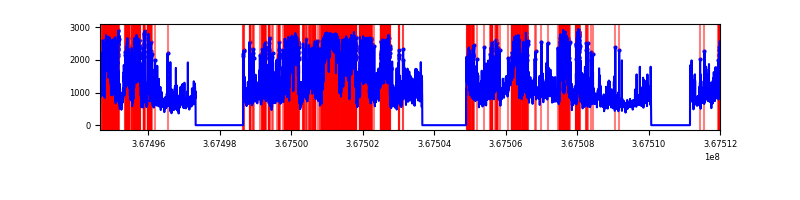 |
Top three noisy pixels from each quadrant. If the there are fewer than three noisy pixels in the level2.evt file, extra rows are filled as -1
| Pixel properties | Quadrant properties | ||||||
|---|---|---|---|---|---|---|---|
| Quadrant | DetID | PixID | Counts | Sigma | Mean | Median | Sigma |
| A | 12 | 96 | 56639 | 151.69 | 1838 | 1808 | 361.5 |
| A | 13 | 254 | 27274 | 70.45 | 1838 | 1808 | 361.5 |
| A | 3 | 137 | 17429 | 43.22 | 1838 | 1808 | 361.5 |
| B | 6 | 159 | 3591546 | 10924.95 | 1772 | 1731 | 328.6 |
| B | 4 | 80 | 2055098 | 6249.05 | 1772 | 1731 | 328.6 |
| B | 5 | 172 | 294058 | 889.64 | 1772 | 1731 | 328.6 |
| C | 3 | 233 | 3902798 | 10118.69 | 1702 | 1716 | 385.5 |
| C | 0 | 10 | 585181 | 1513.4 | 1702 | 1716 | 385.5 |
| C | 14 | 238 | 290921 | 750.14 | 1702 | 1716 | 385.5 |
| D | 12 | 33 | 7353568 | 18698.2 | 1685 | 1645 | 393.2 |
| D | 8 | 195 | 2317902 | 5890.95 | 1685 | 1645 | 393.2 |
| D | 13 | 249 | 1155286 | 2934.06 | 1685 | 1645 | 393.2 |
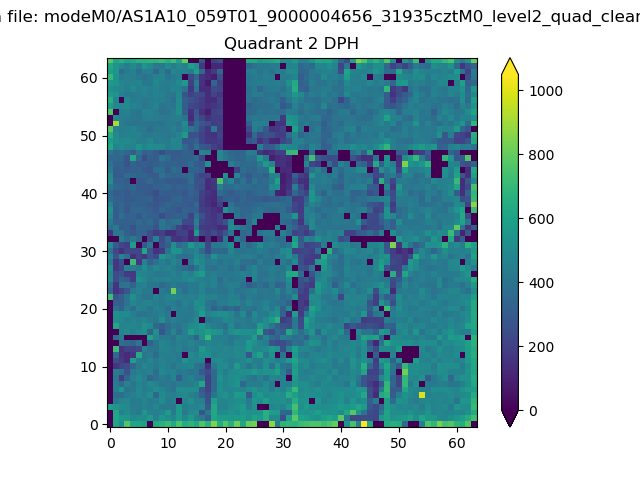
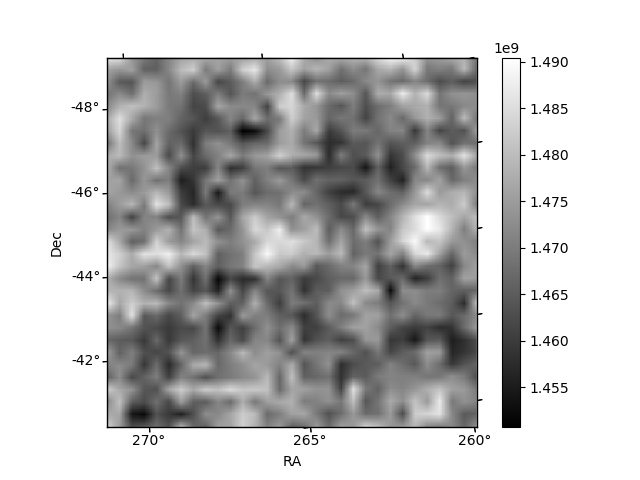
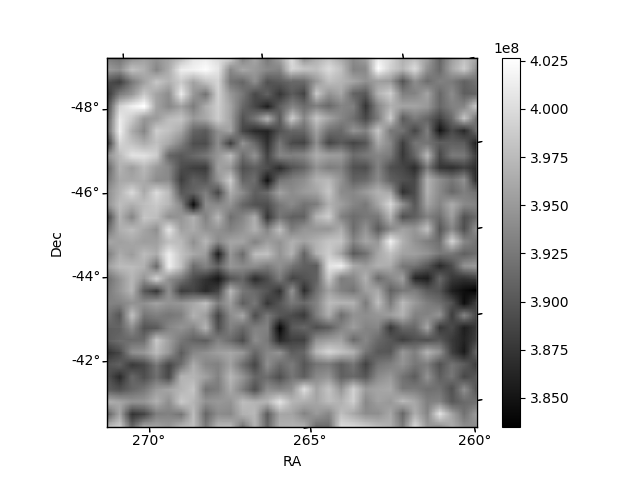
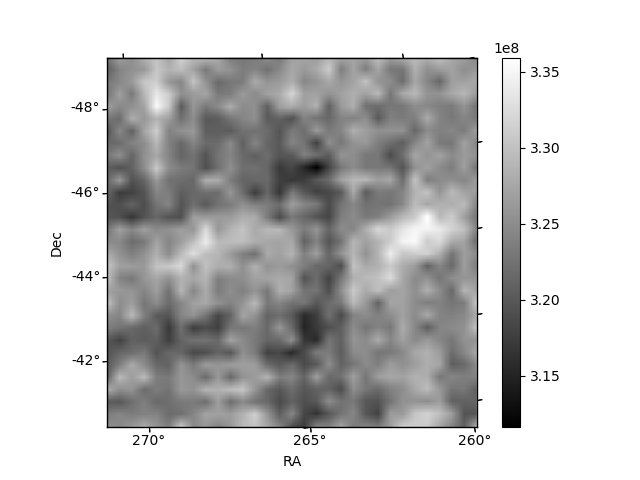
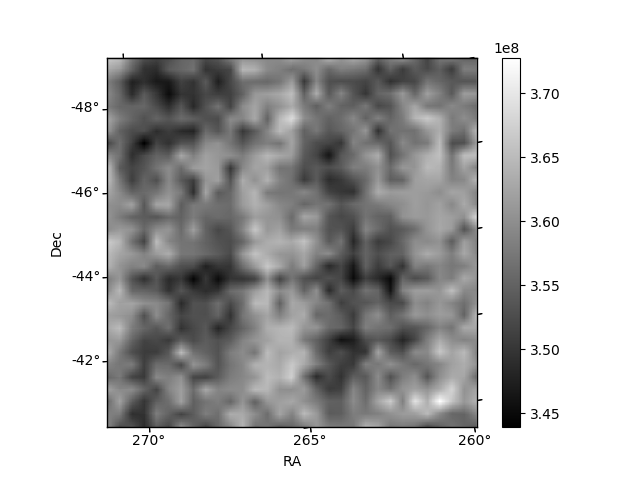
Histogram calculated using DETX and DETY for each event in the final _common_clean file
| Quadrant A | 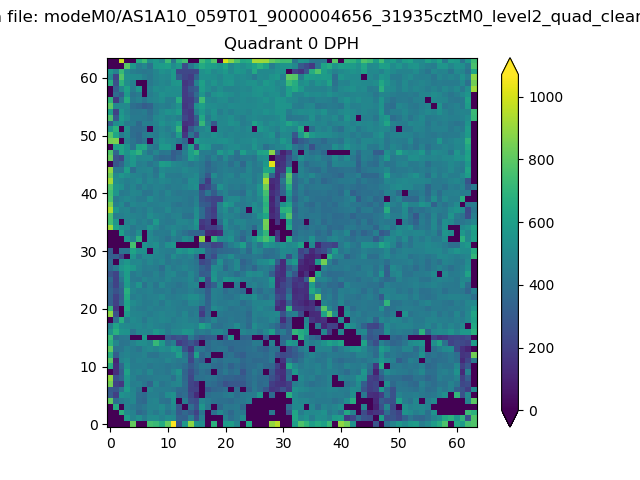 |
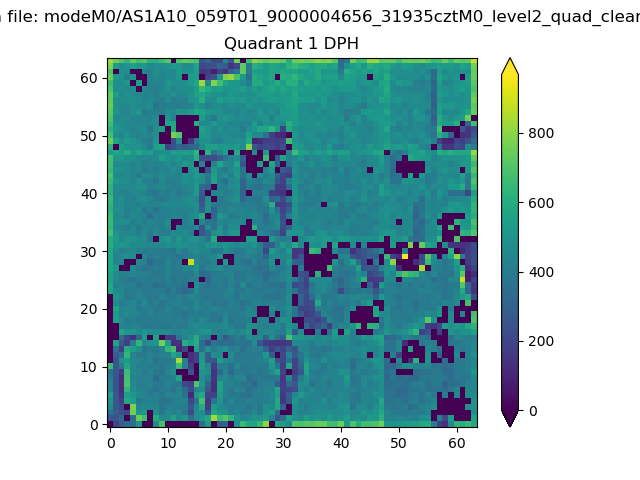 |
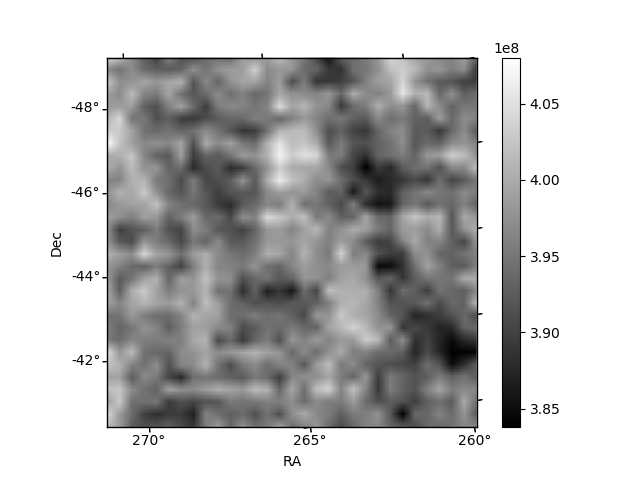
Quadrant B |
|---|---|---|---|
| Quadrant D | 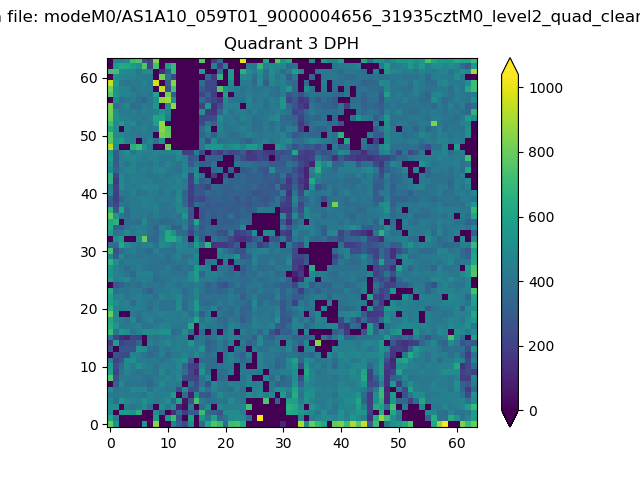 |
 |
Quadrant C |
| Plot type | Count rate plots | Images |
|---|---|---|
| Comparison with Poisson distribution Blue bars denote a histogram of data divided into 1 sec bins. Red curve is a Poisson curve with rate = median count rate of data. |
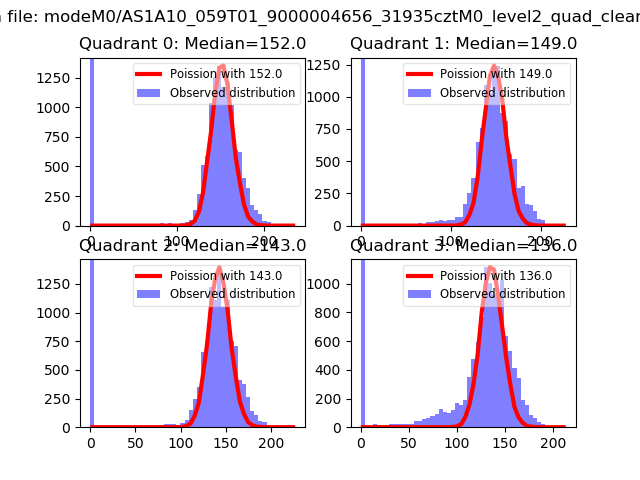 |
 |
| Quadrant-wise count rates Data is divided into 100 sec bins |
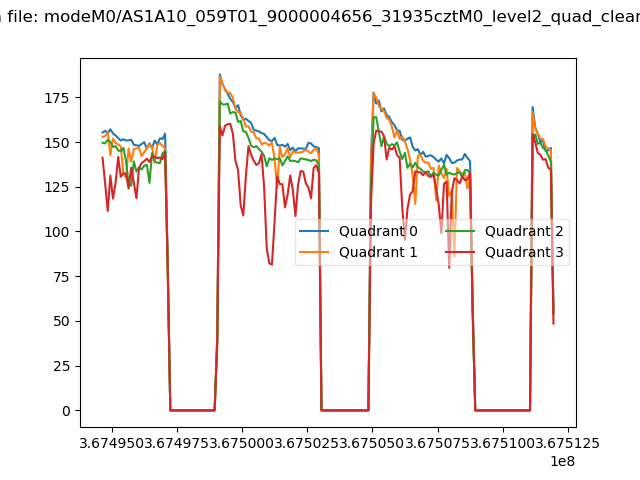 |
|
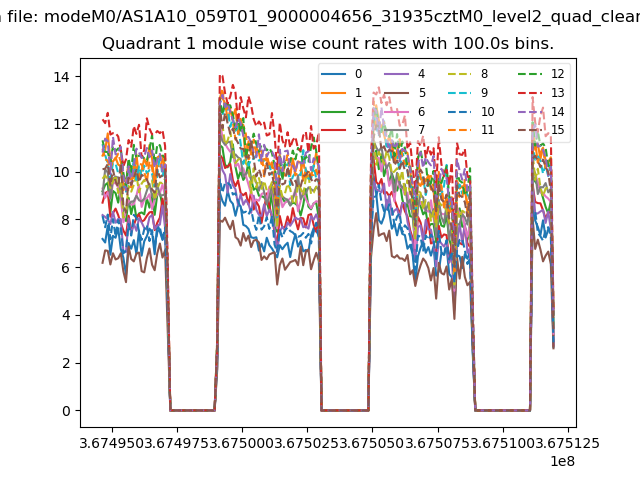
| Module-wise count rates for Quadrant A Data is divided into 100 sec bins |
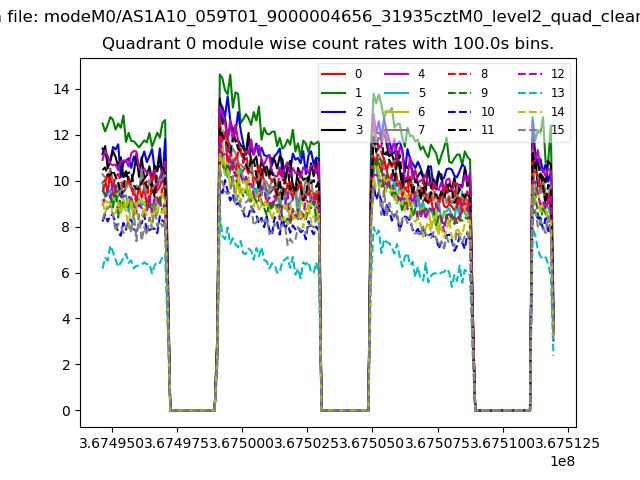 |
 |
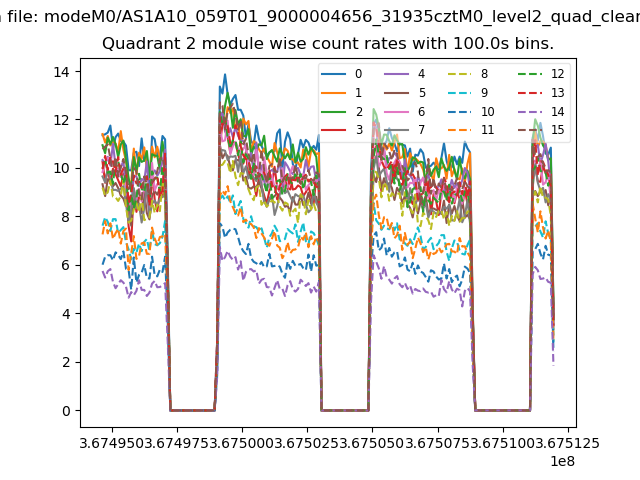
| Module-wise count rates for Quadrant B Data is divided into 100 sec bins |
 |
 |
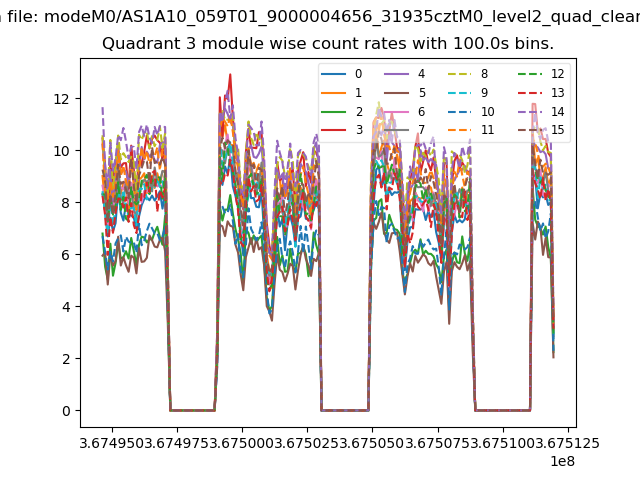
| Module-wise count rates for Quadrant C Data is divided into 100 sec bins |
 |
 |
| Module-wise count rates for Quadrant D Data is divided into 100 sec bins |
 |
 |
| Parameter | Plot |
|---|---|
| CZT HV Monitor | 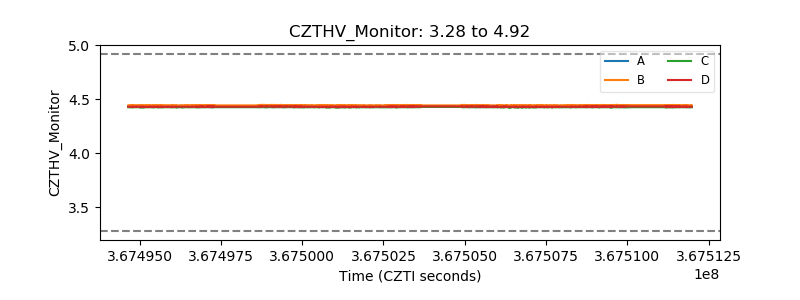 |
| D_VDD | 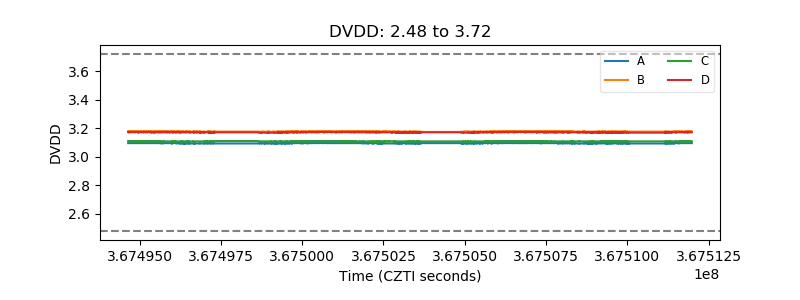 |
| Temperature 1 | 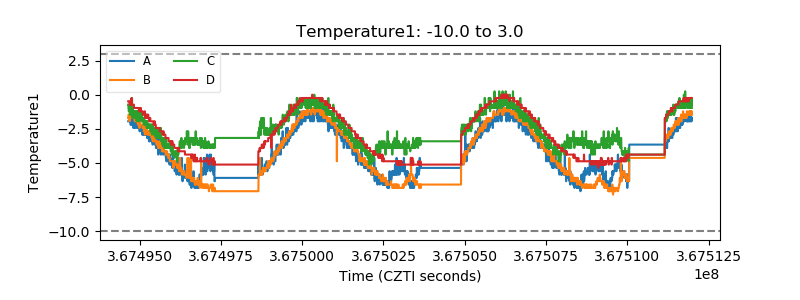 |
| Veto HV Monitor | 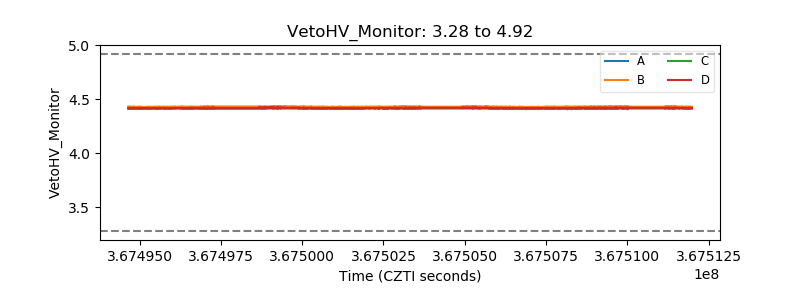 |
| Veto LLD | 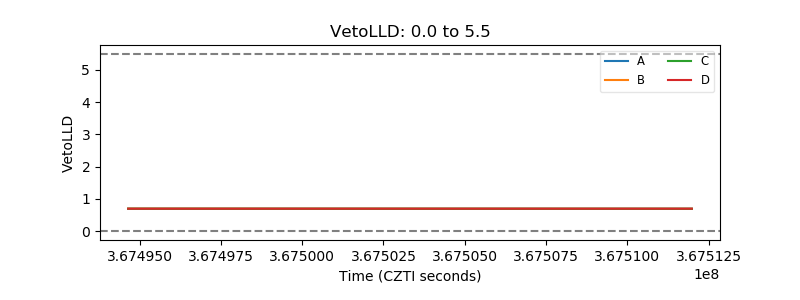 |
| Alpha Counter | 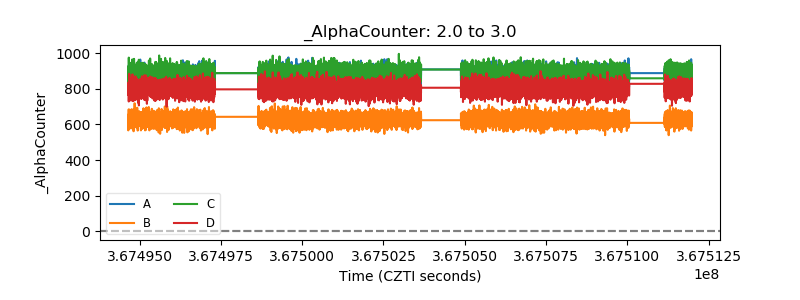 |
| _CPM_Rate | 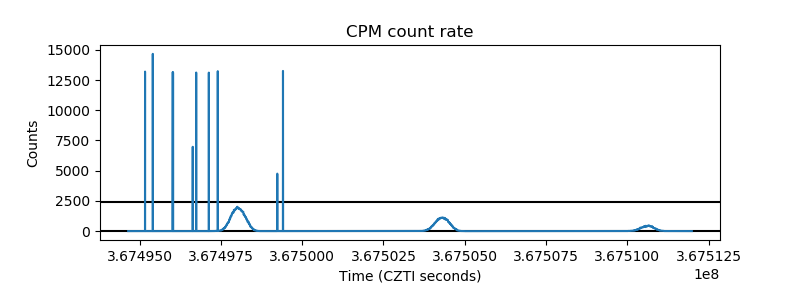 |
| CZT Counter | 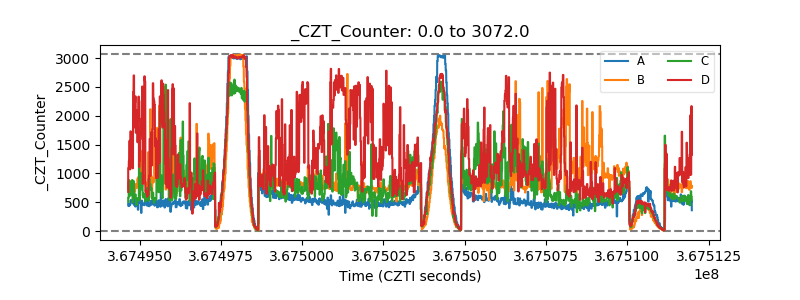 |
| +2.5 Volts monitor | 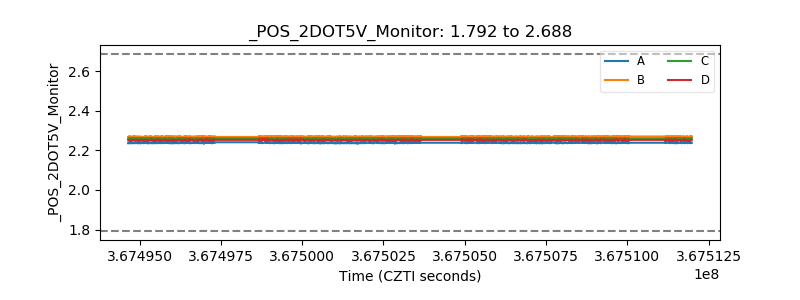 |
| +5 Volts monitor | 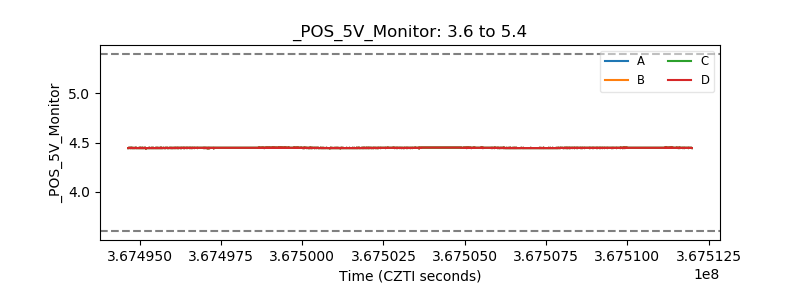 |
| _ROLL_ROT | 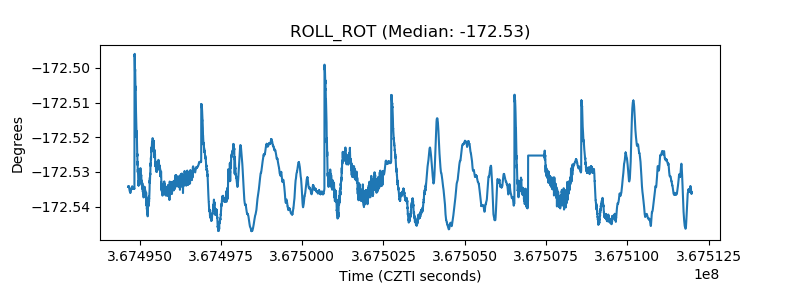 |
| _Roll_DEC | 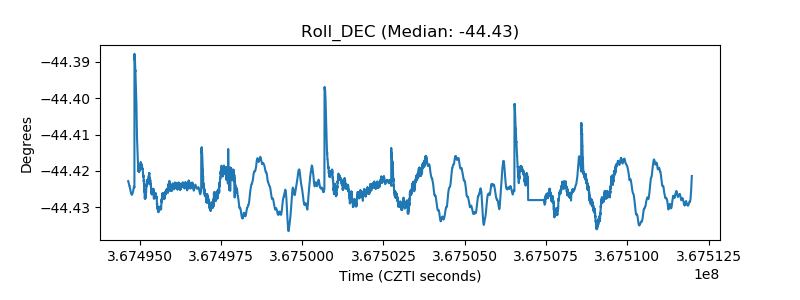 |
| _Roll_RA | 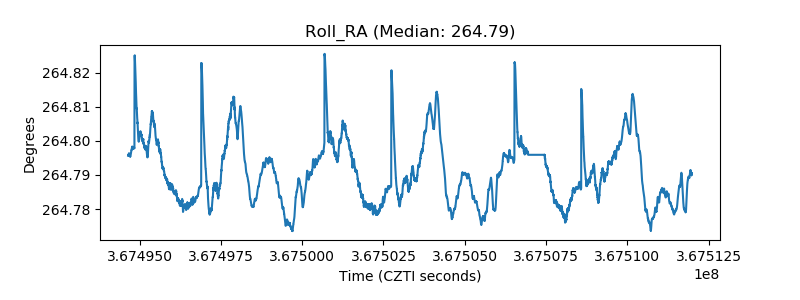 |
| Veto Counter | 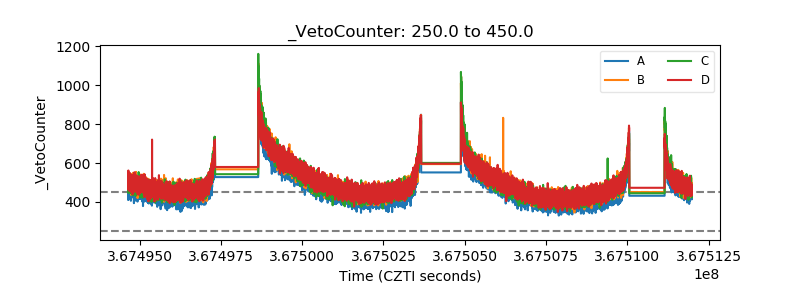 |