| Param | Original file | Final file |
|---|---|---|
| Filename | modeM0/AS1C06_002T04_9000004660_31938cztM0_level2.evt | modeM0/AS1C06_002T04_9000004660_31938cztM0_level2_quad_clean.evt |
| Size (bytes) | 717,459,840 | 112,152,960 |
| Size | 684.2 MB | 107.0 MB |
| Events in quadrant A | 3,516,168 | 773,028 |
| Events in quadrant B | 5,807,445 | 745,035 |
| Events in quadrant C | 5,811,522 | 695,765 |
| Events in quadrant D | 6,125,746 | 699,655 |
| Mode SS | |||
|---|---|---|---|
| Quadrant | BADHDUFLAG | Total packets | Discarded packets |
| A | 0 | 154 | 12 |
| B | 0 | 154 | 12 |
| C | 0 | 153 | 10 |
| D | 0 | 154 | 14 |
| Mode M0 | |||
|---|---|---|---|
| Quadrant | BADHDUFLAG | Total packets | Discarded packets |
| A | 0 | 16494 | 1433 |
| B | 0 | 24264 | 1807 |
| C | 0 | 23117 | 1120 |
| D | 0 | 24732 | 1821 |
| Mode M9 | |||
|---|---|---|---|
| Quadrant | BADHDUFLAG | Total packets | Discarded packets |
| A | 0 | 4 | 0 |
| B | 0 | 5 | 0 |
| C | 0 | 5 | 0 |
| D | 0 | 5 | 0 |
| Quadrant | Total seconds | Saturated seconds | Saturation percentage |
|---|---|---|---|
| A | 6938 | 86 | 1.239550% |
| B | 6888 | 321 | 4.660279% |
| C | 6946 | 875 | 12.597178% |
| D | 6915 | 475 | 6.869125% |
Noise dominated data is calculated using 1-second bins in cleaned event files. If a bin has >2000 counts, and if more than 50% of those come from <1% of pixels, then it is considered to be noise-dominated and hence unusable.
| Quadrant | # 1 sec bins | Bins with >0 counts | Bins with >2000 counts | High rate bins dominated by noise | Noise dominated (total time) | Noise dominated (detector-on time) | Marked lightcurve |
|---|---|---|---|---|---|---|---|
| A | 7929 | 7004 | 24 | 24 | 0.30% | 0.34% | 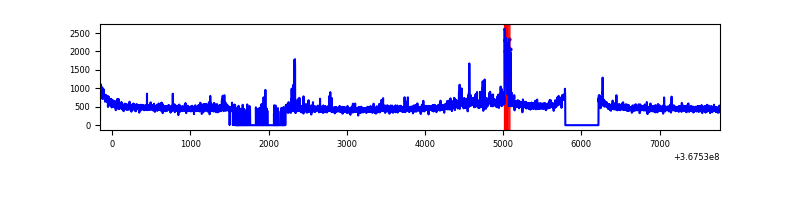 |
| B | 7929 | 6928 | 118 | 118 | 1.49% | 1.70% | 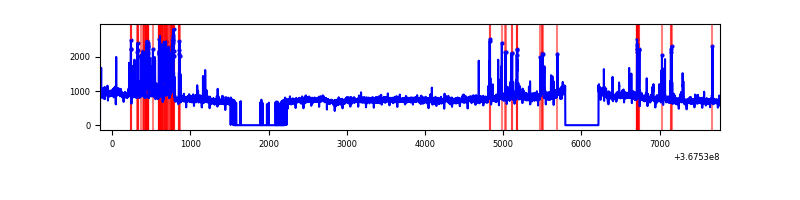 |
| C | 7928 | 7002 | 210 | 210 | 2.65% | 3.00% | 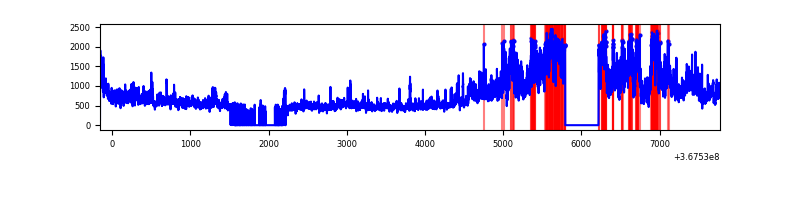 |
| D | 7928 | 6956 | 298 | 298 | 3.76% | 4.28% | 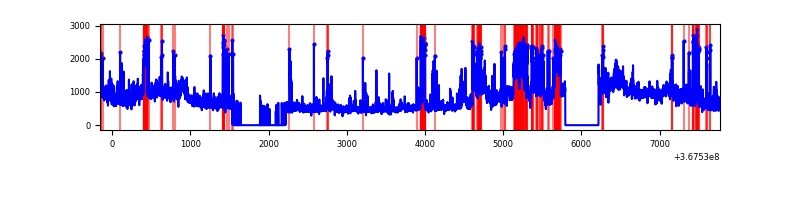 |
Top three noisy pixels from each quadrant. If the there are fewer than three noisy pixels in the level2.evt file, extra rows are filled as -1
| Pixel properties | Quadrant properties | ||||||
|---|---|---|---|---|---|---|---|
| Quadrant | DetID | PixID | Counts | Sigma | Mean | Median | Sigma |
| A | 12 | 96 | 248998 | 1469.27 | 841 | 824 | 168.9 |
| A | 13 | 6 | 21154 | 120.36 | 841 | 824 | 168.9 |
| A | 13 | 254 | 12987 | 72.01 | 841 | 824 | 168.9 |
| B | 6 | 159 | 2009828 | 13056.97 | 818 | 796 | 153.9 |
| B | 5 | 172 | 435535 | 2825.43 | 818 | 796 | 153.9 |
| B | 10 | 245 | 50188 | 321.01 | 818 | 796 | 153.9 |
| C | 3 | 233 | 2489507 | 13610.14 | 778 | 782 | 182.9 |
| C | 14 | 238 | 146217 | 795.34 | 778 | 782 | 182.9 |
| C | 0 | 10 | 51442 | 277.05 | 778 | 782 | 182.9 |
| D | 8 | 195 | 1393532 | 7361.9 | 799 | 779 | 189.2 |
| D | 12 | 33 | 959040 | 5065.24 | 799 | 779 | 189.2 |
| D | 13 | 249 | 295302 | 1556.81 | 799 | 779 | 189.2 |
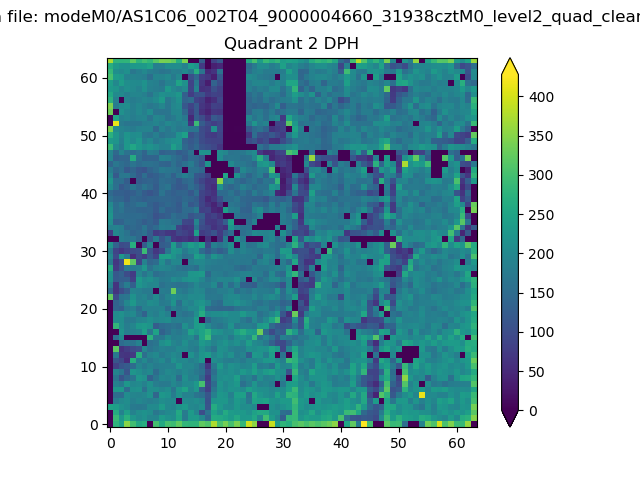
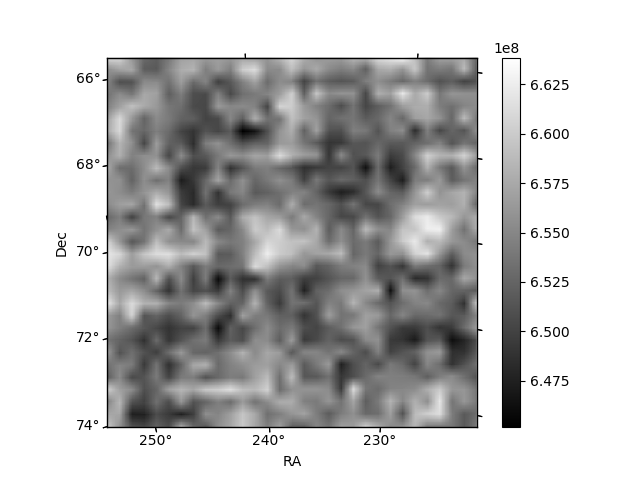
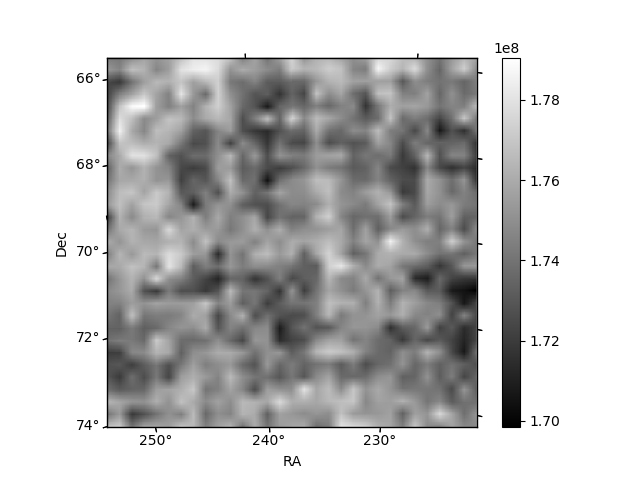
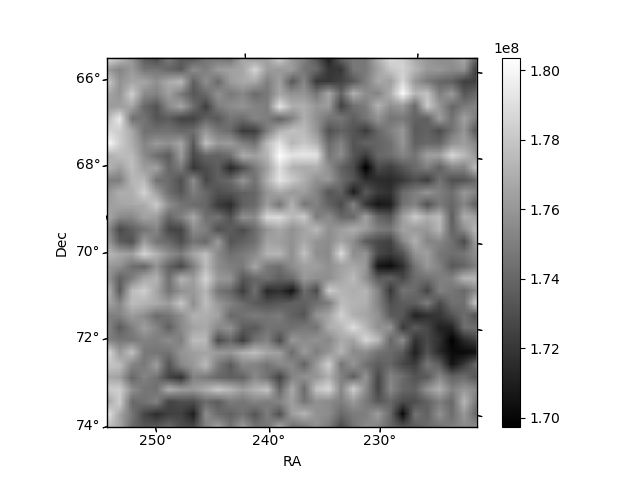
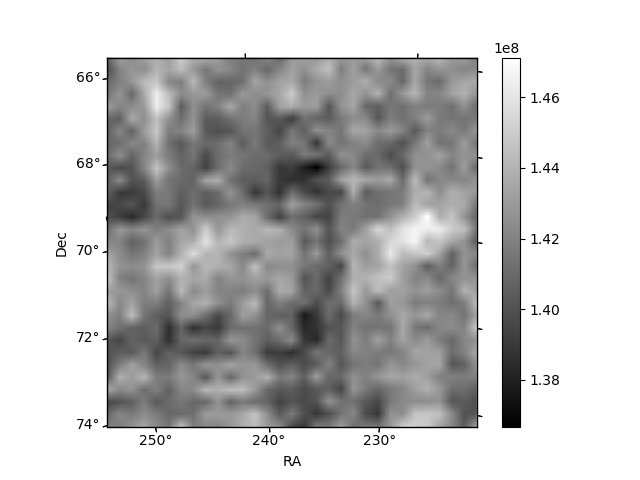
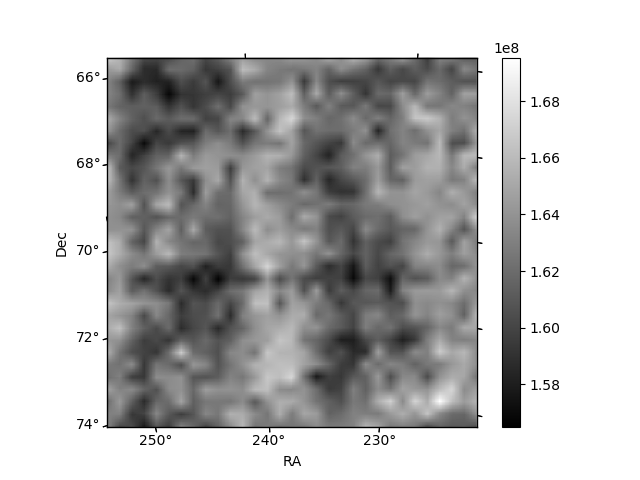
Histogram calculated using DETX and DETY for each event in the final _common_clean file
| Quadrant A | 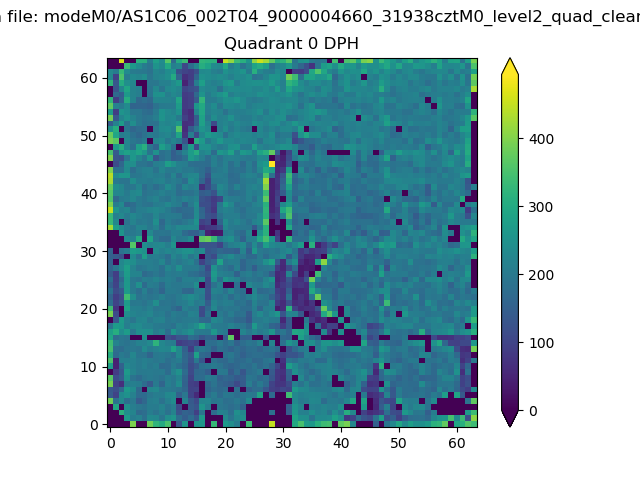 |
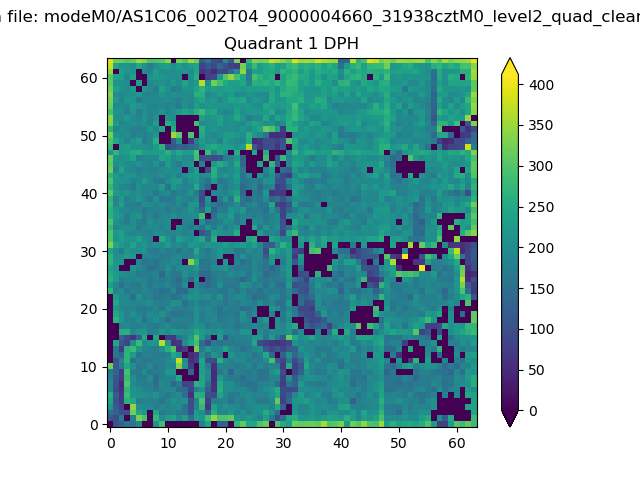 |
Quadrant B |
|---|---|---|---|
| Quadrant D | 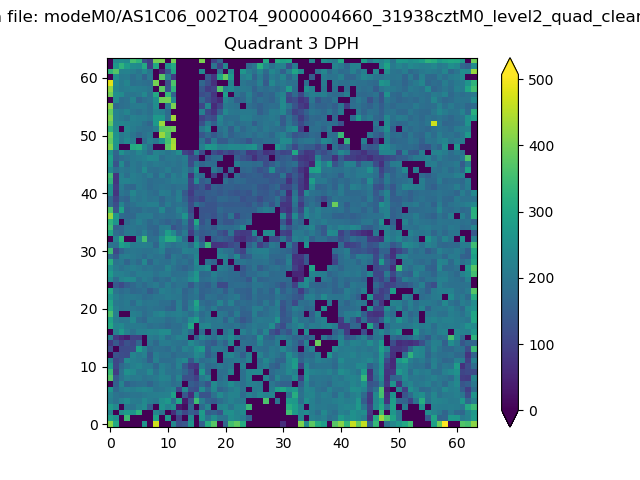 |
 |
Quadrant C |
| Plot type | Count rate plots | Images |
|---|---|---|
| Comparison with Poisson distribution Blue bars denote a histogram of data divided into 1 sec bins. Red curve is a Poisson curve with rate = median count rate of data. |
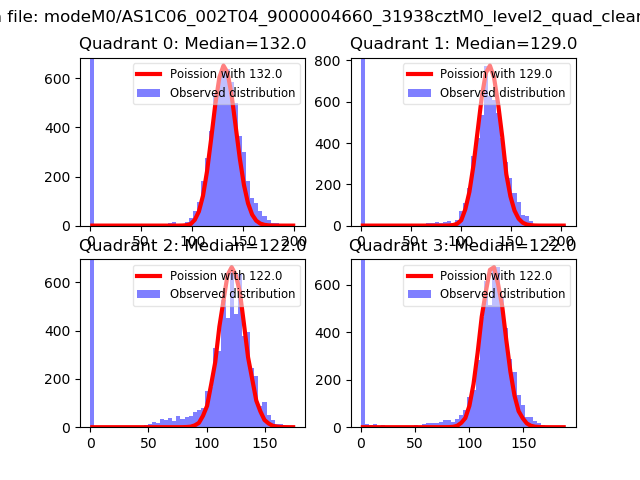 |
 |
| Quadrant-wise count rates Data is divided into 100 sec bins |
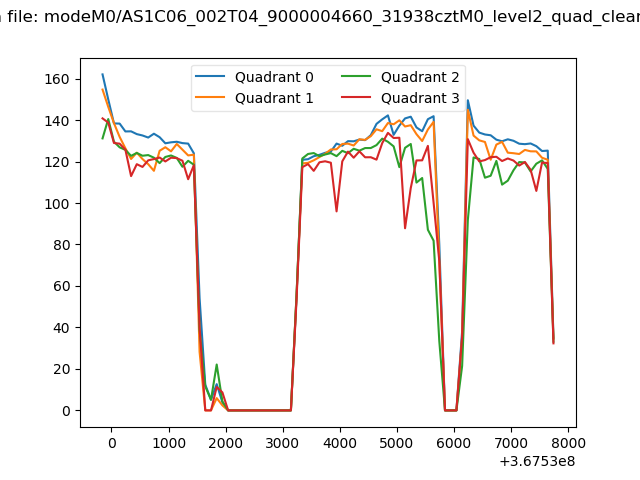 |
|
| Module-wise count rates for Quadrant A Data is divided into 100 sec bins |
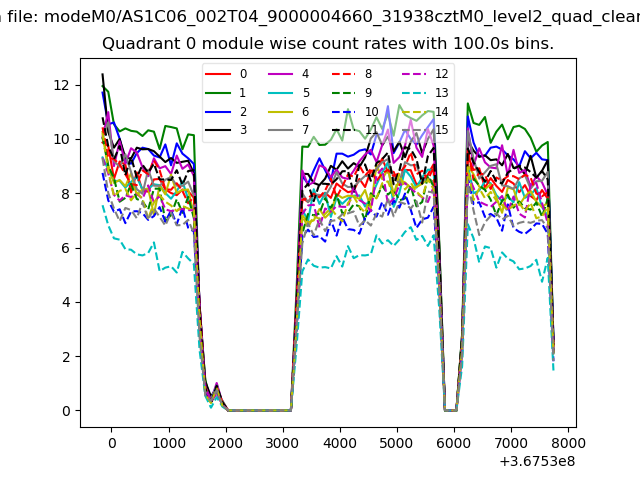 |
 |
| Module-wise count rates for Quadrant B Data is divided into 100 sec bins |
 |
 |
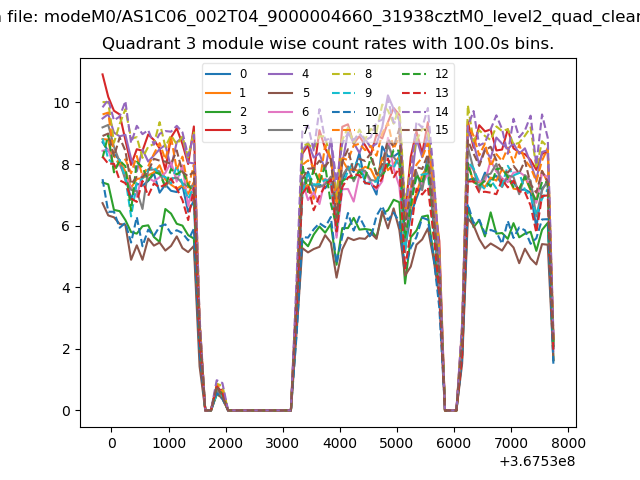
| Module-wise count rates for Quadrant C Data is divided into 100 sec bins |
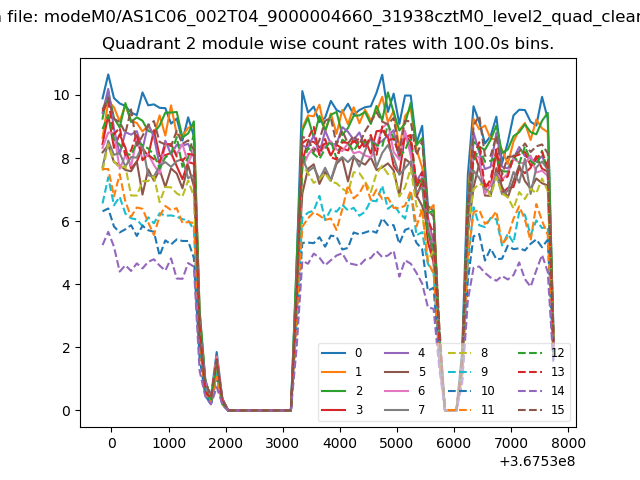 |
 |
| Module-wise count rates for Quadrant D Data is divided into 100 sec bins |
 |
 |
| Parameter | Plot |
|---|---|
| CZT HV Monitor | 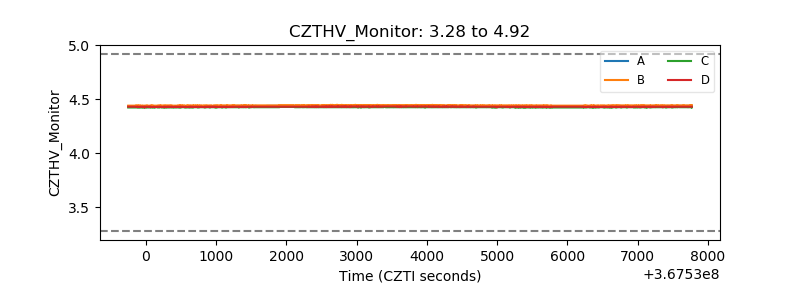 |
| D_VDD | 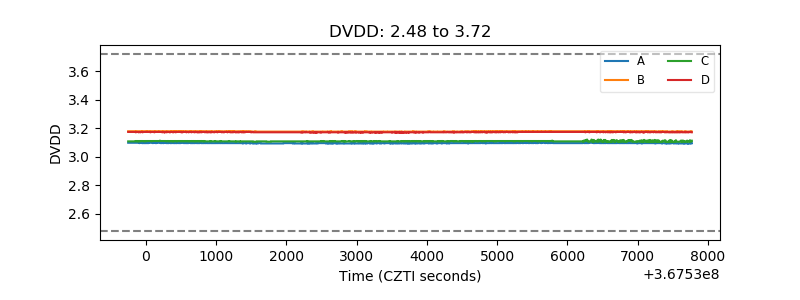 |
| Temperature 1 | 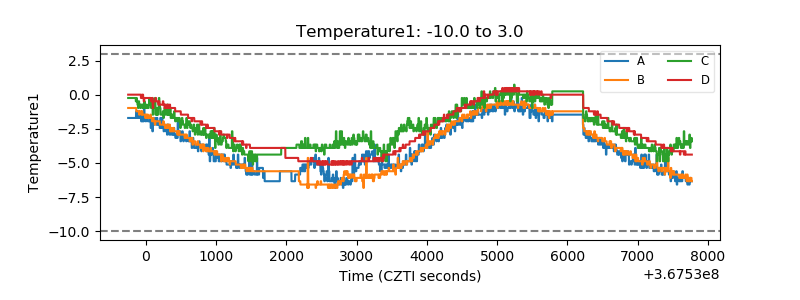 |
| Veto HV Monitor | 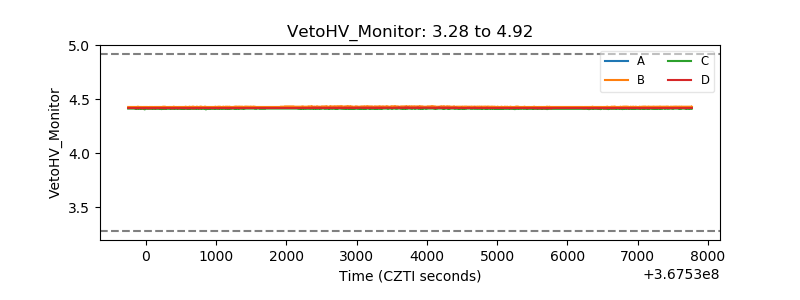 |
| Veto LLD | 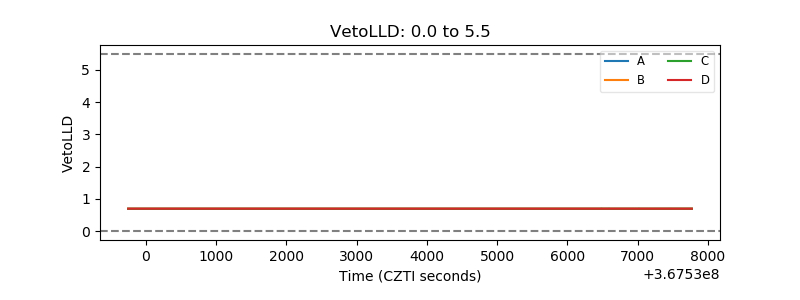 |
| Alpha Counter | 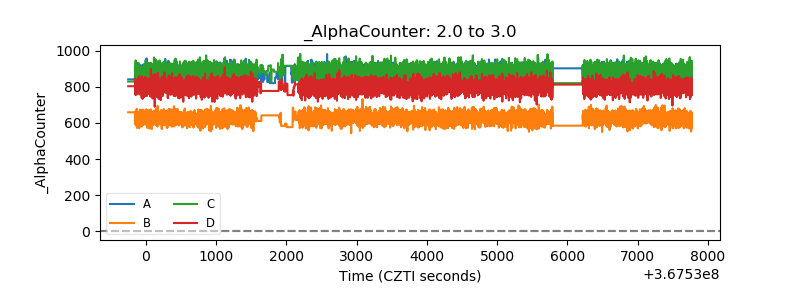 |
| _CPM_Rate | 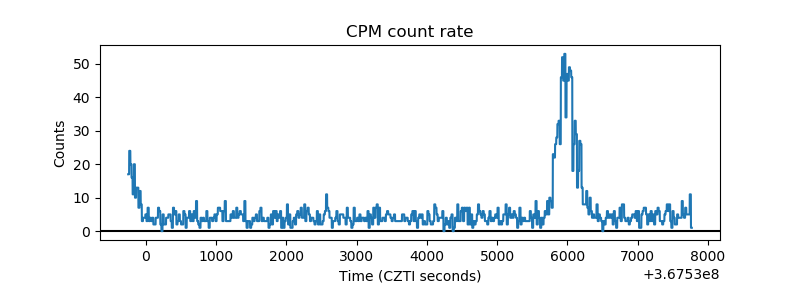 |
| CZT Counter | 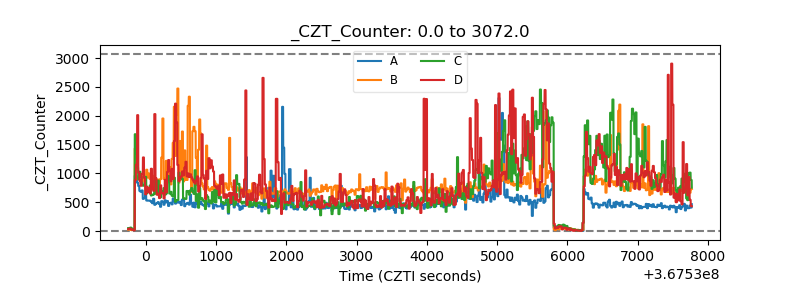 |
| +2.5 Volts monitor |  |
| +5 Volts monitor |  |
| _ROLL_ROT | 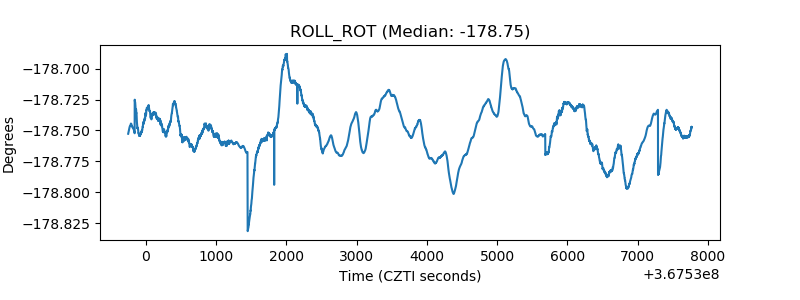 |
| _Roll_DEC | 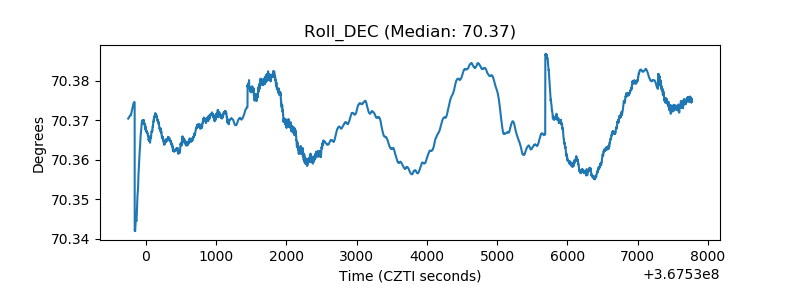 |
| _Roll_RA | 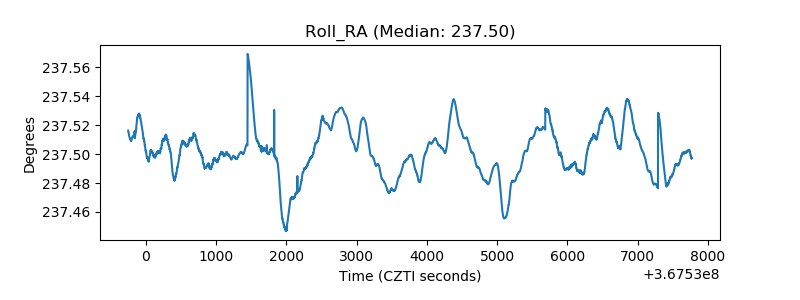 |
| Veto Counter | 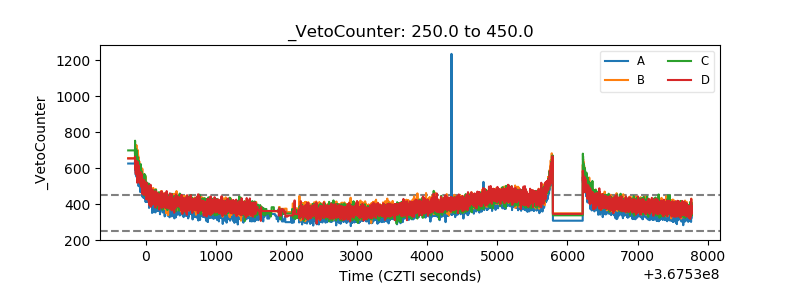 |