| Param | Original file | Final file |
|---|---|---|
| Filename | modeM0/AS1C06_002T04_9000004660_31941cztM0_level2.evt | modeM0/AS1C06_002T04_9000004660_31941cztM0_level2_quad_clean.evt |
| Size (bytes) | 561,078,720 | 52,277,760 |
| Size | 535.1 MB | 49.9 MB |
| Events in quadrant A | 2,219,941 | 335,257 |
| Events in quadrant B | 4,133,564 | 324,973 |
| Events in quadrant C | 7,022,563 | 265,940 |
| Events in quadrant D | 3,283,237 | 310,681 |
| Mode SS | |||
|---|---|---|---|
| Quadrant | BADHDUFLAG | Total packets | Discarded packets |
| A | 0 | 109 | 11 |
| B | 0 | 110 | 12 |
| C | 0 | 107 | 9 |
| D | 0 | 112 | 14 |
| Mode M0 | |||
|---|---|---|---|
| Quadrant | BADHDUFLAG | Total packets | Discarded packets |
| A | 0 | 11073 | 1109 |
| B | 0 | 17998 | 1807 |
| C | 0 | 26994 | 2683 |
| D | 0 | 14626 | 1695 |
| Mode M9 | |||
|---|---|---|---|
| Quadrant | BADHDUFLAG | Total packets | Discarded packets |
| A | 0 | 5 | 5 |
| B | 0 | 1 | 1 |
| C | 0 | 2 | 2 |
| D | 0 | 1 | 1 |
| Quadrant | Total seconds | Saturated seconds | Saturation percentage |
|---|---|---|---|
| A | 4929 | 4 | 0.081152% |
| B | 4916 | 165 | 3.356387% |
| C | 4913 | 1586 | 32.281702% |
| D | 4923 | 132 | 2.681292% |
Noise dominated data is calculated using 1-second bins in cleaned event files. If a bin has >2000 counts, and if more than 50% of those come from <1% of pixels, then it is considered to be noise-dominated and hence unusable.
| Quadrant | # 1 sec bins | Bins with >0 counts | Bins with >2000 counts | High rate bins dominated by noise | Noise dominated (total time) | Noise dominated (detector-on time) | Marked lightcurve |
|---|---|---|---|---|---|---|---|
| A | 7314 | 4937 | 0 | 0 | 0.00% | 0.00% | 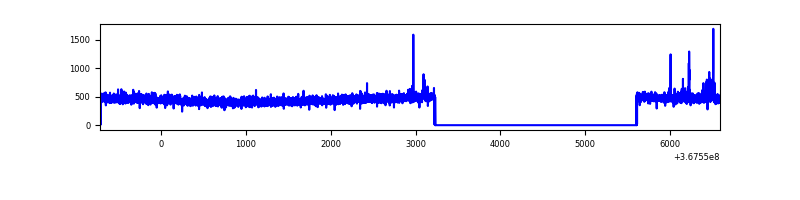 |
| B | 7308 | 4921 | 113 | 113 | 1.55% | 2.30% | 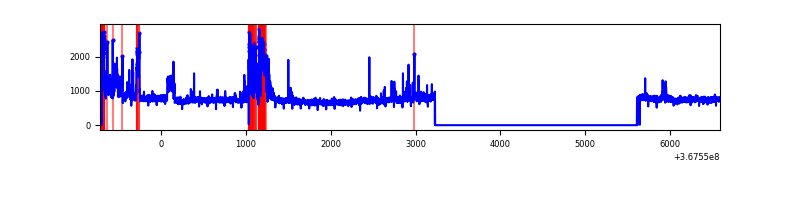 |
| C | 7315 | 4923 | 773 | 773 | 10.57% | 15.70% | 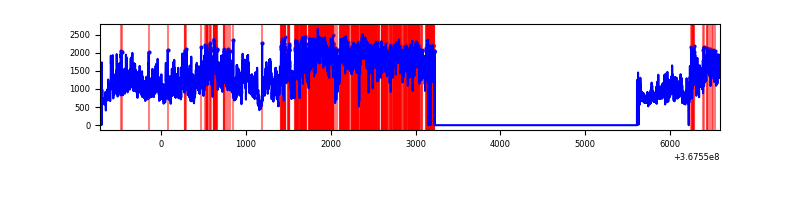 |
| D | 7311 | 4930 | 105 | 105 | 1.44% | 2.13% | 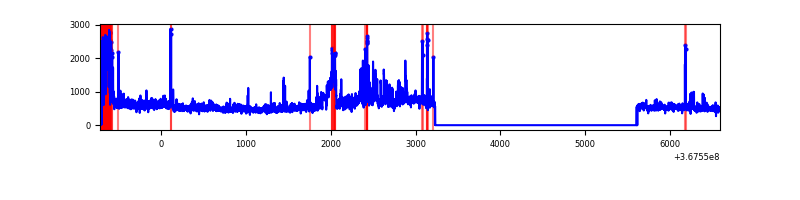 |
Top three noisy pixels from each quadrant. If the there are fewer than three noisy pixels in the level2.evt file, extra rows are filled as -1
| Pixel properties | Quadrant properties | ||||||
|---|---|---|---|---|---|---|---|
| Quadrant | DetID | PixID | Counts | Sigma | Mean | Median | Sigma |
| A | 12 | 96 | 36885 | 322.05 | 564 | 552 | 112.8 |
| A | 13 | 254 | 8933 | 74.29 | 564 | 552 | 112.8 |
| A | 13 | 6 | 6475 | 52.5 | 564 | 552 | 112.8 |
| B | 6 | 159 | 1379614 | 13002.4 | 550 | 536 | 106.1 |
| B | 4 | 80 | 286365 | 2694.89 | 550 | 536 | 106.1 |
| B | 10 | 245 | 240837 | 2265.64 | 550 | 536 | 106.1 |
| C | 3 | 233 | 4961710 | 43288.39 | 490 | 493 | 114.6 |
| C | 14 | 238 | 92129 | 799.56 | 490 | 493 | 114.6 |
| C | 14 | 254 | 19899 | 169.32 | 490 | 493 | 114.6 |
| D | 8 | 195 | 714188 | 5541.07 | 534 | 519 | 128.8 |
| D | 13 | 249 | 211661 | 1639.35 | 534 | 519 | 128.8 |
| D | 7 | 238 | 106962 | 826.44 | 534 | 519 | 128.8 |
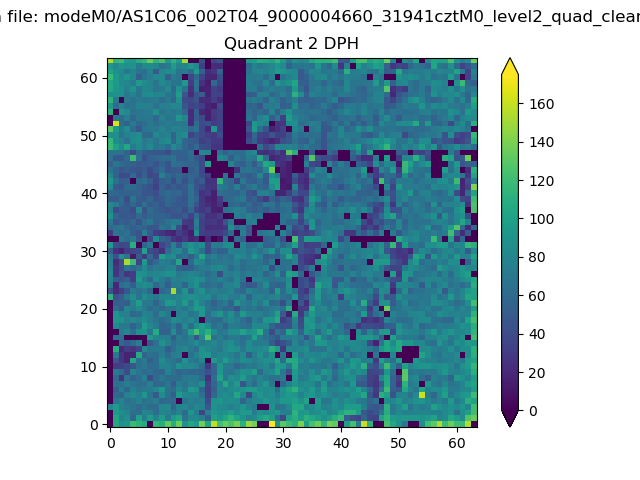
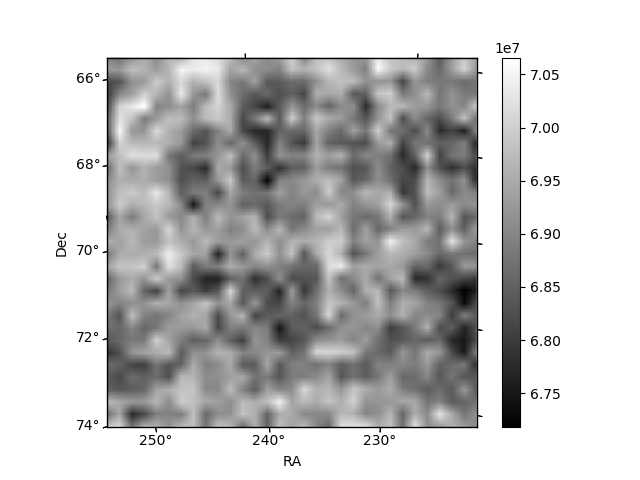
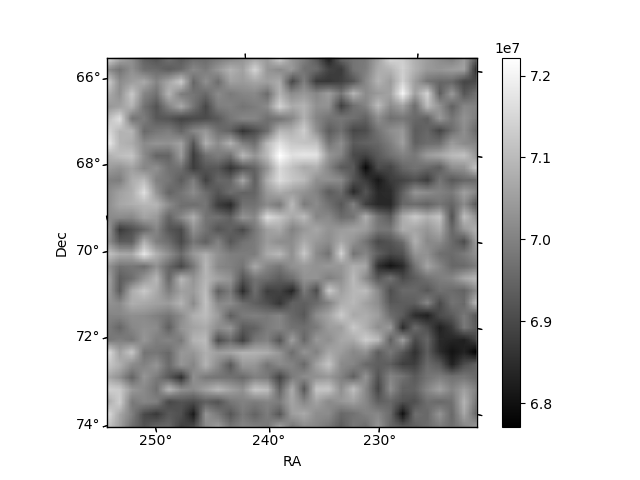
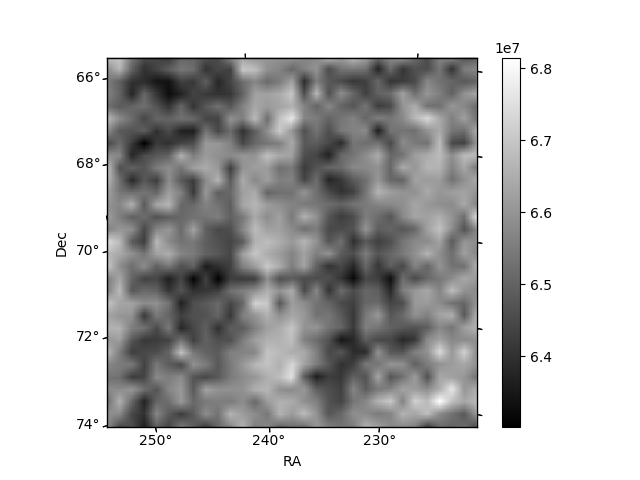
Histogram calculated using DETX and DETY for each event in the final _common_clean file
| Quadrant A | 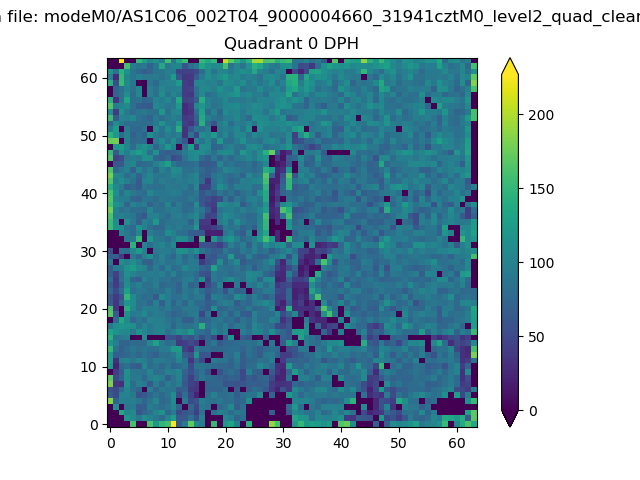 |
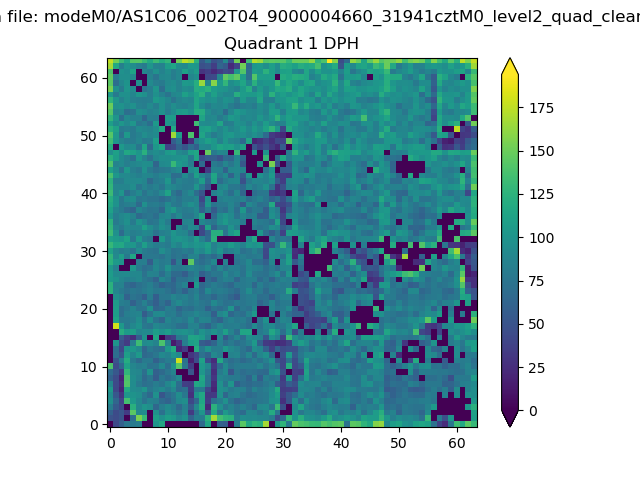 |
Quadrant B |
|---|---|---|---|
| Quadrant D | 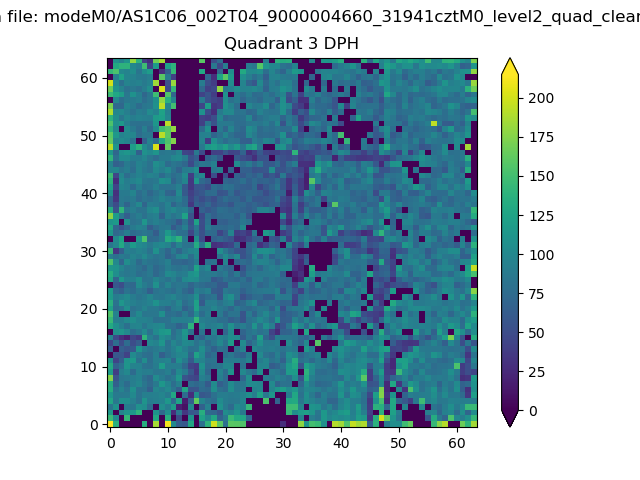 |
 |
Quadrant C |
| Plot type | Count rate plots | Images |
|---|---|---|
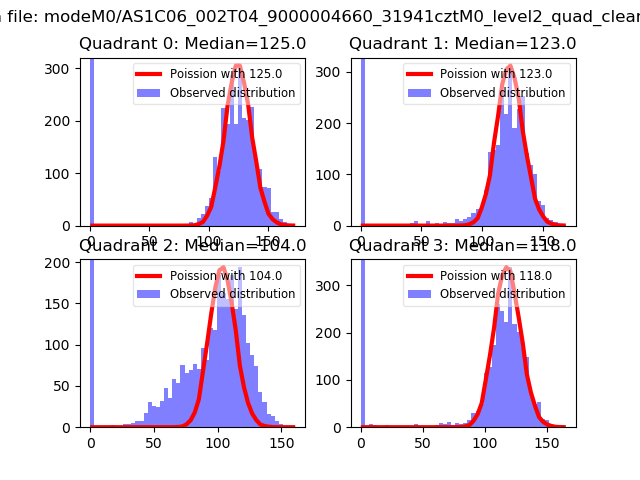
| Comparison with Poisson distribution Blue bars denote a histogram of data divided into 1 sec bins. Red curve is a Poisson curve with rate = median count rate of data. |
 |
 |
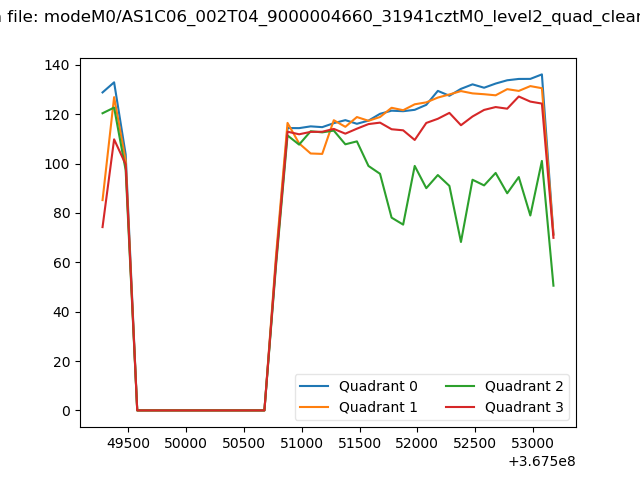
| Quadrant-wise count rates Data is divided into 100 sec bins |
 |
|
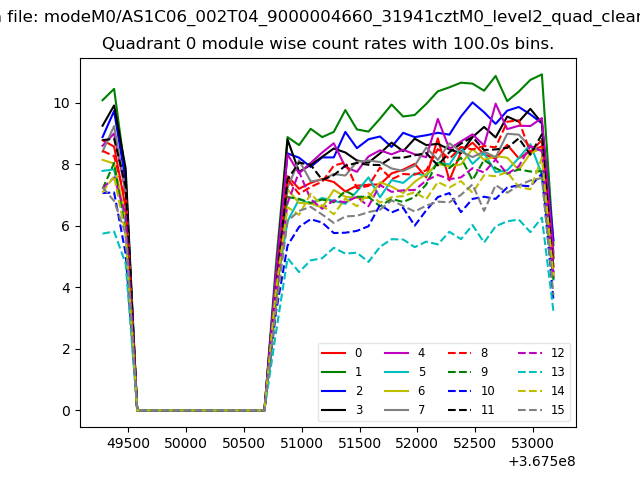
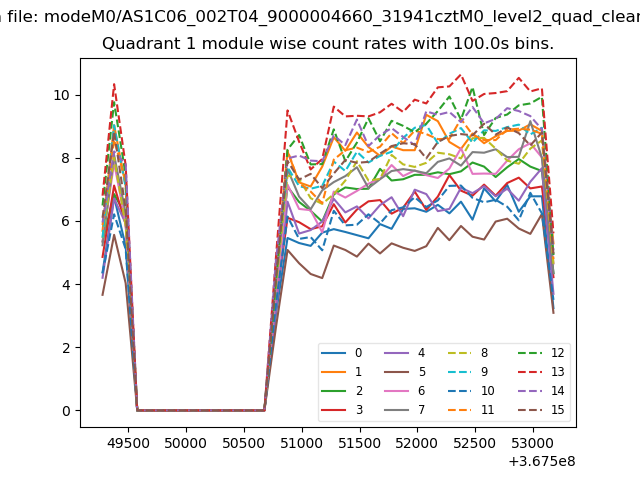
| Module-wise count rates for Quadrant A Data is divided into 100 sec bins |
 |
 |
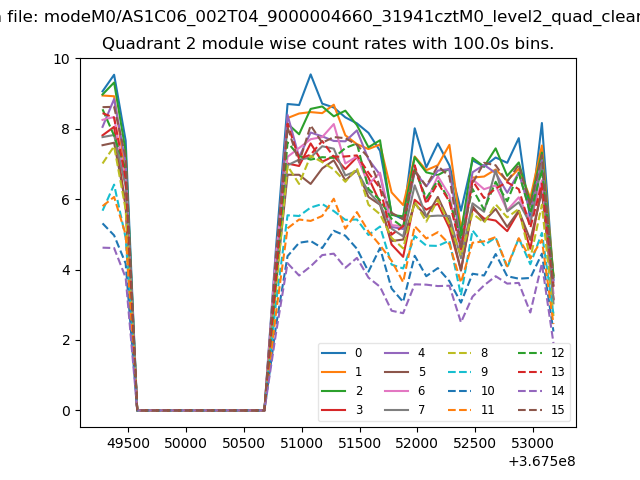
| Module-wise count rates for Quadrant B Data is divided into 100 sec bins |
 |
 |
| Module-wise count rates for Quadrant C Data is divided into 100 sec bins |
 |
 |
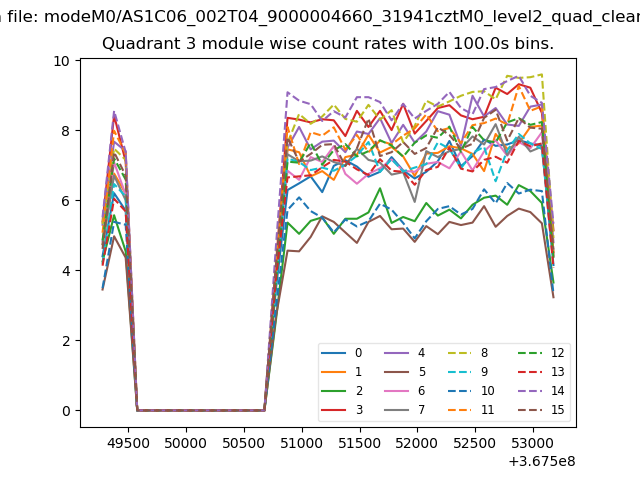
| Module-wise count rates for Quadrant D Data is divided into 100 sec bins |
 |
 |
| Parameter | Plot |
|---|---|
| CZT HV Monitor | 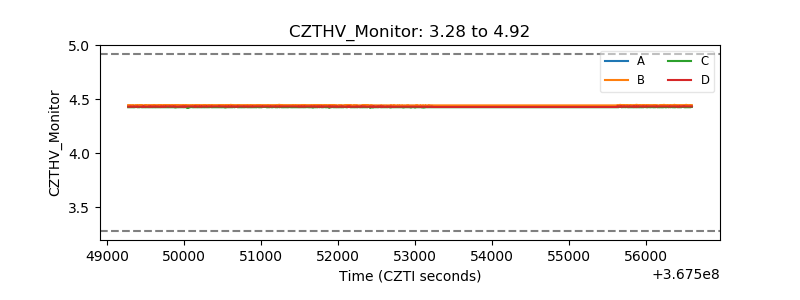 |
| D_VDD | 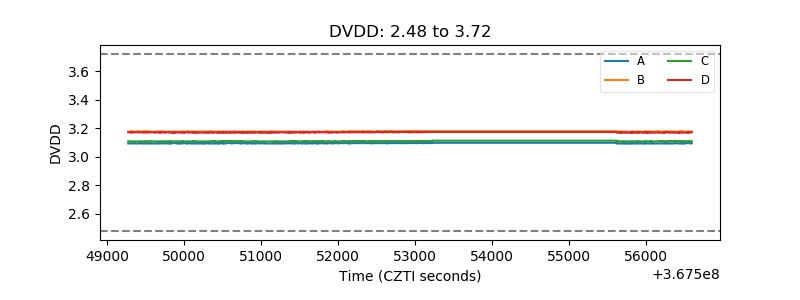 |
| Temperature 1 | 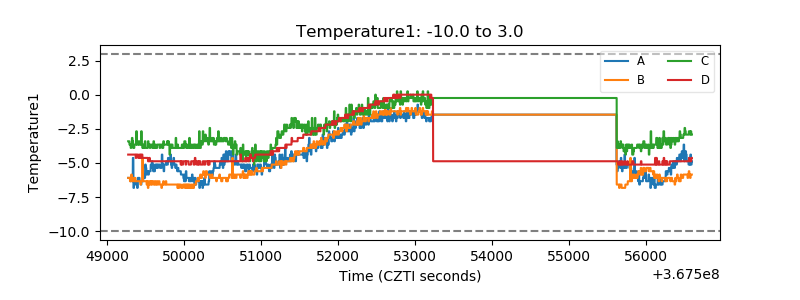 |
| Veto HV Monitor | 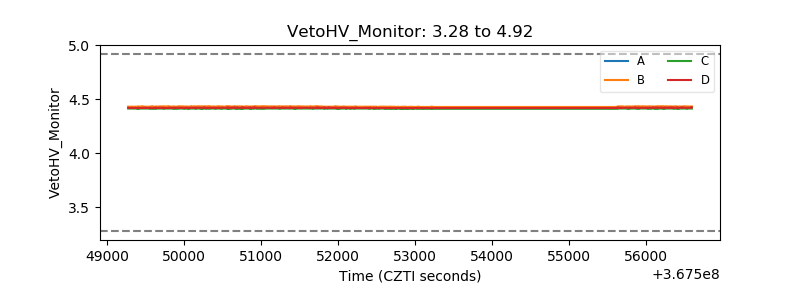 |
| Veto LLD | 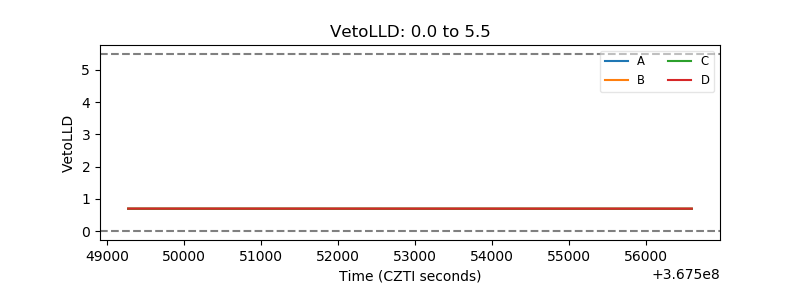 |
| Alpha Counter | 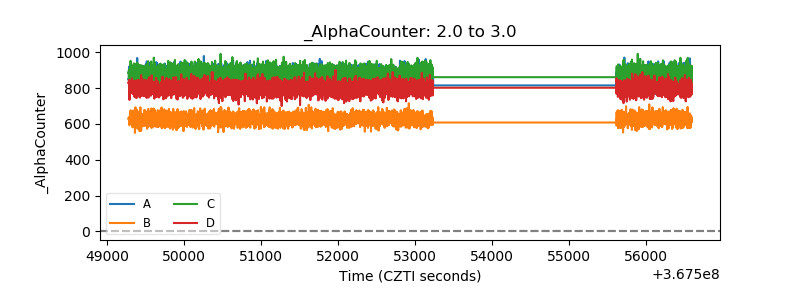 |
| _CPM_Rate | 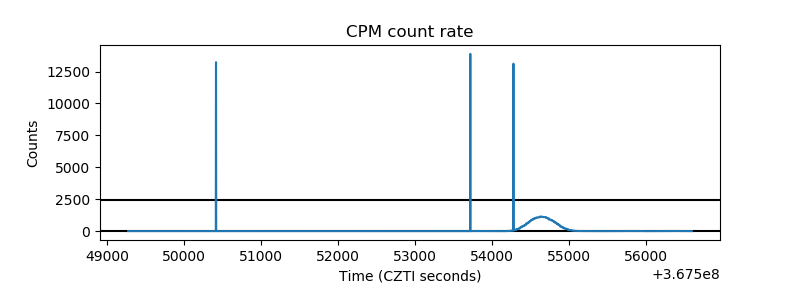 |
| CZT Counter | 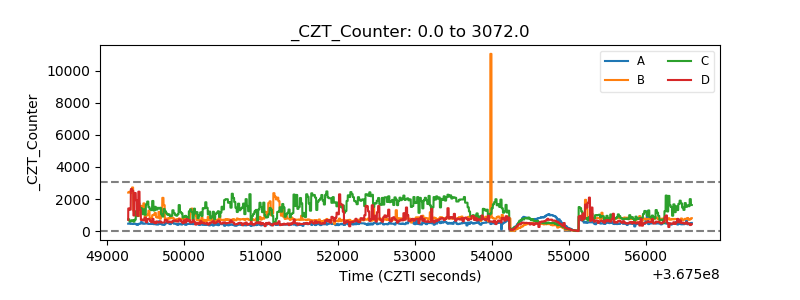 |
| +2.5 Volts monitor |  |
| +5 Volts monitor |  |
| _ROLL_ROT | 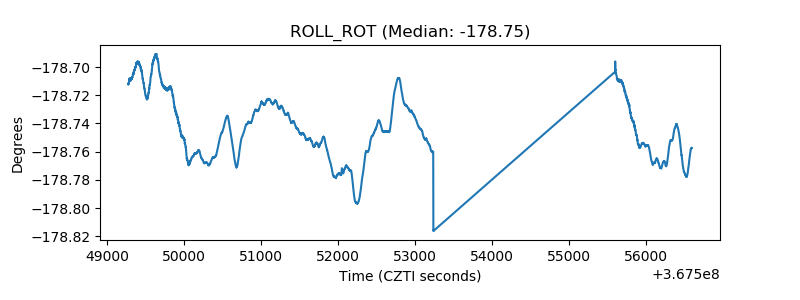 |
| _Roll_DEC | 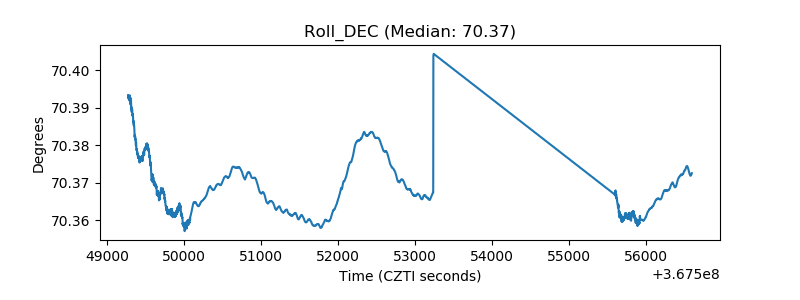 |
| _Roll_RA | 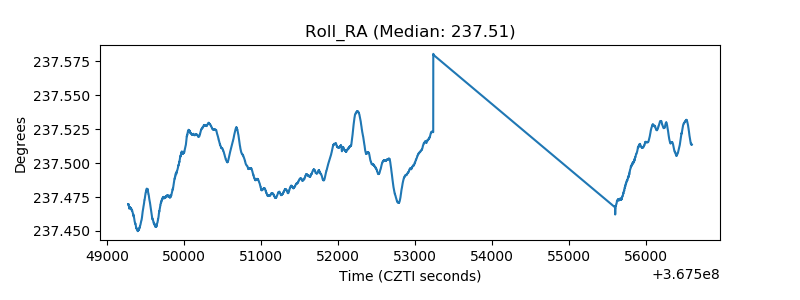 |
| Veto Counter | 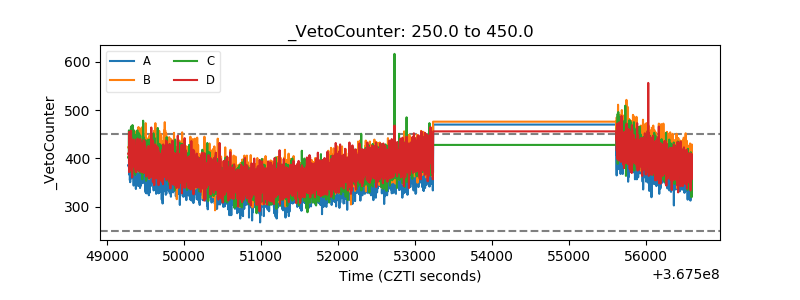 |