| Param | Original file | Final file |
|---|---|---|
| Filename | modeM0/AS1C06_002T04_9000004660_31944cztM0_level2.evt | modeM0/AS1C06_002T04_9000004660_31944cztM0_level2_quad_clean.evt |
| Size (bytes) | 1,757,848,320 | 156,623,040 |
| Size | 1.6 GB | 149.4 MB |
| Events in quadrant A | 8,042,942 | 997,589 |
| Events in quadrant B | 12,655,369 | 956,652 |
| Events in quadrant C | 19,529,359 | 798,675 |
| Events in quadrant D | 11,935,269 | 889,157 |
| Mode SS | |||
|---|---|---|---|
| Quadrant | BADHDUFLAG | Total packets | Discarded packets |
| A | 0 | 440 | 85 |
| B | 0 | 423 | 83 |
| C | 0 | 424 | 85 |
| D | 0 | 432 | 78 |
| Mode M0 | |||
|---|---|---|---|
| Quadrant | BADHDUFLAG | Total packets | Discarded packets |
| A | 0 | 43373 | 9056 |
| B | 0 | 66124 | 16782 |
| C | 0 | 91767 | 22935 |
| D | 0 | 61525 | 15076 |
| Mode M9 | |||
|---|---|---|---|
| Quadrant | BADHDUFLAG | Total packets | Discarded packets |
| A | 0 | 40 | 8 |
| B | 0 | 44 | 11 |
| C | 0 | 50 | 19 |
| D | 0 | 44 | 13 |
| Quadrant | Total seconds | Saturated seconds | Saturation percentage |
|---|---|---|---|
| A | 16532 | 114 | 0.689572% |
| B | 15707 | 460 | 2.928631% |
| C | 15346 | 4745 | 30.920109% |
| D | 15927 | 490 | 3.076537% |
Noise dominated data is calculated using 1-second bins in cleaned event files. If a bin has >2000 counts, and if more than 50% of those come from <1% of pixels, then it is considered to be noise-dominated and hence unusable.
| Quadrant | # 1 sec bins | Bins with >0 counts | Bins with >2000 counts | High rate bins dominated by noise | Noise dominated (total time) | Noise dominated (detector-on time) | Marked lightcurve |
|---|---|---|---|---|---|---|---|
| A | 25701 | 17869 | 8 | 8 | 0.03% | 0.04% |  |
| B | 25694 | 17042 | 155 | 155 | 0.60% | 0.91% | 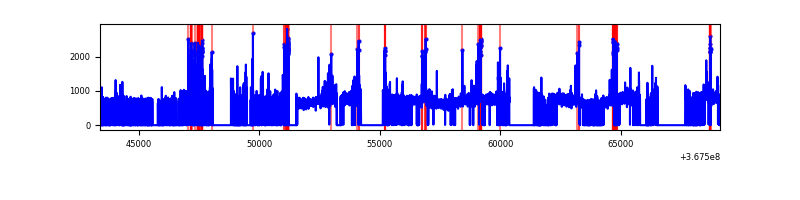 |
| C | 25697 | 16567 | 2005 | 2005 | 7.80% | 12.10% | 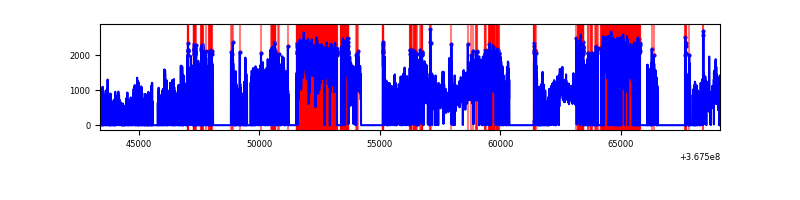 |
| D | 25682 | 17300 | 356 | 356 | 1.39% | 2.06% | 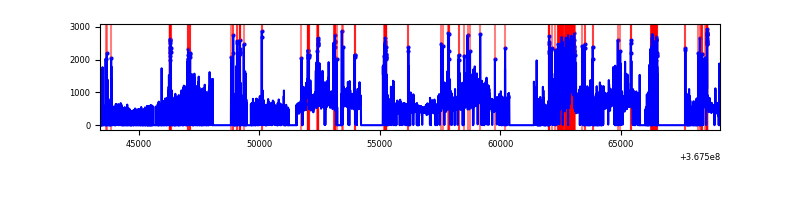 |
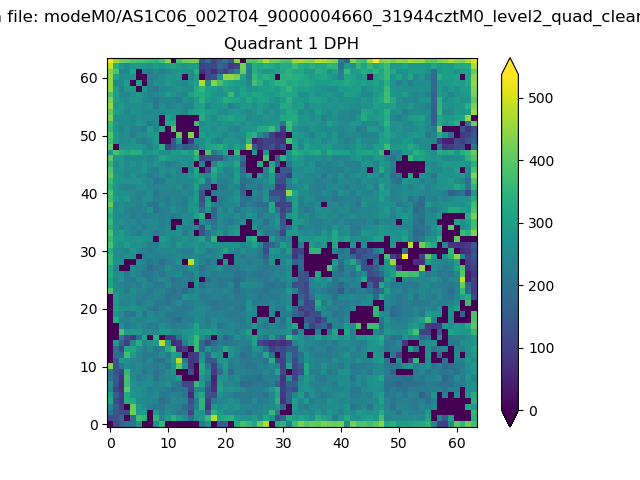
Top three noisy pixels from each quadrant. If the there are fewer than three noisy pixels in the level2.evt file, extra rows are filled as -1
| Pixel properties | Quadrant properties | ||||||
|---|---|---|---|---|---|---|---|
| Quadrant | DetID | PixID | Counts | Sigma | Mean | Median | Sigma |
| A | 12 | 96 | 204123 | 506.09 | 2023 | 1977 | 399.4 |
| A | 13 | 254 | 31615 | 74.2 | 2023 | 1977 | 399.4 |
| A | 3 | 137 | 20083 | 45.33 | 2023 | 1977 | 399.4 |
| B | 6 | 159 | 4369329 | 12407.34 | 1878 | 1829 | 352.0 |
| B | 5 | 255 | 248150 | 699.76 | 1878 | 1829 | 352.0 |
| B | 10 | 245 | 227472 | 641.01 | 1878 | 1829 | 352.0 |
| C | 3 | 233 | 12393206 | 33014.53 | 1627 | 1634 | 375.3 |
| C | 14 | 238 | 364839 | 967.68 | 1627 | 1634 | 375.3 |
| C | 0 | 10 | 207928 | 549.62 | 1627 | 1634 | 375.3 |
| D | 8 | 195 | 2510791 | 5727.99 | 1856 | 1805 | 438.0 |
| D | 12 | 33 | 1372629 | 3129.58 | 1856 | 1805 | 438.0 |
| D | 13 | 249 | 391797 | 890.35 | 1856 | 1805 | 438.0 |
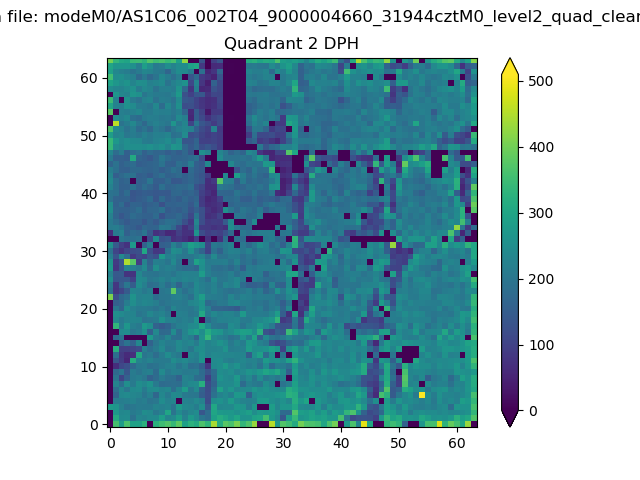
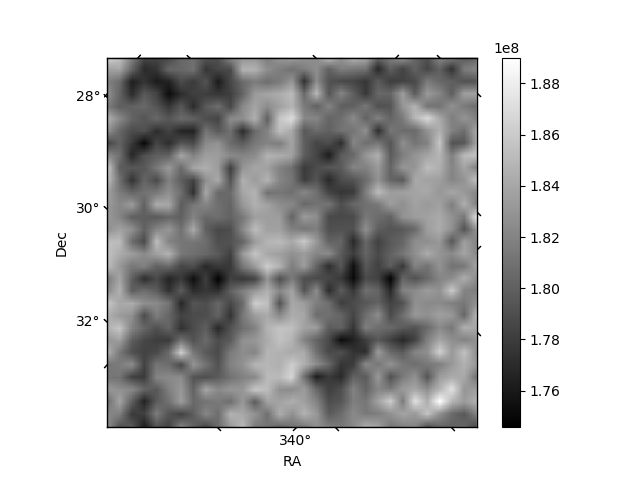
Histogram calculated using DETX and DETY for each event in the final _common_clean file
| Quadrant A |  |
 |
Quadrant B |
|---|---|---|---|
| Quadrant D | 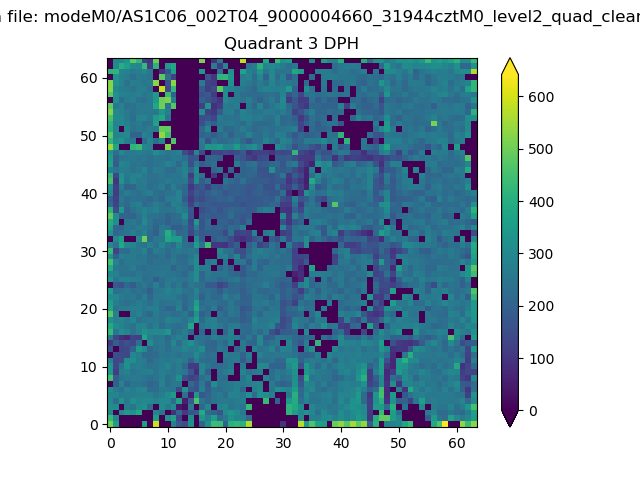 |
 |
Quadrant C |
| Plot type | Count rate plots | Images |
|---|---|---|
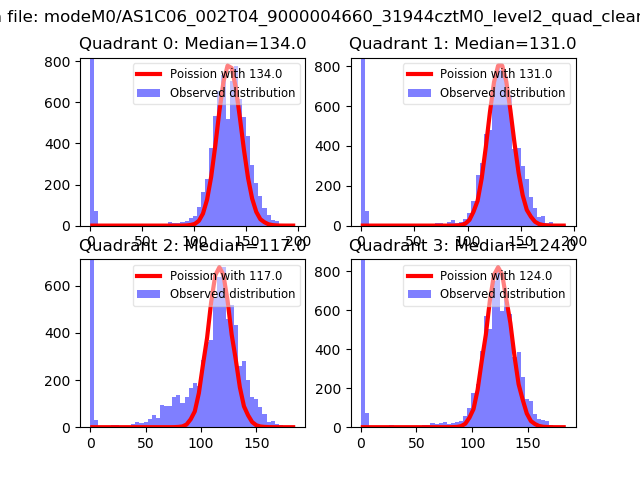
| Comparison with Poisson distribution Blue bars denote a histogram of data divided into 1 sec bins. Red curve is a Poisson curve with rate = median count rate of data. |
 |
 |
| Quadrant-wise count rates Data is divided into 100 sec bins |
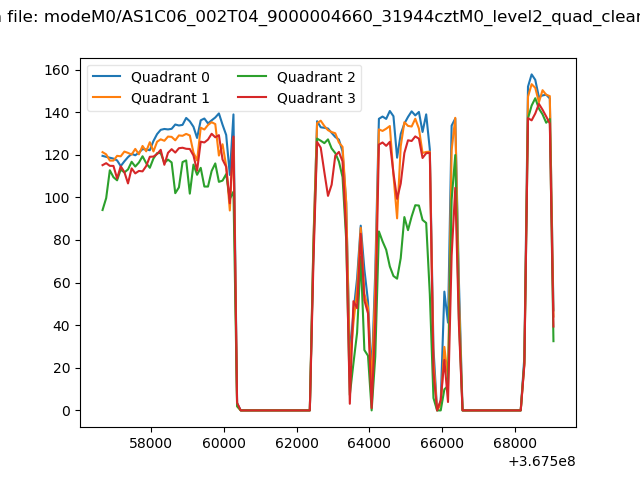 |
|
| Module-wise count rates for Quadrant A Data is divided into 100 sec bins |
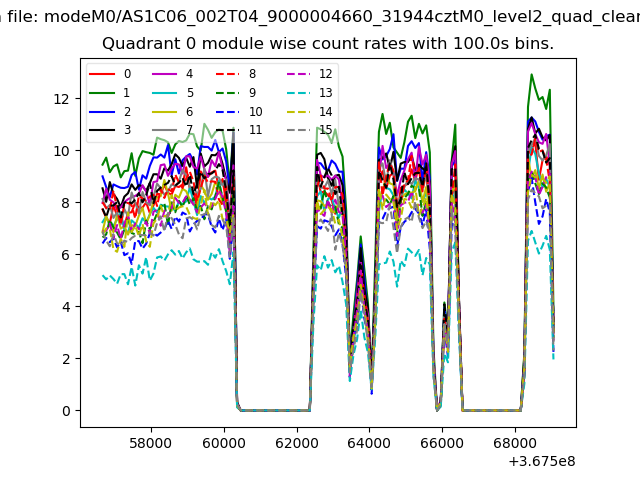 |
 |
| Module-wise count rates for Quadrant B Data is divided into 100 sec bins |
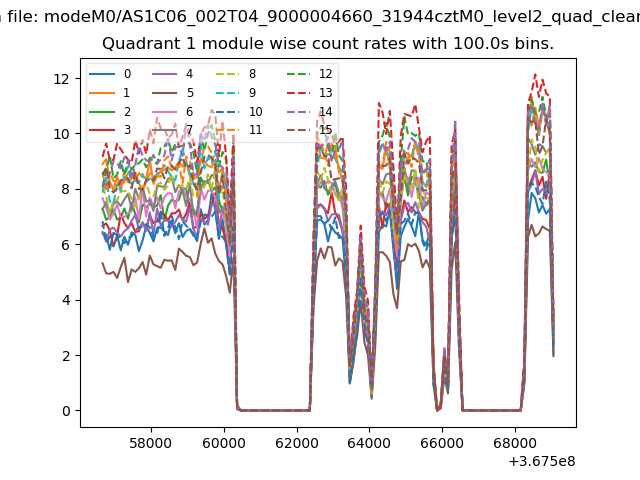 |
 |
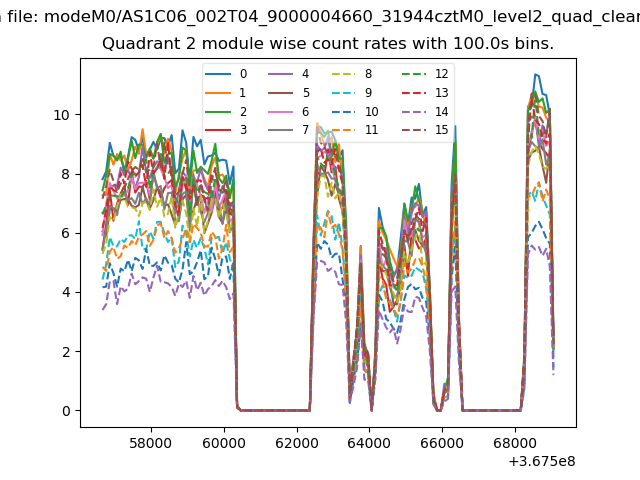
| Module-wise count rates for Quadrant C Data is divided into 100 sec bins |
 |
 |
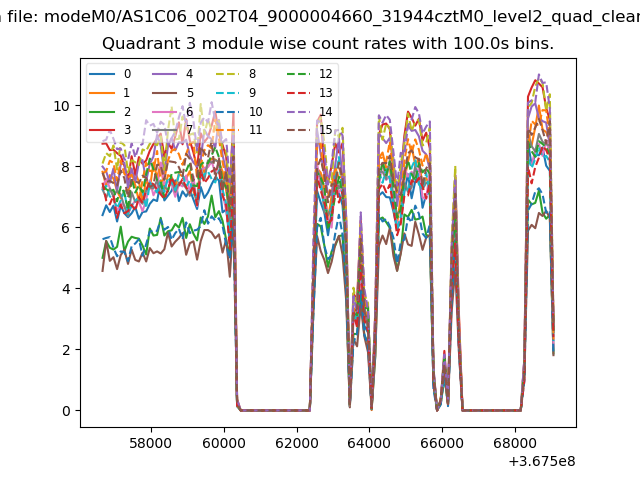
| Module-wise count rates for Quadrant D Data is divided into 100 sec bins |
 |
 |
| Parameter | Plot |
|---|---|
| CZT HV Monitor |  |
| D_VDD | 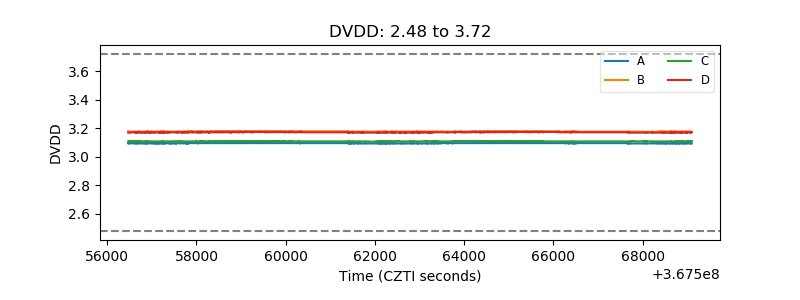 |
| Temperature 1 | 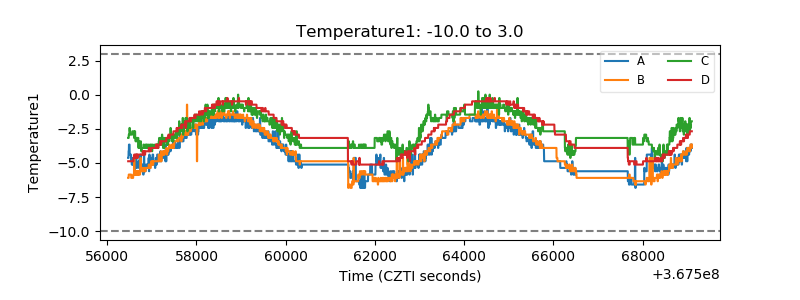 |
| Veto HV Monitor | 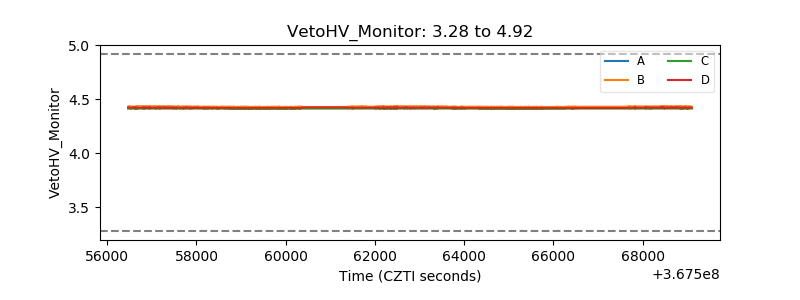 |
| Veto LLD | 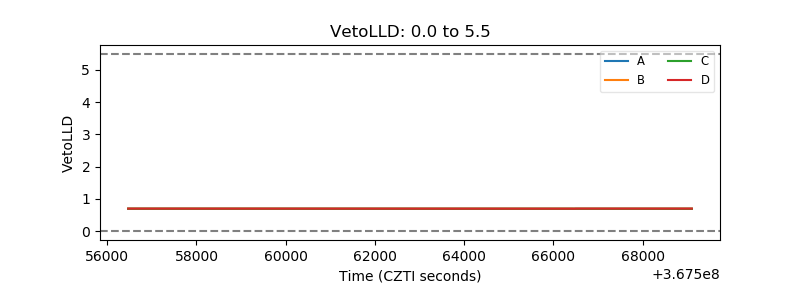 |
| Alpha Counter | 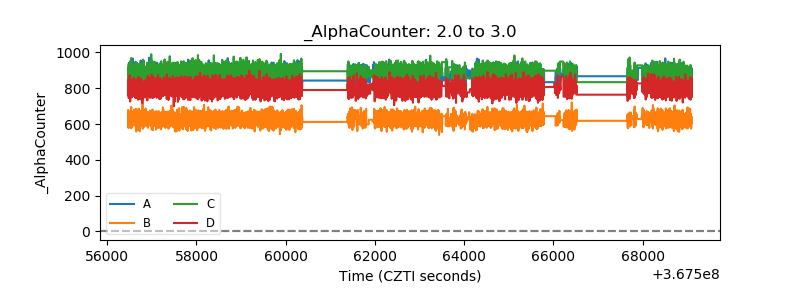 |
| _CPM_Rate | 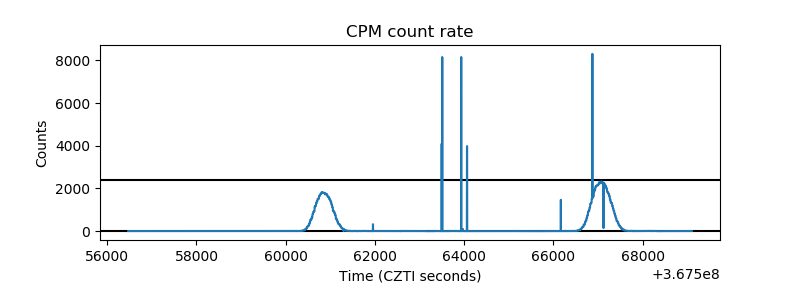 |
| CZT Counter | 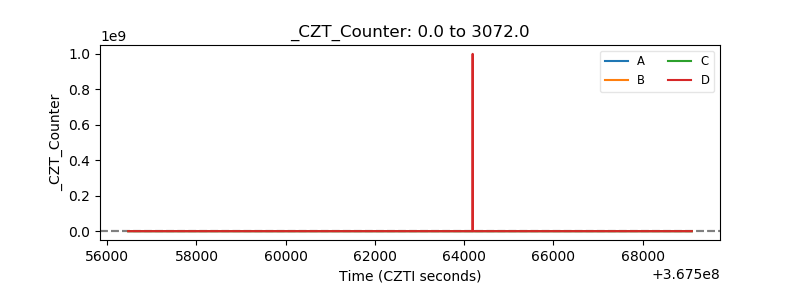 |
| +2.5 Volts monitor |  |
| +5 Volts monitor |  |
| _ROLL_ROT | 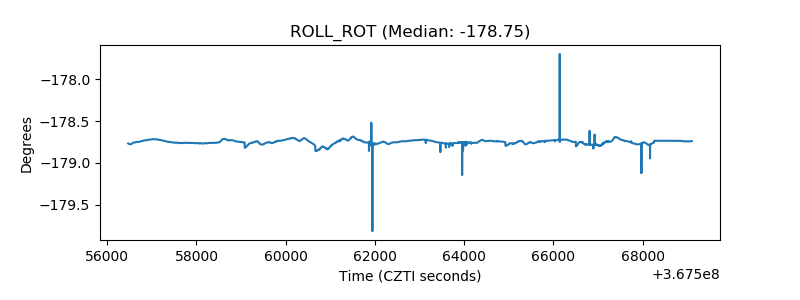 |
| _Roll_DEC | 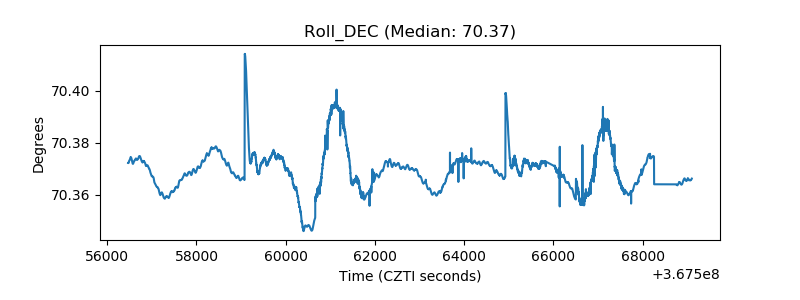 |
| _Roll_RA | 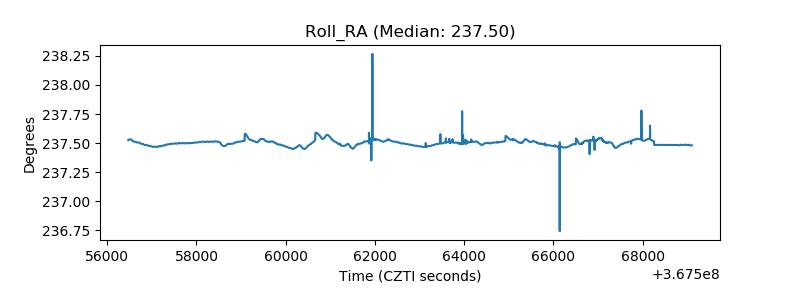 |
| Veto Counter | 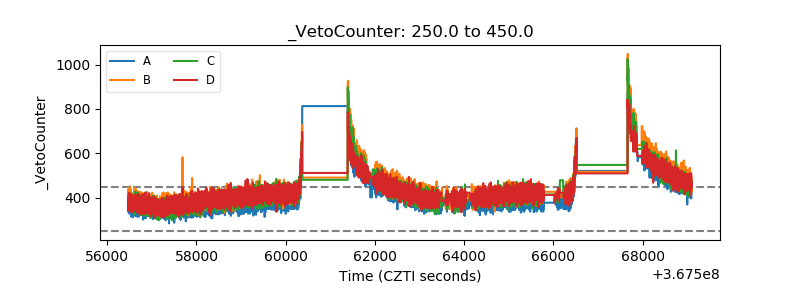 |