| Param | Original file | Final file |
|---|---|---|
| Filename | modeM0/AS1C06_002T04_9000004660_31946cztM0_level2.evt | modeM0/AS1C06_002T04_9000004660_31946cztM0_level2_quad_clean.evt |
| Size (bytes) | 728,320,320 | 127,673,280 |
| Size | 694.6 MB | 121.8 MB |
| Events in quadrant A | 3,325,351 | 952,955 |
| Events in quadrant B | 8,771,530 | 777,109 |
| Events in quadrant C | 4,051,985 | 864,463 |
| Events in quadrant D | 5,502,685 | 851,279 |
| Mode SS | |||
|---|---|---|---|
| Quadrant | BADHDUFLAG | Total packets | Discarded packets |
| A | 0 | 122 | 0 |
| B | 0 | 122 | 0 |
| C | 0 | 122 | 0 |
| D | 0 | 122 | 0 |
| Mode M0 | |||
|---|---|---|---|
| Quadrant | BADHDUFLAG | Total packets | Discarded packets |
| A | 0 | 13613 | 1 |
| B | 0 | 30084 | 1 |
| C | 0 | 16061 | 1 |
| D | 0 | 20856 | 2 |
| Mode M9 | |||
|---|---|---|---|
| Quadrant | BADHDUFLAG | Total packets | Discarded packets |
| A | 0 | 13 | 0 |
| B | 0 | 13 | 0 |
| C | 0 | 13 | 0 |
| D | 0 | 13 | 0 |
| Quadrant | Total seconds | Saturated seconds | Saturation percentage |
|---|---|---|---|
| A | 6015 | 107 | 1.778886% |
| B | 6015 | 2162 | 35.943475% |
| C | 6015 | 240 | 3.990025% |
| D | 6015 | 418 | 6.949293% |
Noise dominated data is calculated using 1-second bins in cleaned event files. If a bin has >2000 counts, and if more than 50% of those come from <1% of pixels, then it is considered to be noise-dominated and hence unusable.
| Quadrant | # 1 sec bins | Bins with >0 counts | Bins with >2000 counts | High rate bins dominated by noise | Noise dominated (total time) | Noise dominated (detector-on time) | Marked lightcurve |
|---|---|---|---|---|---|---|---|
| A | 7280 | 6015 | 0 | 0 | 0.00% | 0.00% |  |
| B | 7279 | 6014 | 1638 | 1638 | 22.50% | 27.24% |  |
| C | 7280 | 6015 | 43 | 43 | 0.59% | 0.71% | 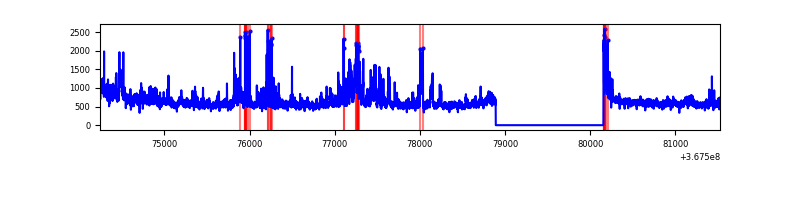 |
| D | 7280 | 6015 | 331 | 331 | 4.55% | 5.50% |  |
Top three noisy pixels from each quadrant. If the there are fewer than three noisy pixels in the level2.evt file, extra rows are filled as -1
| Pixel properties | Quadrant properties | ||||||
|---|---|---|---|---|---|---|---|
| Quadrant | DetID | PixID | Counts | Sigma | Mean | Median | Sigma |
| A | 12 | 96 | 123513 | 756.28 | 826 | 813 | 162.2 |
| A | 13 | 6 | 13771 | 79.87 | 826 | 813 | 162.2 |
| A | 13 | 254 | 11825 | 67.87 | 826 | 813 | 162.2 |
| B | 4 | 80 | 3921568 | 30917.75 | 689 | 676 | 126.8 |
| B | 6 | 159 | 1414383 | 11147.63 | 689 | 676 | 126.8 |
| B | 12 | 18 | 343783 | 2705.53 | 689 | 676 | 126.8 |
| C | 3 | 233 | 582409 | 3389.24 | 754 | 759 | 171.6 |
| C | 0 | 10 | 331381 | 1926.51 | 754 | 759 | 171.6 |
| C | 14 | 238 | 138089 | 800.21 | 754 | 759 | 171.6 |
| D | 8 | 195 | 1065929 | 5886.96 | 774 | 754 | 180.9 |
| D | 12 | 33 | 887223 | 4899.3 | 774 | 754 | 180.9 |
| D | 13 | 249 | 233291 | 1285.18 | 774 | 754 | 180.9 |
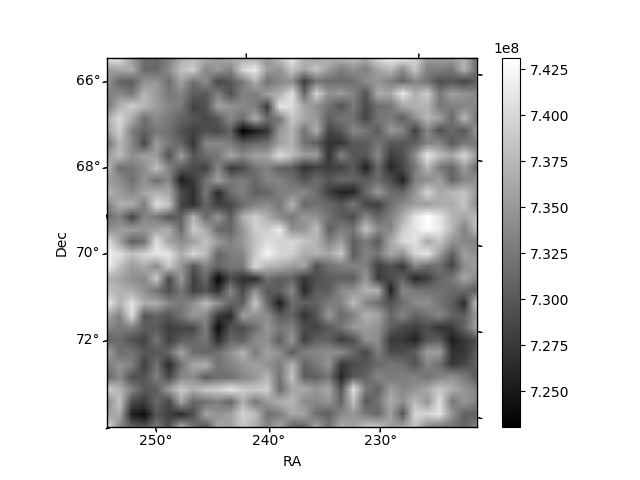
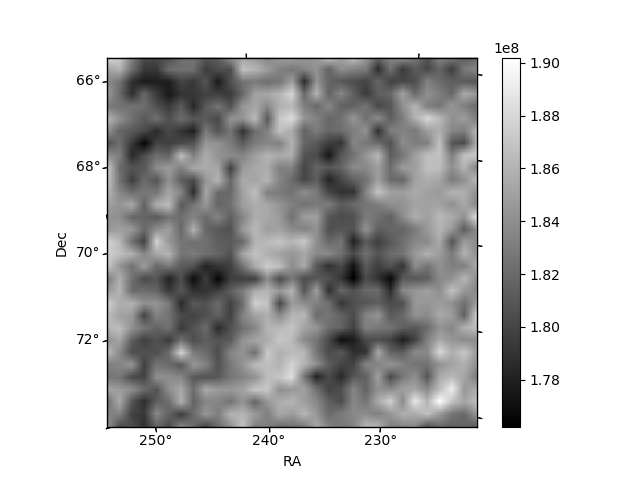
Histogram calculated using DETX and DETY for each event in the final _common_clean file
| Quadrant A | 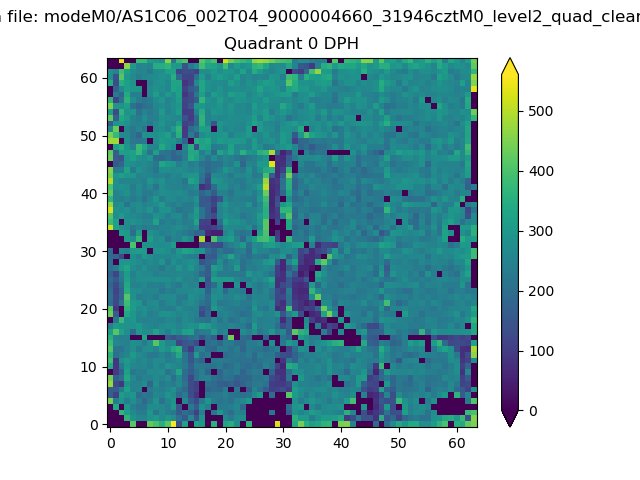 |
 |
Quadrant B |
|---|---|---|---|
| Quadrant D | 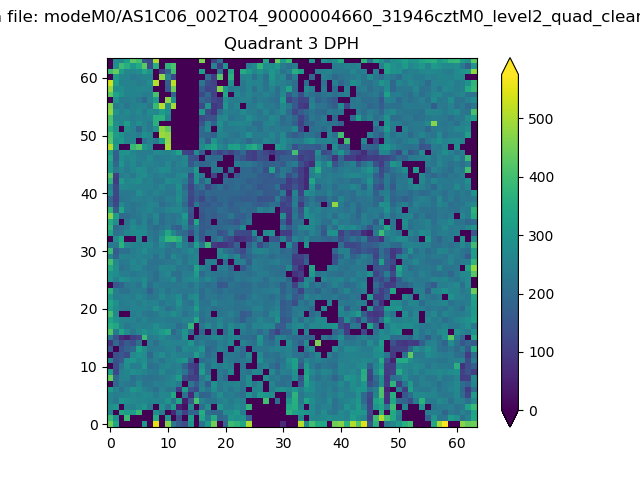 |
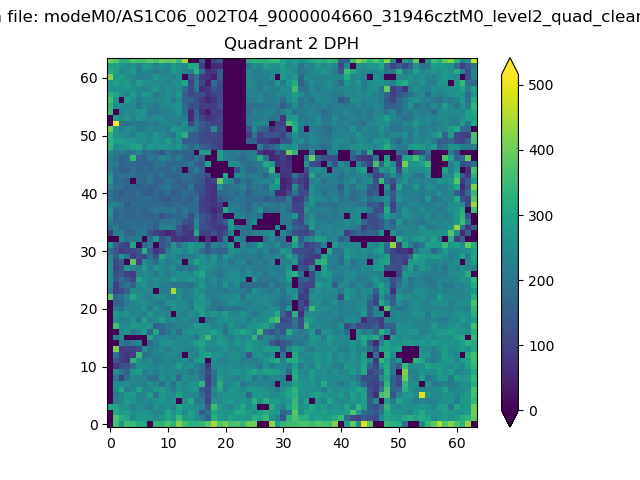 |
Quadrant C |
| Plot type | Count rate plots | Images |
|---|---|---|
| Comparison with Poisson distribution Blue bars denote a histogram of data divided into 1 sec bins. Red curve is a Poisson curve with rate = median count rate of data. |
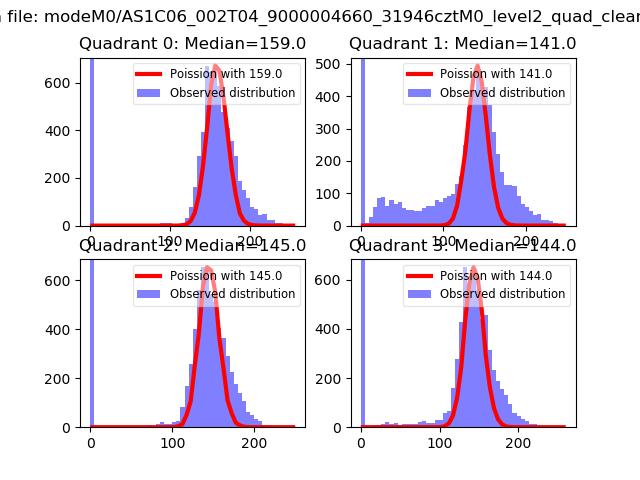 |
 |
| Quadrant-wise count rates Data is divided into 100 sec bins |
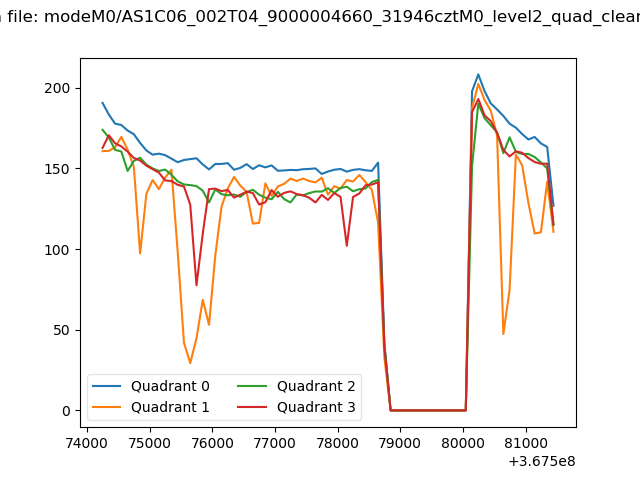 |
|
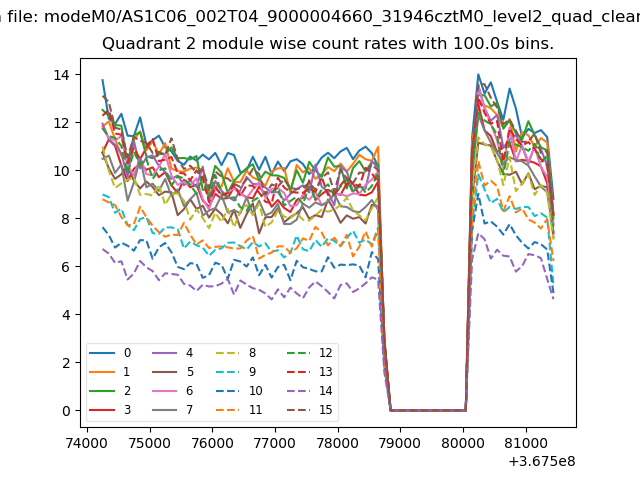
| Module-wise count rates for Quadrant A Data is divided into 100 sec bins |
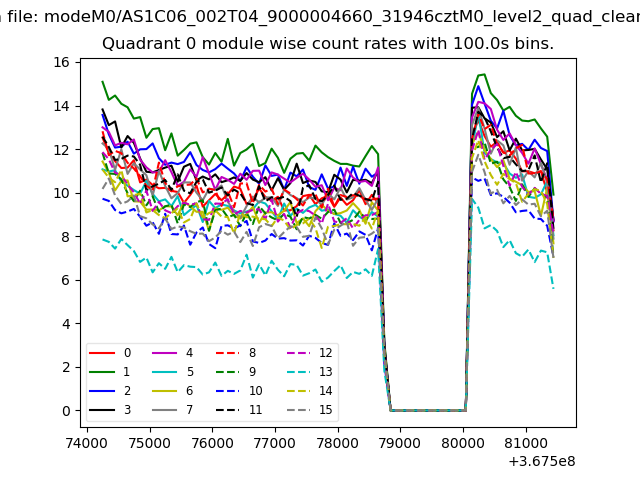 |
 |
| Module-wise count rates for Quadrant B Data is divided into 100 sec bins |
 |
 |
| Module-wise count rates for Quadrant C Data is divided into 100 sec bins |
 |
 |
| Module-wise count rates for Quadrant D Data is divided into 100 sec bins |
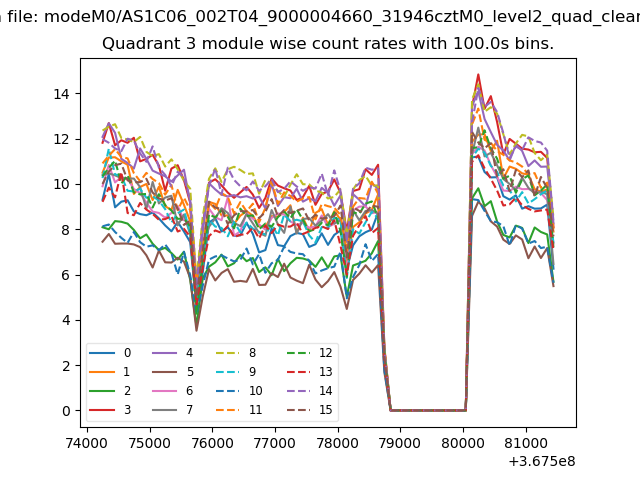 |
 |
| Parameter | Plot |
|---|---|
| CZT HV Monitor | 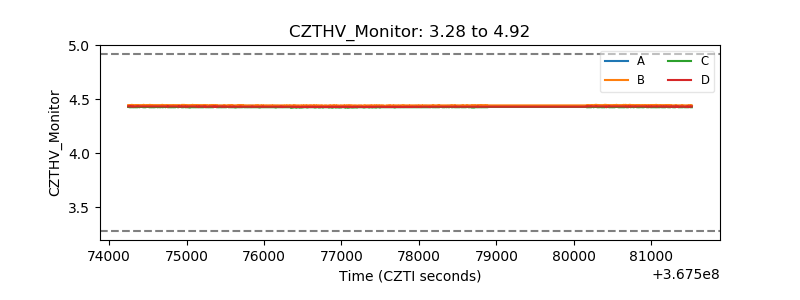 |
| D_VDD | 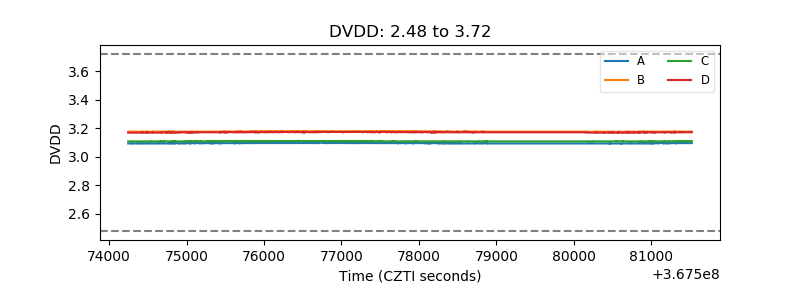 |
| Temperature 1 | 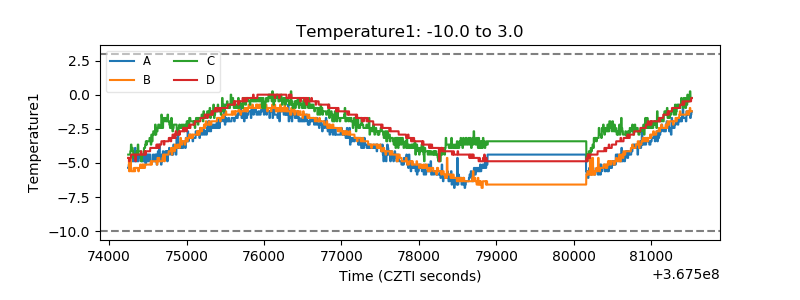 |
| Veto HV Monitor | 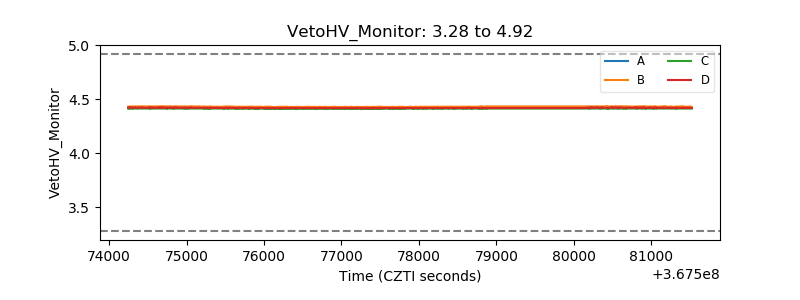 |
| Veto LLD | 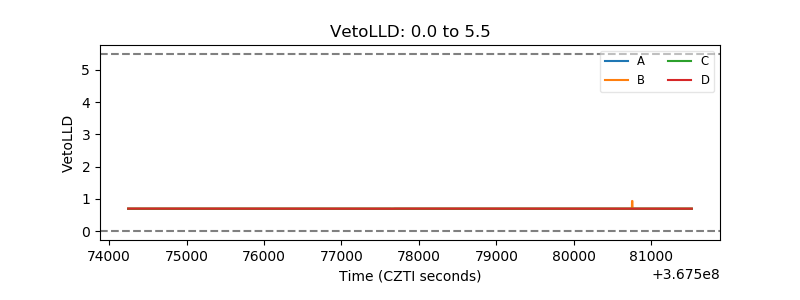 |
| Alpha Counter | 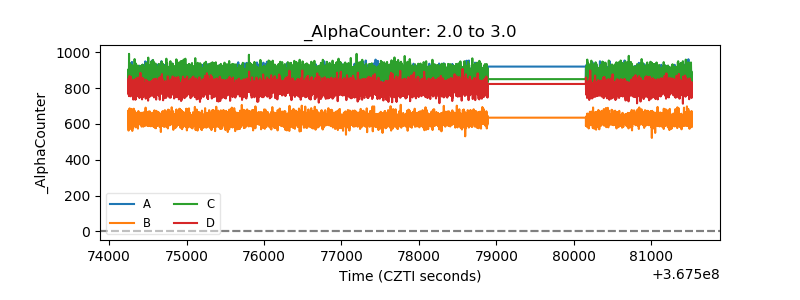 |
| _CPM_Rate | 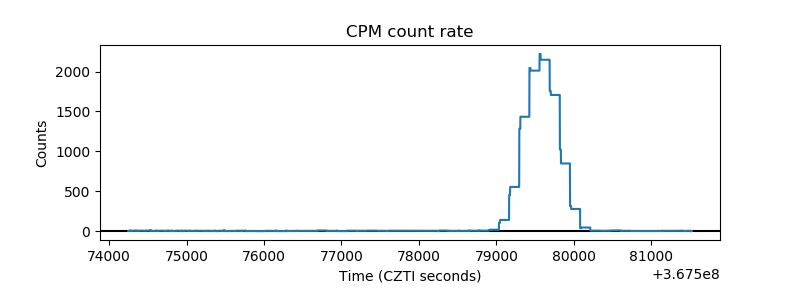 |
| CZT Counter | 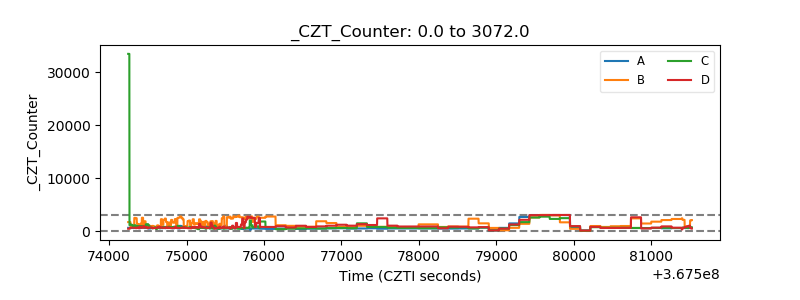 |
| +2.5 Volts monitor |  |
| +5 Volts monitor |  |
| _ROLL_ROT | 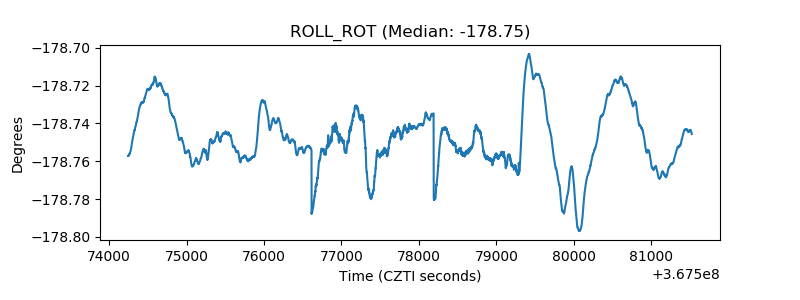 |
| _Roll_DEC | 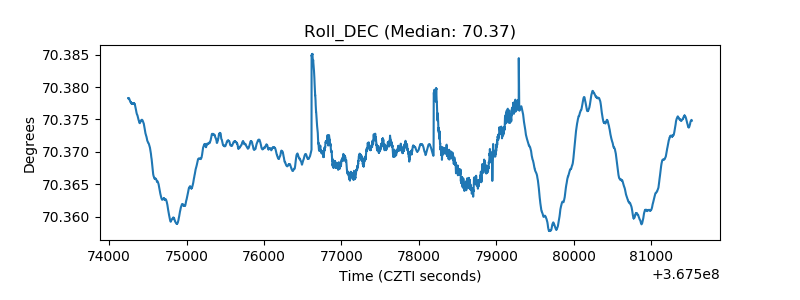 |
| _Roll_RA | 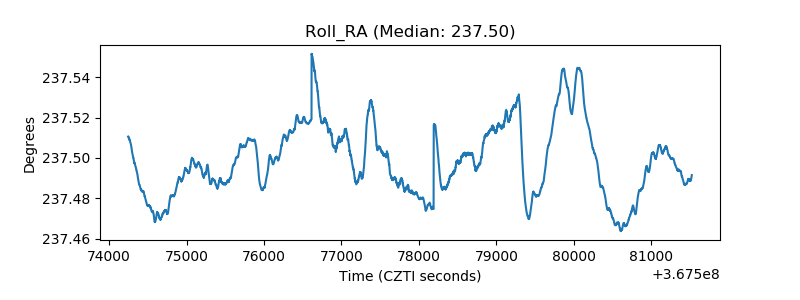 |
| Veto Counter | 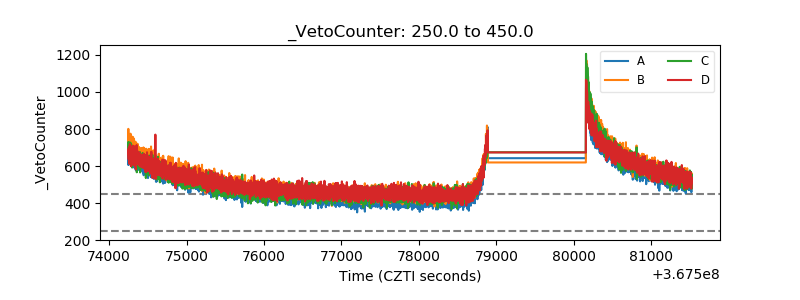 |