| Param | Original file | Final file |
|---|---|---|
| Filename | modeM0/AS1C06_002T04_9000004660_31948cztM0_level2.evt | modeM0/AS1C06_002T04_9000004660_31948cztM0_level2_quad_clean.evt |
| Size (bytes) | 2,556,175,680 | 399,240,000 |
| Size | 2.4 GB | 380.7 MB |
| Events in quadrant A | 10,940,921 | 2,947,998 |
| Events in quadrant B | 28,212,803 | 2,433,834 |
| Events in quadrant C | 19,116,573 | 2,592,712 |
| Events in quadrant D | 17,728,336 | 2,661,687 |
| Mode SS | |||
|---|---|---|---|
| Quadrant | BADHDUFLAG | Total packets | Discarded packets |
| A | 0 | 430 | 0 |
| B | 0 | 430 | 0 |
| C | 0 | 430 | 0 |
| D | 0 | 430 | 0 |
| Mode M0 | |||
|---|---|---|---|
| Quadrant | BADHDUFLAG | Total packets | Discarded packets |
| A | 0 | 45179 | 4 |
| B | 0 | 98345 | 4 |
| C | 0 | 71082 | 4 |
| D | 0 | 68054 | 4 |
| Mode M9 | |||
|---|---|---|---|
| Quadrant | BADHDUFLAG | Total packets | Discarded packets |
| A | 0 | 50 | 0 |
| B | 0 | 50 | 0 |
| C | 0 | 50 | 0 |
| D | 0 | 50 | 0 |
| Quadrant | Total seconds | Saturated seconds | Saturation percentage |
|---|---|---|---|
| A | 21114 | 321 | 1.520318% |
| B | 21114 | 6487 | 30.723690% |
| C | 21115 | 2644 | 12.521904% |
| D | 21115 | 1155 | 5.470045% |
Noise dominated data is calculated using 1-second bins in cleaned event files. If a bin has >2000 counts, and if more than 50% of those come from <1% of pixels, then it is considered to be noise-dominated and hence unusable.
| Quadrant | # 1 sec bins | Bins with >0 counts | Bins with >2000 counts | High rate bins dominated by noise | Noise dominated (total time) | Noise dominated (detector-on time) | Marked lightcurve |
|---|---|---|---|---|---|---|---|
| A | 26079 | 21114 | 0 | 0 | 0.00% | 0.00% |  |
| B | 26079 | 21114 | 5429 | 5429 | 20.82% | 25.71% | 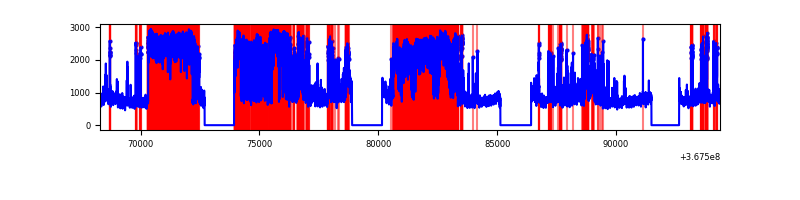 |
| C | 26080 | 21115 | 777 | 777 | 2.98% | 3.68% | 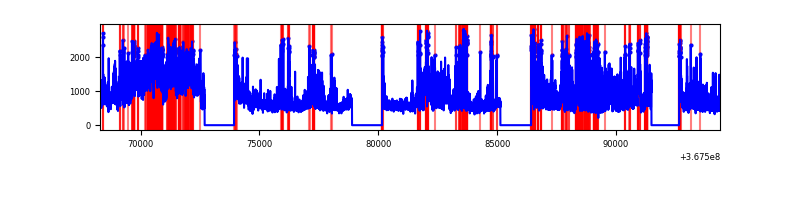 |
| D | 26080 | 21115 | 933 | 933 | 3.58% | 4.42% | 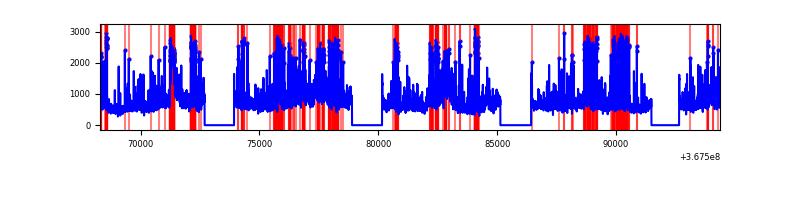 |
Top three noisy pixels from each quadrant. If the there are fewer than three noisy pixels in the level2.evt file, extra rows are filled as -1
| Pixel properties | Quadrant properties | ||||||
|---|---|---|---|---|---|---|---|
| Quadrant | DetID | PixID | Counts | Sigma | Mean | Median | Sigma |
| A | 12 | 96 | 155493 | 281.15 | 2788 | 2736 | 543.3 |
| A | 13 | 254 | 40687 | 69.85 | 2788 | 2736 | 543.3 |
| A | 13 | 6 | 37361 | 63.73 | 2788 | 2736 | 543.3 |
| B | 4 | 80 | 11326020 | 26138.65 | 2380 | 2326 | 433.2 |
| B | 6 | 159 | 5123283 | 11820.78 | 2380 | 2326 | 433.2 |
| B | 10 | 245 | 798519 | 1837.86 | 2380 | 2326 | 433.2 |
| C | 3 | 233 | 5896950 | 10356.16 | 2510 | 2525 | 569.2 |
| C | 0 | 10 | 2449506 | 4299.2 | 2510 | 2525 | 569.2 |
| C | 14 | 238 | 588378 | 1029.31 | 2510 | 2525 | 569.2 |
| D | 8 | 195 | 3121986 | 5085.13 | 2646 | 2588 | 613.4 |
| D | 12 | 33 | 2352249 | 3830.33 | 2646 | 2588 | 613.4 |
| D | 13 | 249 | 1189268 | 1934.48 | 2646 | 2588 | 613.4 |
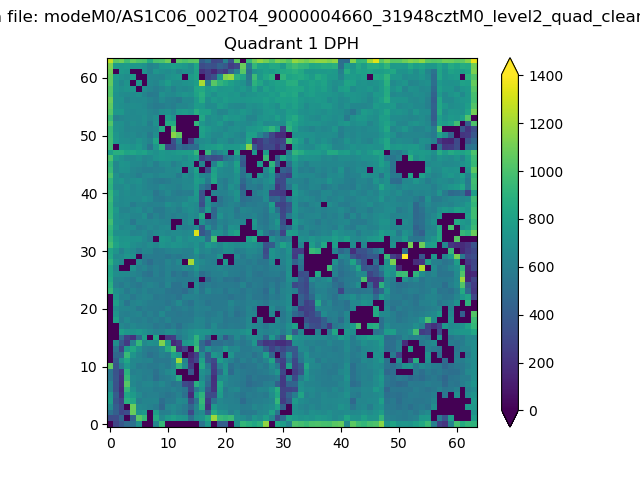
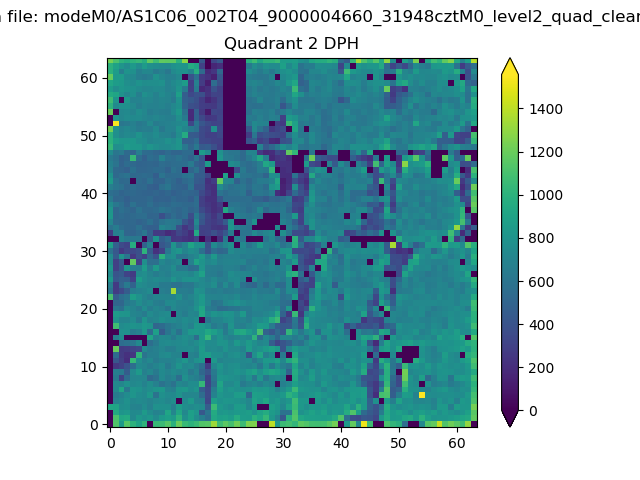
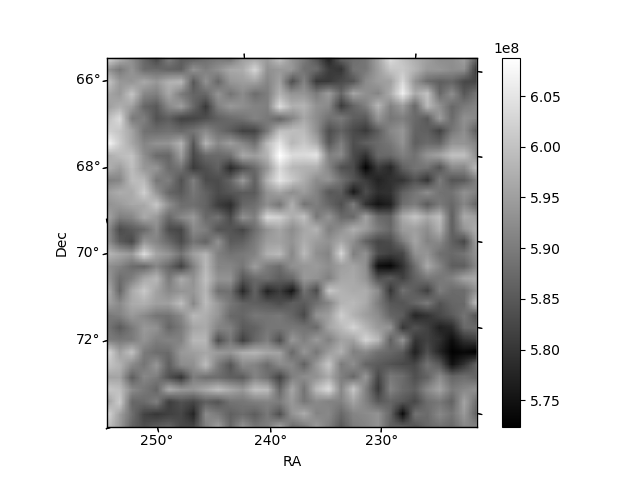
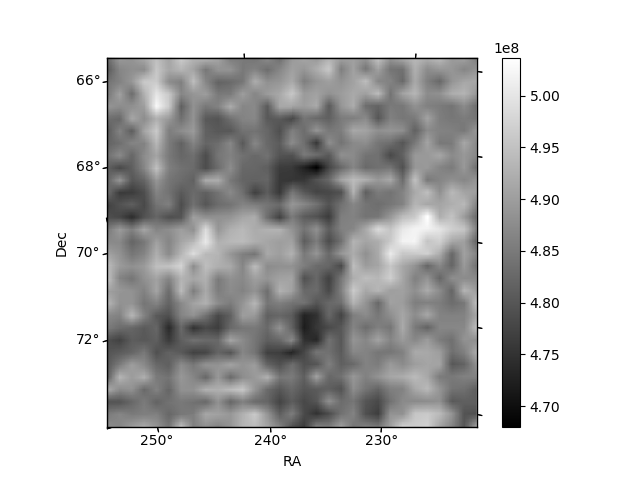
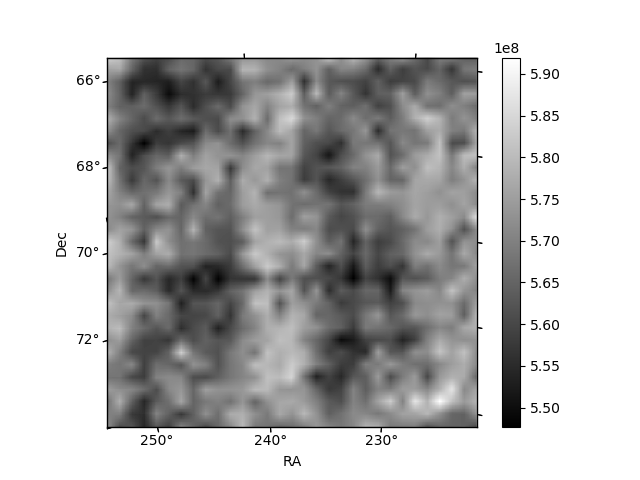
Histogram calculated using DETX and DETY for each event in the final _common_clean file
| Quadrant A | 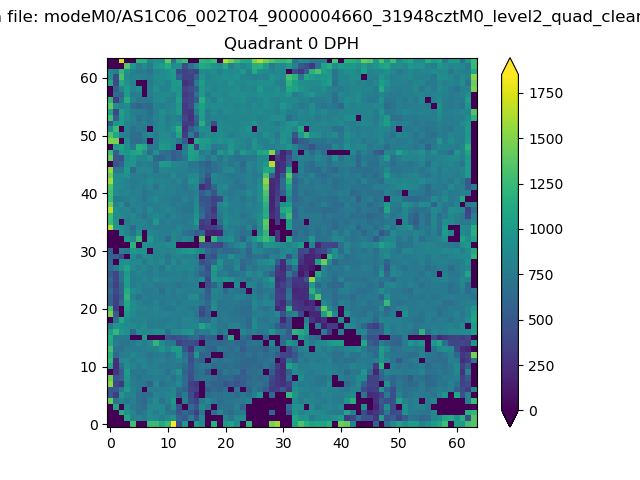 |
 |
Quadrant B |
|---|---|---|---|
| Quadrant D |  |
 |
Quadrant C |
| Plot type | Count rate plots | Images |
|---|---|---|
| Comparison with Poisson distribution Blue bars denote a histogram of data divided into 1 sec bins. Red curve is a Poisson curve with rate = median count rate of data. |
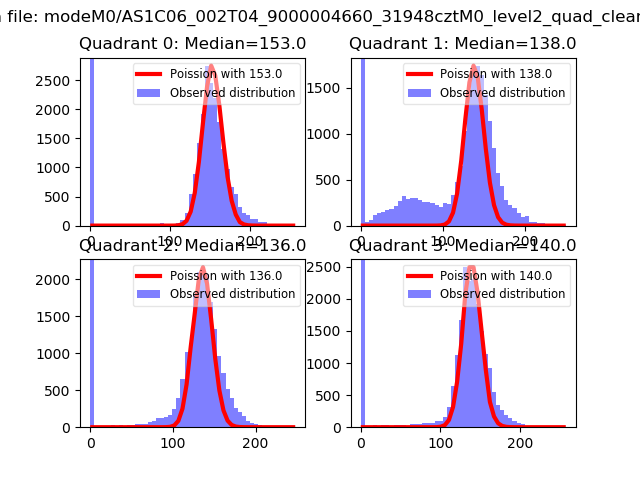 |
 |
| Quadrant-wise count rates Data is divided into 100 sec bins |
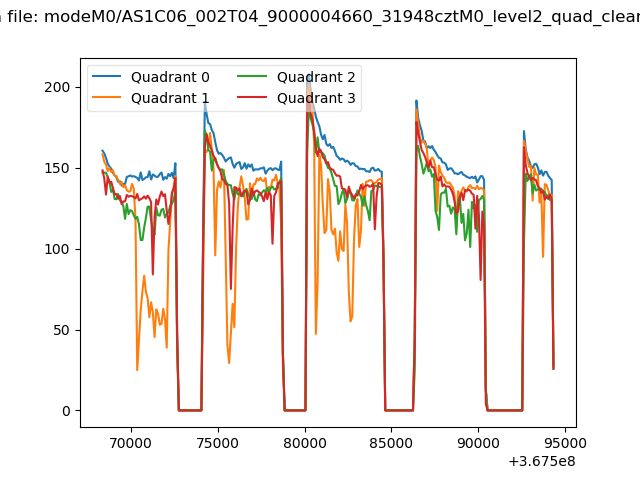 |
|
| Module-wise count rates for Quadrant A Data is divided into 100 sec bins |
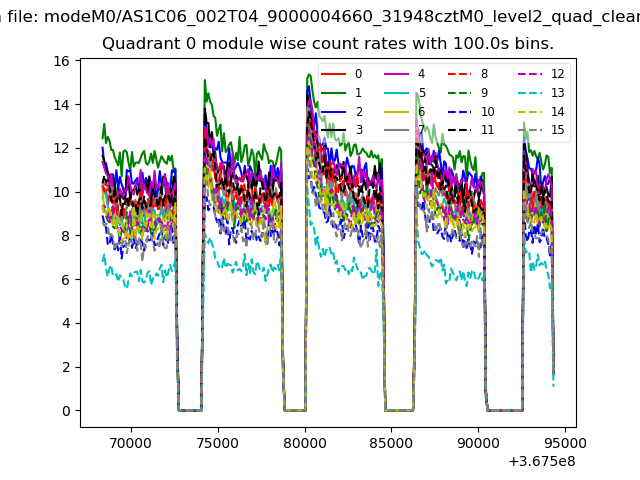 |
 |
| Module-wise count rates for Quadrant B Data is divided into 100 sec bins |
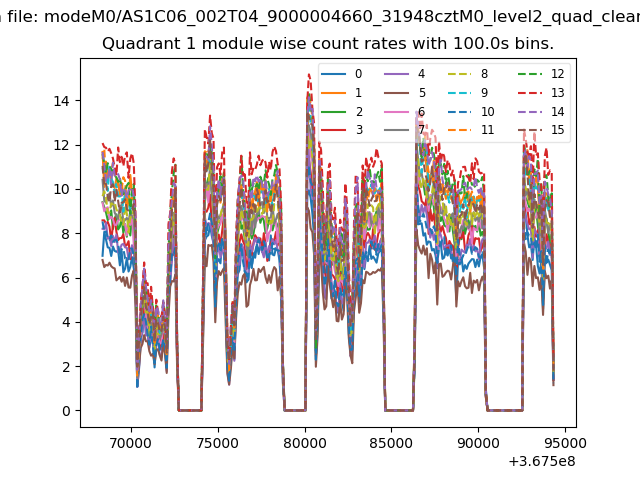 |
 |
| Module-wise count rates for Quadrant C Data is divided into 100 sec bins |
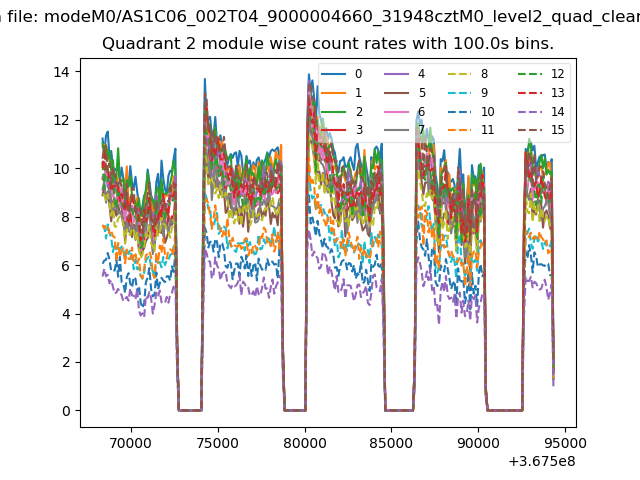 |
 |
| Module-wise count rates for Quadrant D Data is divided into 100 sec bins |
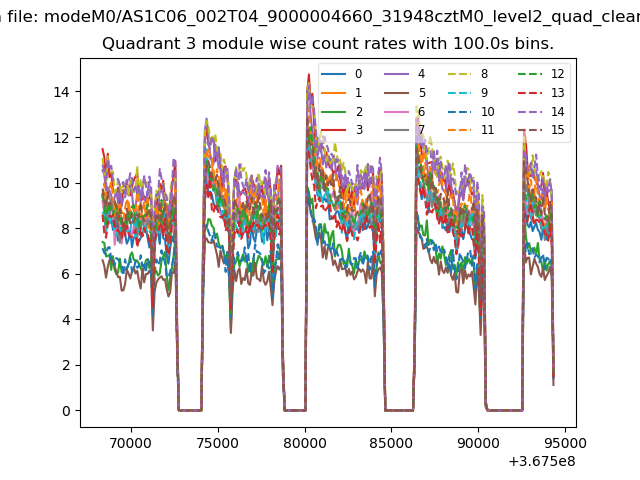 |
 |
| Parameter | Plot |
|---|---|
| CZT HV Monitor | 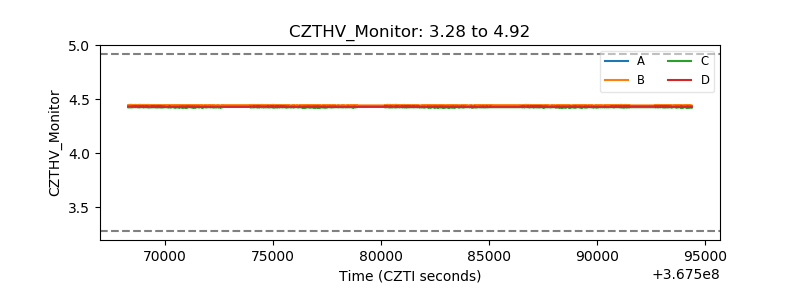 |
| D_VDD | 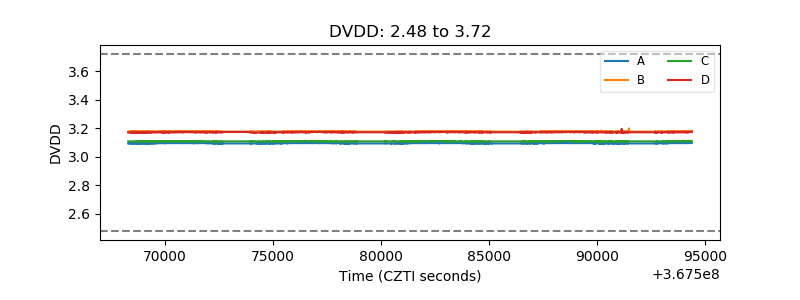 |
| Temperature 1 | 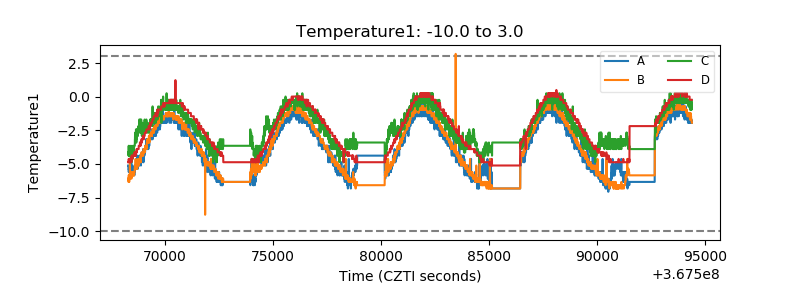 |
| Veto HV Monitor | 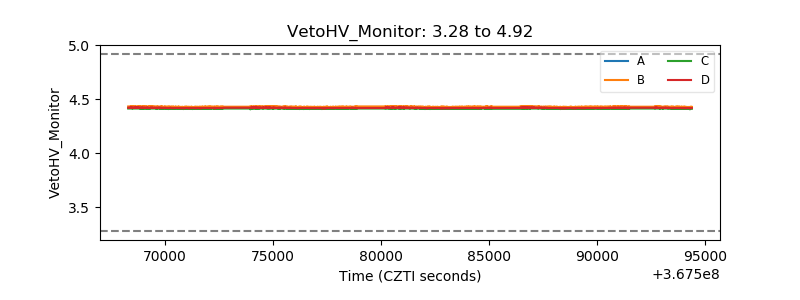 |
| Veto LLD | 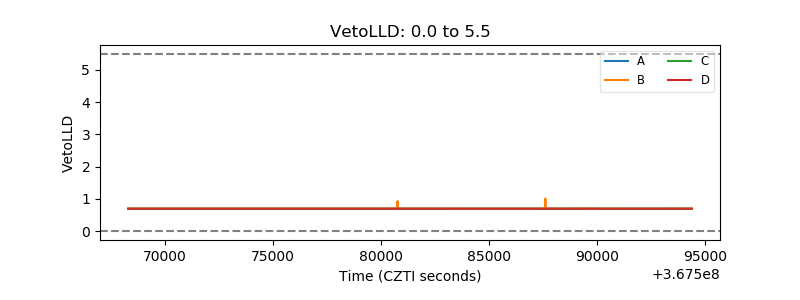 |
| Alpha Counter | 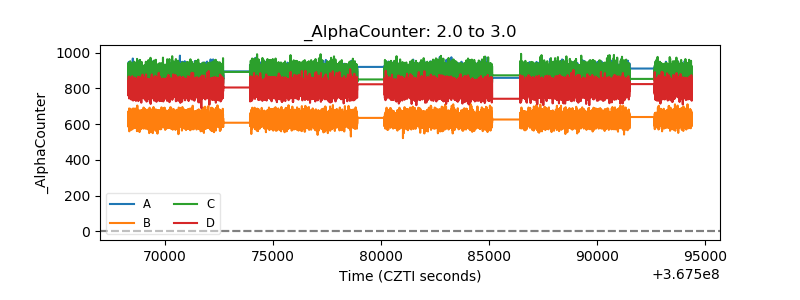 |
| _CPM_Rate | 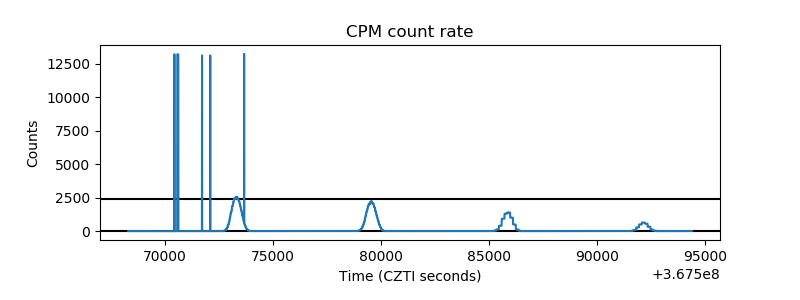 |
| CZT Counter | 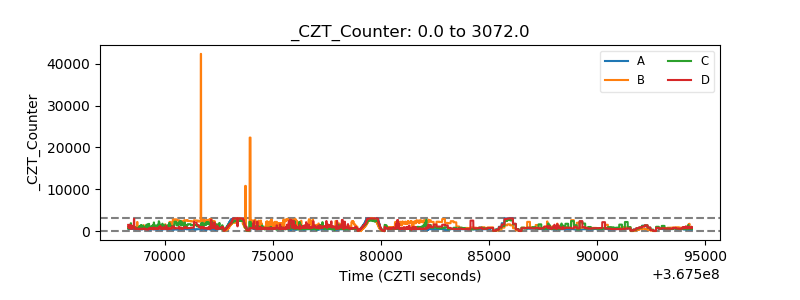 |
| +2.5 Volts monitor |  |
| +5 Volts monitor |  |
| _ROLL_ROT | 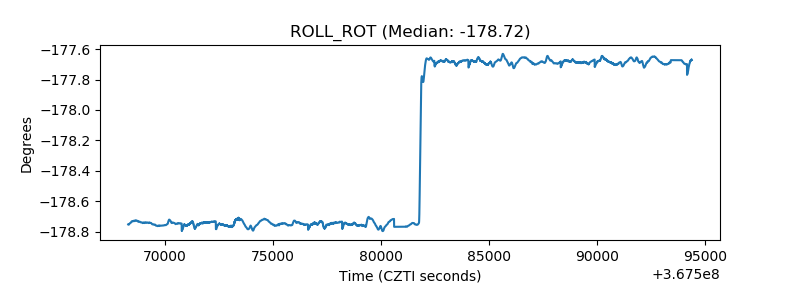 |
| _Roll_DEC | 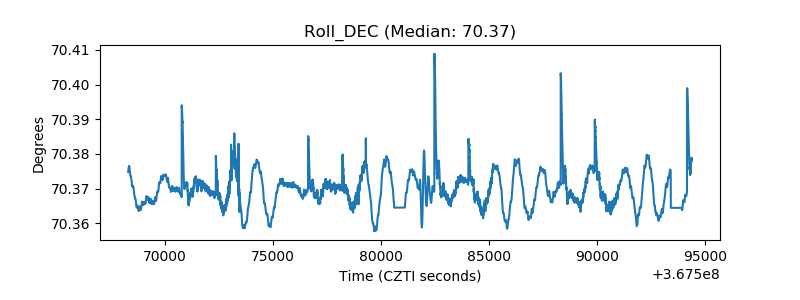 |
| _Roll_RA | 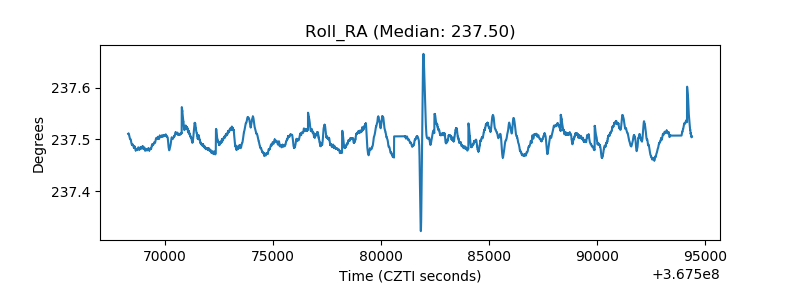 |
| Veto Counter | 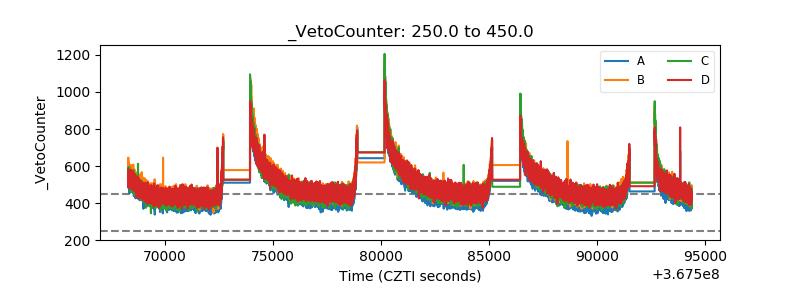 |