| Param | Original file | Final file |
|---|---|---|
| Filename | modeM0/AS1C06_002T04_9000004660_31949cztM0_level2.evt | modeM0/AS1C06_002T04_9000004660_31949cztM0_level2_quad_clean.evt |
| Size (bytes) | 657,944,640 | 104,604,480 |
| Size | 627.5 MB | 99.8 MB |
| Events in quadrant A | 3,094,174 | 726,119 |
| Events in quadrant B | 6,089,006 | 674,790 |
| Events in quadrant C | 4,757,173 | 656,522 |
| Events in quadrant D | 5,553,690 | 664,027 |
| Mode SS | |||
|---|---|---|---|
| Quadrant | BADHDUFLAG | Total packets | Discarded packets |
| A | 0 | 130 | 0 |
| B | 0 | 130 | 0 |
| C | 0 | 130 | 0 |
| D | 0 | 130 | 0 |
| Mode M0 | |||
|---|---|---|---|
| Quadrant | BADHDUFLAG | Total packets | Discarded packets |
| A | 0 | 13136 | 1 |
| B | 0 | 22491 | 1 |
| C | 0 | 18362 | 4 |
| D | 0 | 20996 | 1 |
| Mode M9 | |||
|---|---|---|---|
| Quadrant | BADHDUFLAG | Total packets | Discarded packets |
| A | 0 | 9 | 0 |
| B | 0 | 9 | 0 |
| C | 0 | 9 | 0 |
| D | 0 | 9 | 0 |
| Quadrant | Total seconds | Saturated seconds | Saturation percentage |
|---|---|---|---|
| A | 6395 | 64 | 1.000782% |
| B | 6395 | 494 | 7.724785% |
| C | 6394 | 421 | 6.584298% |
| D | 6394 | 321 | 5.020332% |
Noise dominated data is calculated using 1-second bins in cleaned event files. If a bin has >2000 counts, and if more than 50% of those come from <1% of pixels, then it is considered to be noise-dominated and hence unusable.
| Quadrant | # 1 sec bins | Bins with >0 counts | Bins with >2000 counts | High rate bins dominated by noise | Noise dominated (total time) | Noise dominated (detector-on time) | Marked lightcurve |
|---|---|---|---|---|---|---|---|
| A | 7285 | 6395 | 1 | 1 | 0.01% | 0.02% | 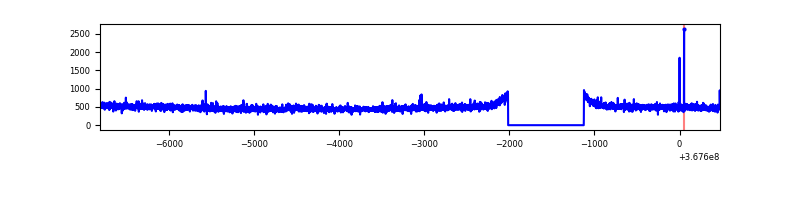 |
| B | 7285 | 6395 | 326 | 326 | 4.47% | 5.10% | 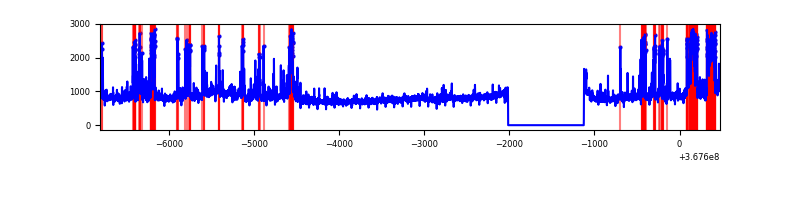 |
| C | 7284 | 6394 | 169 | 169 | 2.32% | 2.64% | 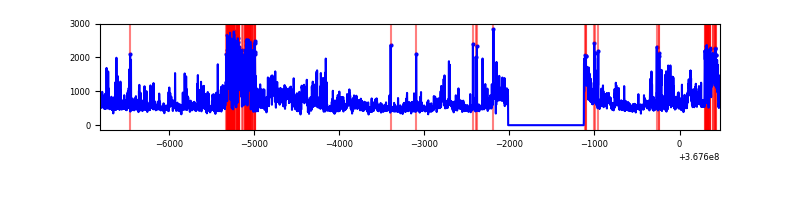 |
| D | 7284 | 6394 | 230 | 230 | 3.16% | 3.60% | 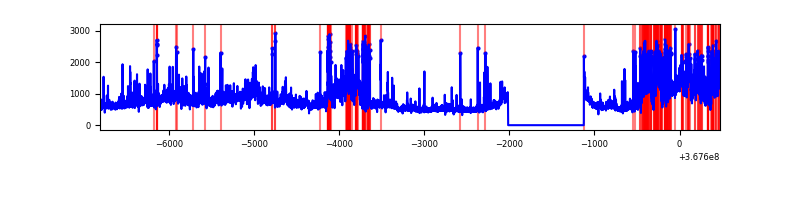 |
Top three noisy pixels from each quadrant. If the there are fewer than three noisy pixels in the level2.evt file, extra rows are filled as -1
| Pixel properties | Quadrant properties | ||||||
|---|---|---|---|---|---|---|---|
| Quadrant | DetID | PixID | Counts | Sigma | Mean | Median | Sigma |
| A | 13 | 6 | 16983 | 103.38 | 791 | 775 | 156.8 |
| A | 12 | 96 | 13812 | 83.15 | 791 | 775 | 156.8 |
| A | 13 | 254 | 12332 | 73.71 | 791 | 775 | 156.8 |
| B | 6 | 159 | 1842147 | 13057.65 | 753 | 735 | 141.0 |
| B | 10 | 245 | 612443 | 4337.69 | 753 | 735 | 141.0 |
| B | 5 | 172 | 371272 | 2627.52 | 753 | 735 | 141.0 |
| C | 3 | 233 | 967829 | 5628.53 | 739 | 743 | 171.8 |
| C | 0 | 10 | 734581 | 4271.0 | 739 | 743 | 171.8 |
| C | 14 | 238 | 126832 | 733.85 | 739 | 743 | 171.8 |
| D | 12 | 33 | 1137339 | 6352.07 | 762 | 743 | 178.9 |
| D | 8 | 195 | 939411 | 5245.91 | 762 | 743 | 178.9 |
| D | 13 | 249 | 242167 | 1349.24 | 762 | 743 | 178.9 |
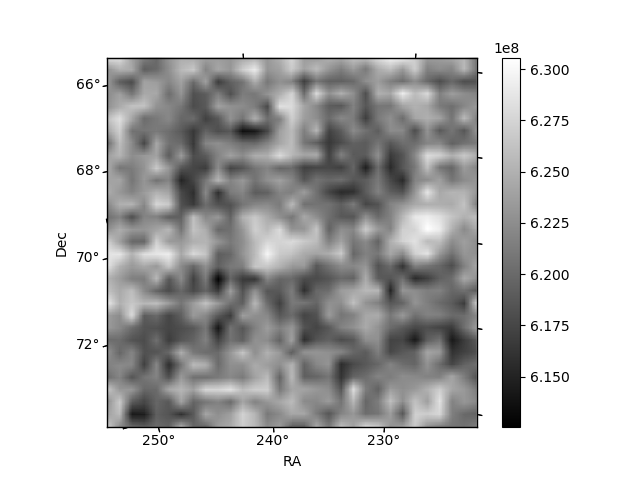
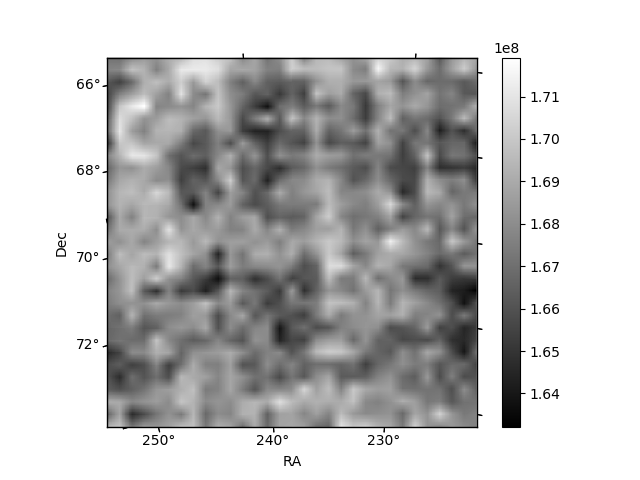
Histogram calculated using DETX and DETY for each event in the final _common_clean file
| Quadrant A | 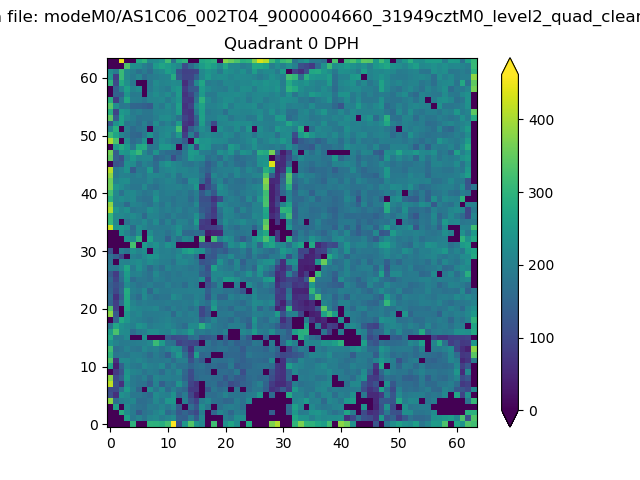 |
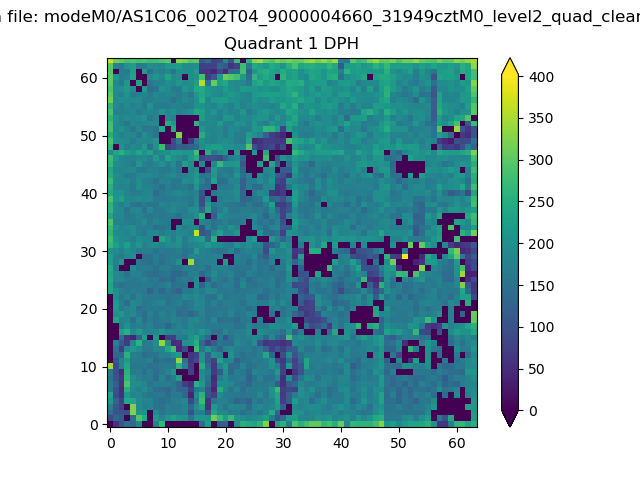 |
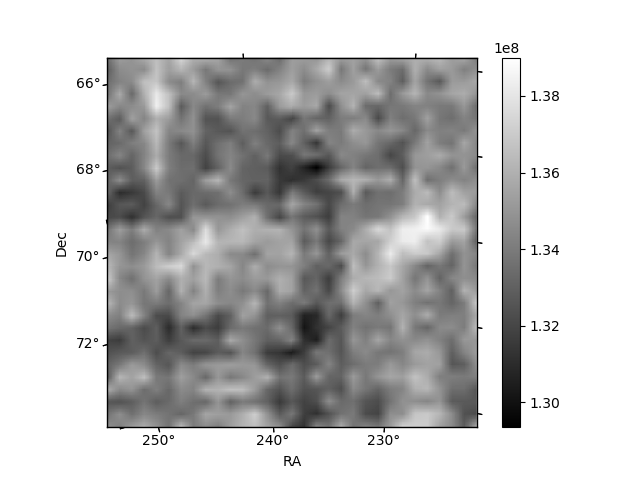
Quadrant B |
|---|---|---|---|
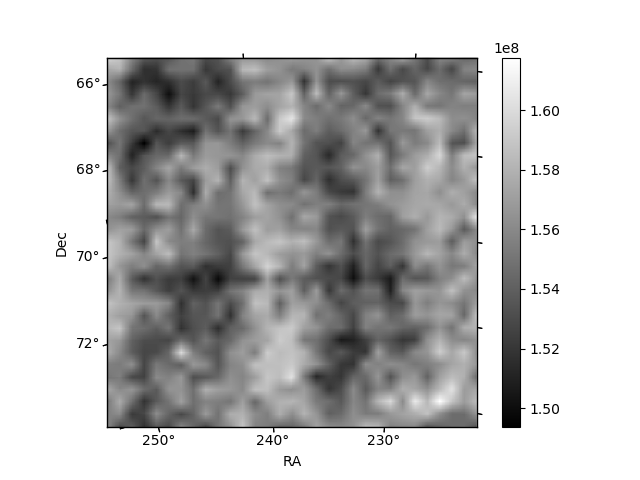
| Quadrant D |  |
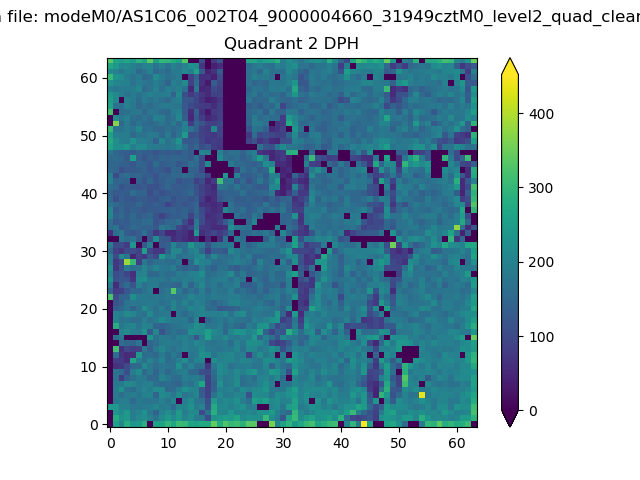 |
Quadrant C |
| Plot type | Count rate plots | Images |
|---|---|---|
| Comparison with Poisson distribution Blue bars denote a histogram of data divided into 1 sec bins. Red curve is a Poisson curve with rate = median count rate of data. |
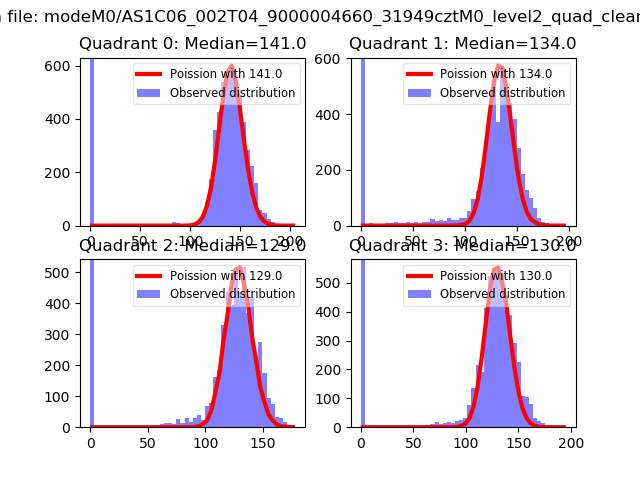 |
 |
| Quadrant-wise count rates Data is divided into 100 sec bins |
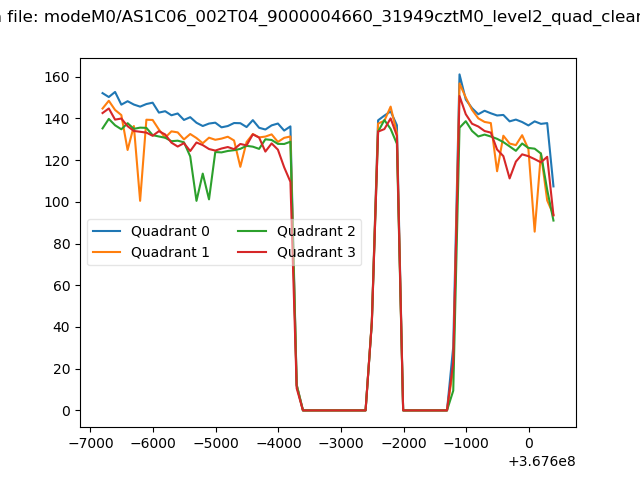 |
|
| Module-wise count rates for Quadrant A Data is divided into 100 sec bins |
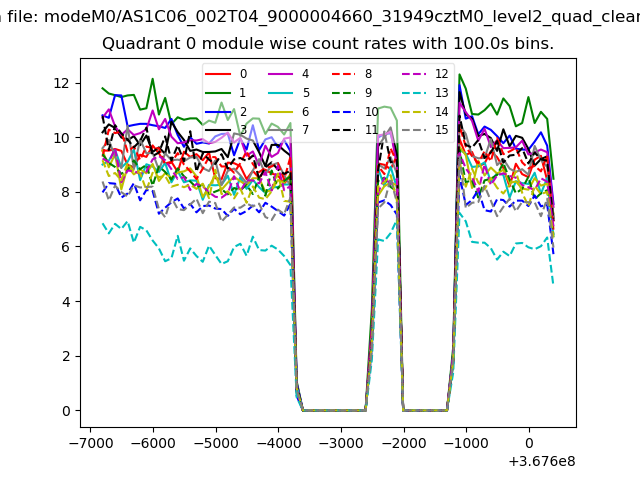 |
 |
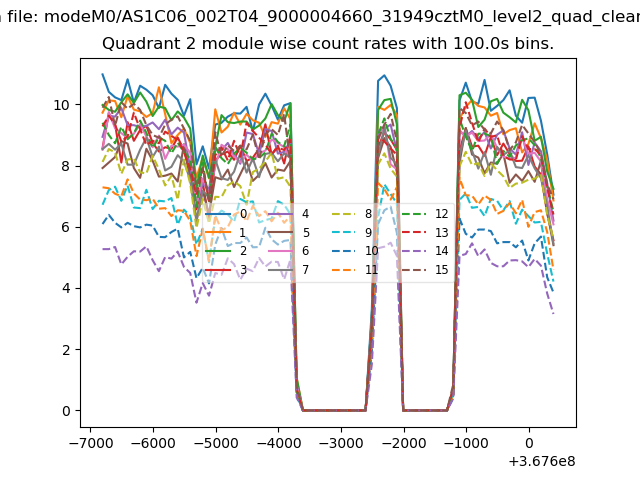
| Module-wise count rates for Quadrant B Data is divided into 100 sec bins |
 |
 |
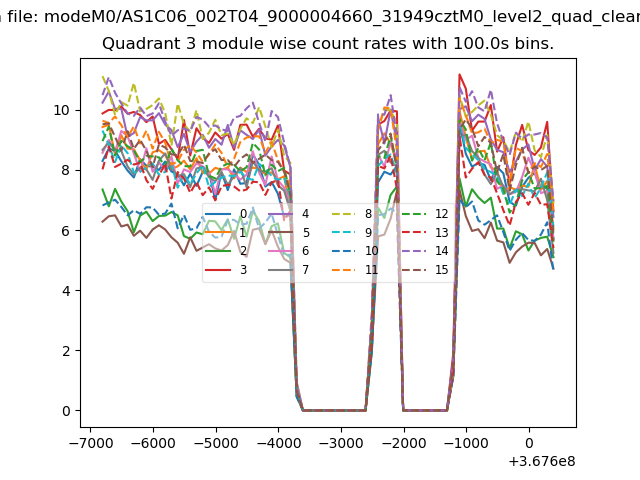
| Module-wise count rates for Quadrant C Data is divided into 100 sec bins |
 |
 |
| Module-wise count rates for Quadrant D Data is divided into 100 sec bins |
 |
 |
| Parameter | Plot |
|---|---|
| CZT HV Monitor |  |
| D_VDD | 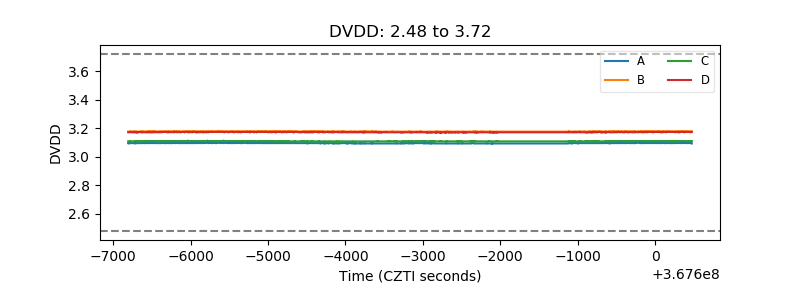 |
| Temperature 1 | 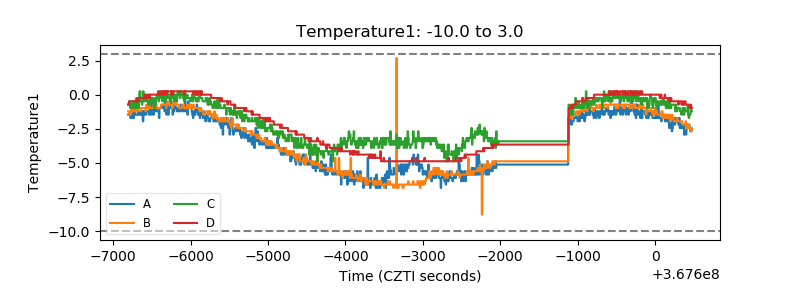 |
| Veto HV Monitor | 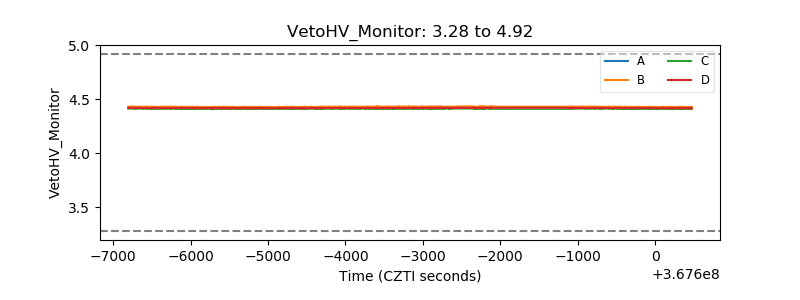 |
| Veto LLD | 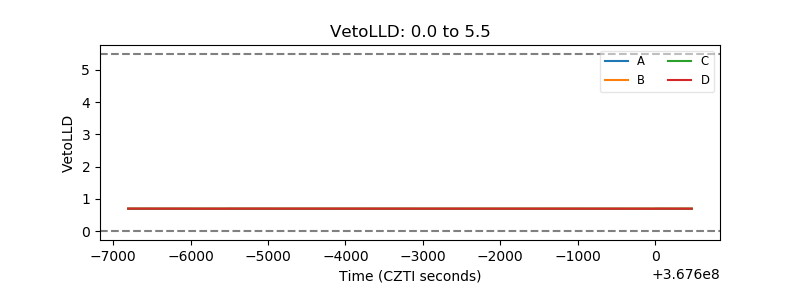 |
| Alpha Counter | 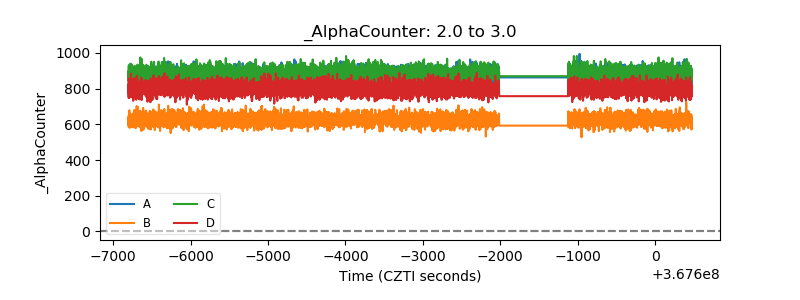 |
| _CPM_Rate | 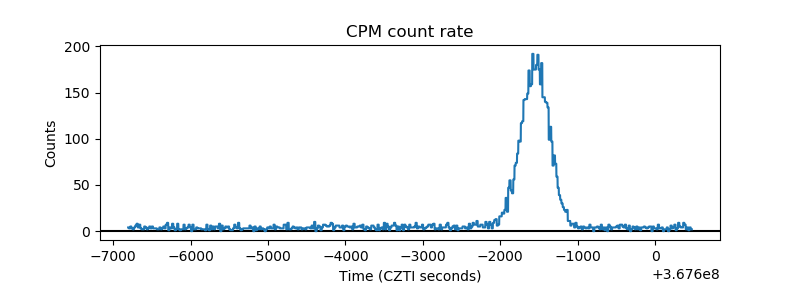 |
| CZT Counter | 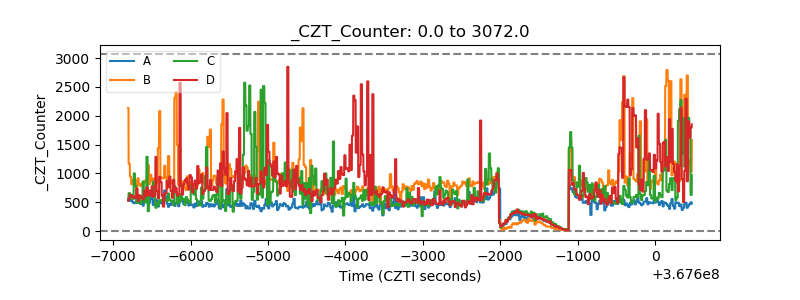 |
| +2.5 Volts monitor |  |
| +5 Volts monitor | 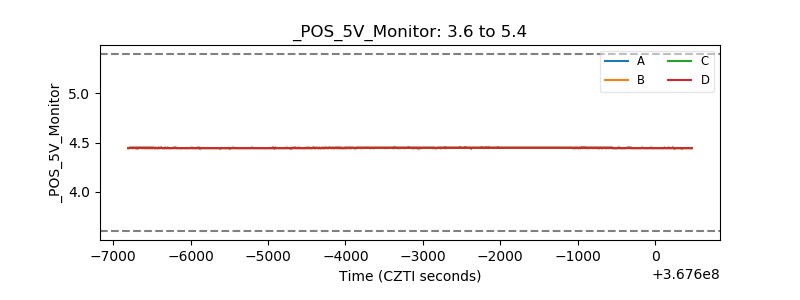 |
| _ROLL_ROT | 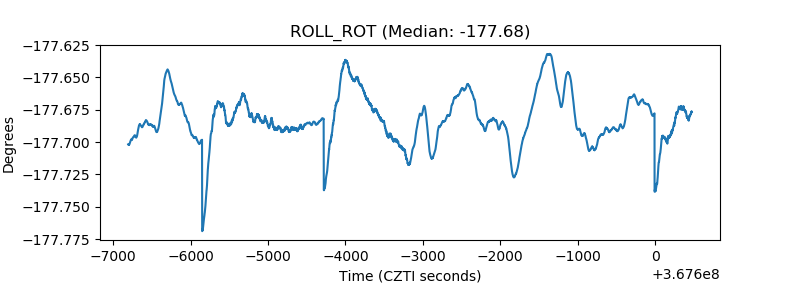 |
| _Roll_DEC | 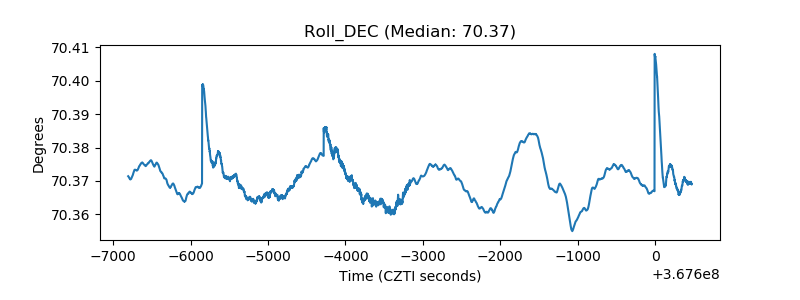 |
| _Roll_RA | 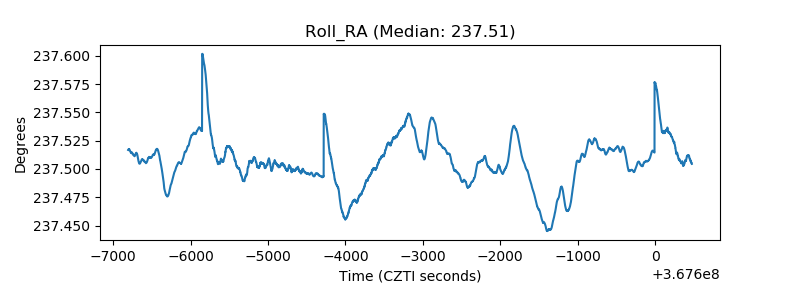 |
| Veto Counter | 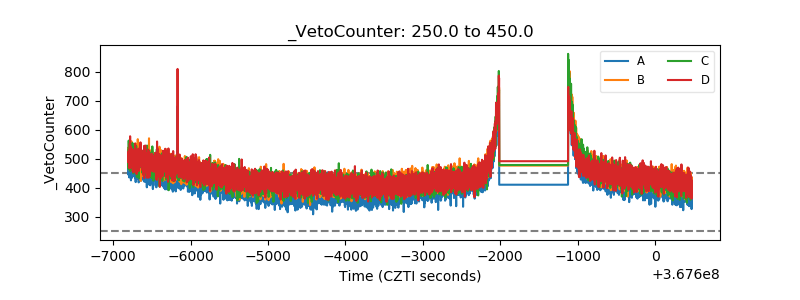 |