| Param | Original file | Final file |
|---|---|---|
| Filename | modeM0/AS1C06_002T04_9000004660_31951cztM0_level2.evt | modeM0/AS1C06_002T04_9000004660_31951cztM0_level2_quad_clean.evt |
| Size (bytes) | 1,390,933,440 | 175,328,640 |
| Size | 1.3 GB | 167.2 MB |
| Events in quadrant A | 5,537,280 | 1,238,298 |
| Events in quadrant B | 16,456,399 | 1,014,490 |
| Events in quadrant C | 9,491,545 | 1,127,594 |
| Events in quadrant D | 9,845,181 | 1,111,488 |
| Mode SS | |||
|---|---|---|---|
| Quadrant | BADHDUFLAG | Total packets | Discarded packets |
| A | 0 | 242 | 0 |
| B | 0 | 242 | 0 |
| C | 0 | 242 | 0 |
| D | 0 | 242 | 0 |
| Mode M0 | |||
|---|---|---|---|
| Quadrant | BADHDUFLAG | Total packets | Discarded packets |
| A | 0 | 24348 | 2 |
| B | 0 | 56975 | 2 |
| C | 0 | 36192 | 2 |
| D | 0 | 37009 | 2 |
| Mode M9 | |||
|---|---|---|---|
| Quadrant | BADHDUFLAG | Total packets | Discarded packets |
| A | 0 | 7 | 0 |
| B | 0 | 7 | 0 |
| C | 0 | 7 | 0 |
| D | 0 | 7 | 0 |
| Quadrant | Total seconds | Saturated seconds | Saturation percentage |
|---|---|---|---|
| A | 11793 | 77 | 0.652930% |
| B | 11793 | 4269 | 36.199440% |
| C | 11793 | 1177 | 9.980497% |
| D | 11794 | 1021 | 8.656944% |
Noise dominated data is calculated using 1-second bins in cleaned event files. If a bin has >2000 counts, and if more than 50% of those come from <1% of pixels, then it is considered to be noise-dominated and hence unusable.
| Quadrant | # 1 sec bins | Bins with >0 counts | Bins with >2000 counts | High rate bins dominated by noise | Noise dominated (total time) | Noise dominated (detector-on time) | Marked lightcurve |
|---|---|---|---|---|---|---|---|
| A | 12578 | 11794 | 0 | 0 | 0.00% | 0.00% | 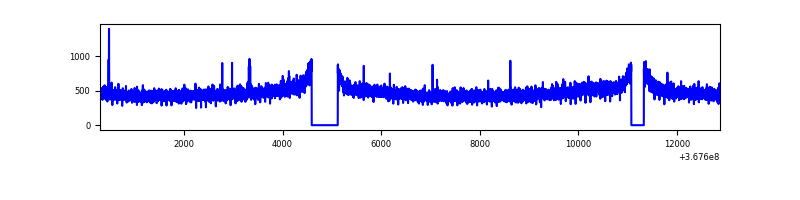 |
| B | 12578 | 11793 | 3127 | 3127 | 24.86% | 26.52% | 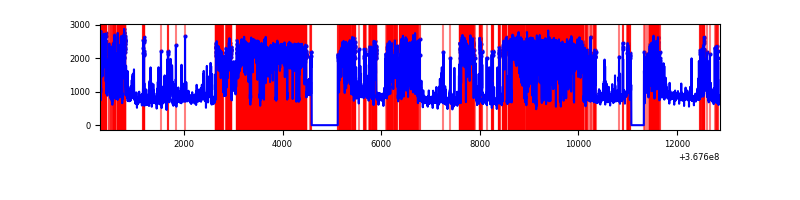 |
| C | 12578 | 11794 | 194 | 194 | 1.54% | 1.64% |  |
| D | 12579 | 11794 | 762 | 762 | 6.06% | 6.46% | 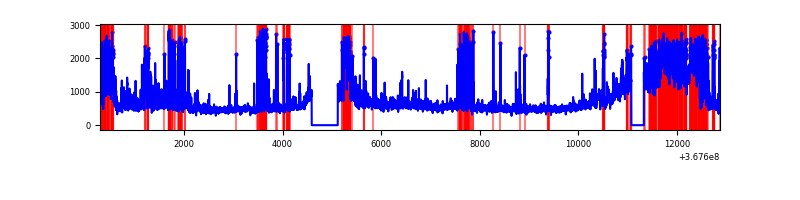 |
Top three noisy pixels from each quadrant. If the there are fewer than three noisy pixels in the level2.evt file, extra rows are filled as -1
| Pixel properties | Quadrant properties | ||||||
|---|---|---|---|---|---|---|---|
| Quadrant | DetID | PixID | Counts | Sigma | Mean | Median | Sigma |
| A | 13 | 254 | 24306 | 80.86 | 1424 | 1393 | 283.4 |
| A | 13 | 6 | 22077 | 73.0 | 1424 | 1393 | 283.4 |
| A | 12 | 96 | 15753 | 50.68 | 1424 | 1393 | 283.4 |
| B | 4 | 80 | 7601573 | 33996.26 | 1190 | 1158 | 223.6 |
| B | 6 | 159 | 2997923 | 13404.38 | 1190 | 1158 | 223.6 |
| B | 5 | 172 | 608542 | 2716.8 | 1190 | 1158 | 223.6 |
| C | 3 | 233 | 3294070 | 10662.37 | 1325 | 1329 | 308.8 |
| C | 0 | 10 | 542303 | 1751.75 | 1325 | 1329 | 308.8 |
| C | 14 | 238 | 302491 | 975.21 | 1325 | 1329 | 308.8 |
| D | 8 | 195 | 1967487 | 6156.82 | 1349 | 1313 | 319.3 |
| D | 12 | 33 | 1078926 | 3374.41 | 1349 | 1313 | 319.3 |
| D | 13 | 249 | 696805 | 2177.84 | 1349 | 1313 | 319.3 |
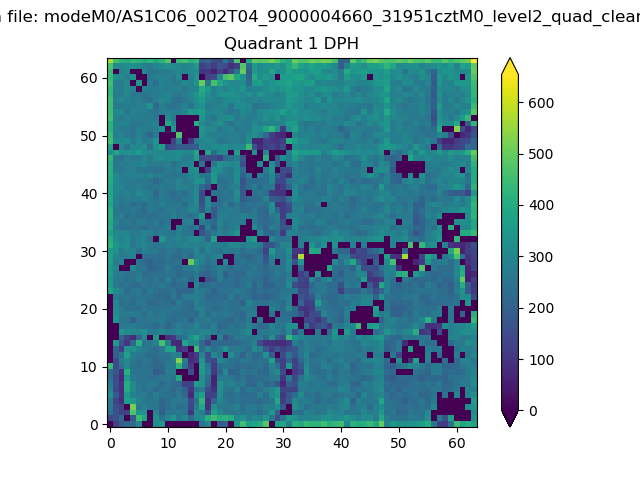
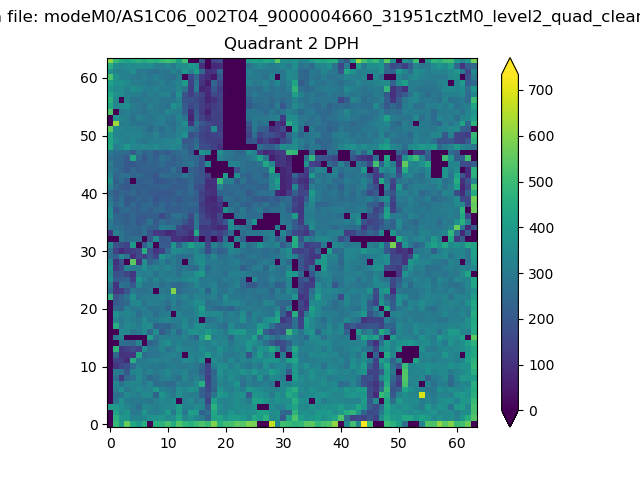
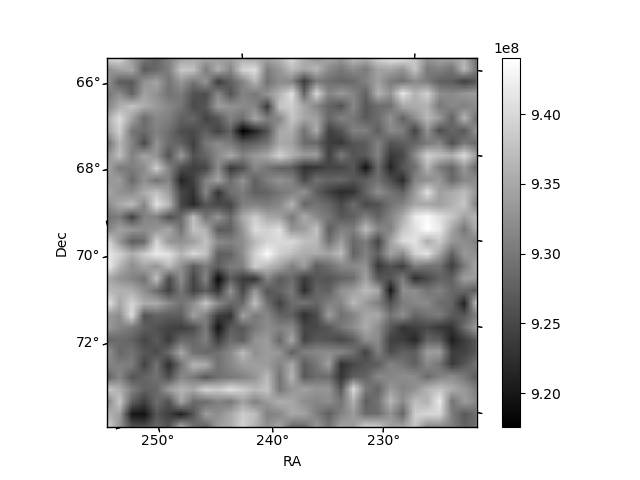
Histogram calculated using DETX and DETY for each event in the final _common_clean file
| Quadrant A | 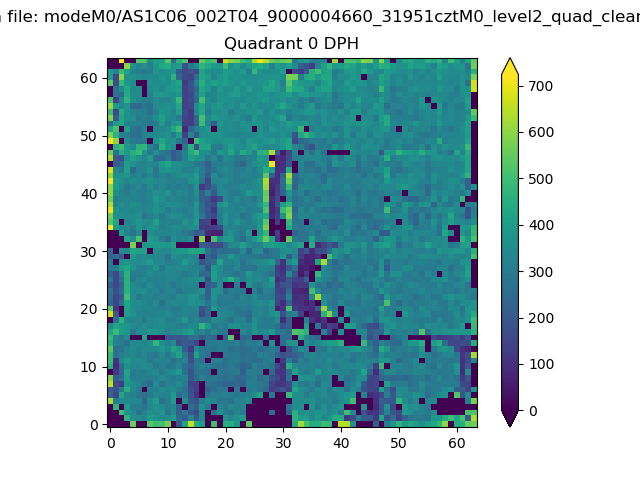 |
 |
Quadrant B |
|---|---|---|---|
| Quadrant D | 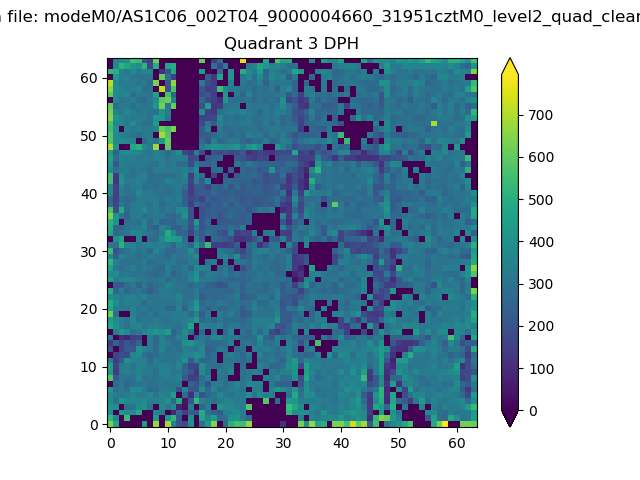 |
 |
Quadrant C |
| Plot type | Count rate plots | Images |
|---|---|---|
| Comparison with Poisson distribution Blue bars denote a histogram of data divided into 1 sec bins. Red curve is a Poisson curve with rate = median count rate of data. |
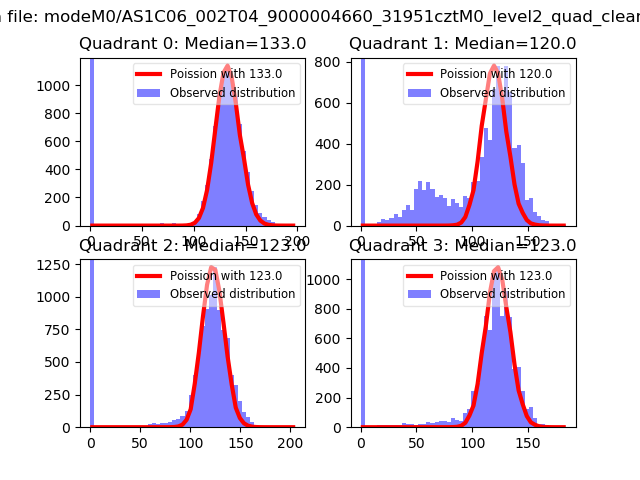 |
 |
| Quadrant-wise count rates Data is divided into 100 sec bins |
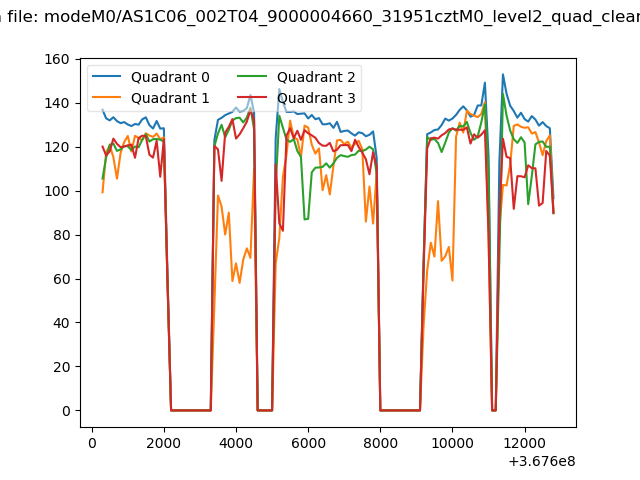 |
|
| Module-wise count rates for Quadrant A Data is divided into 100 sec bins |
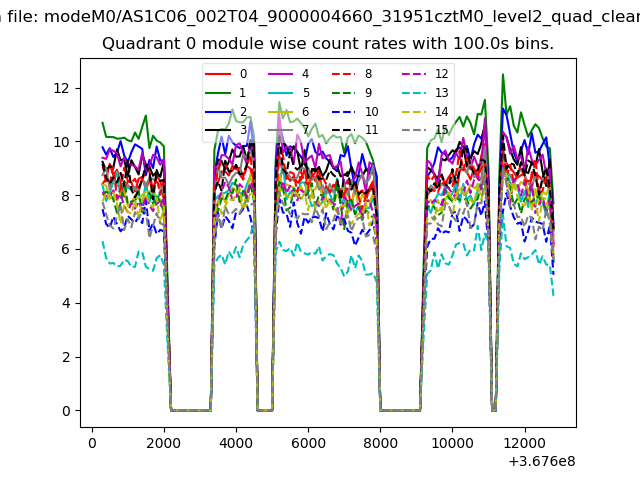 |
 |
| Module-wise count rates for Quadrant B Data is divided into 100 sec bins |
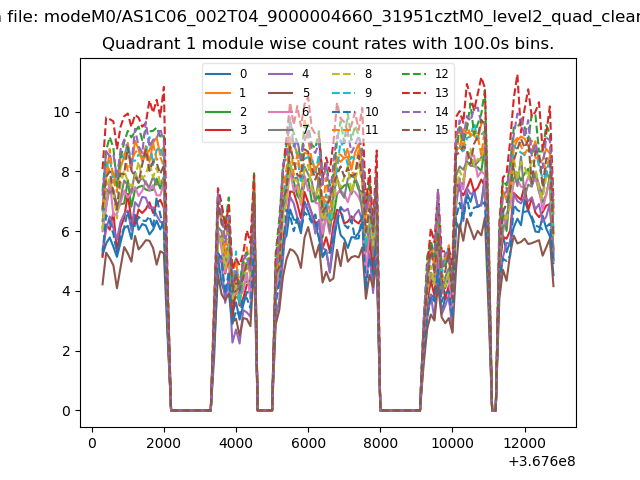 |
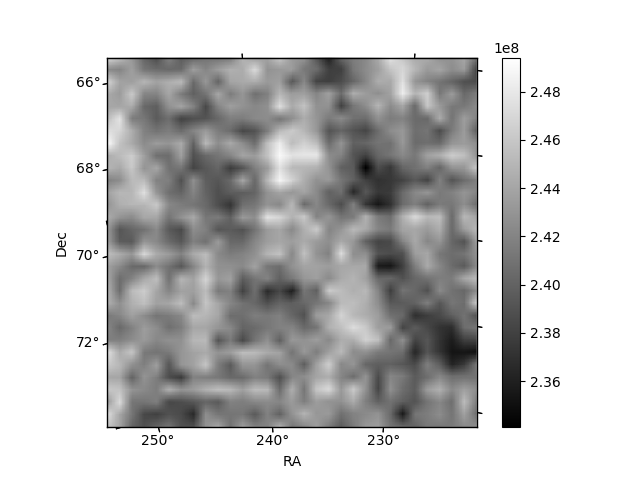 |
| Module-wise count rates for Quadrant C Data is divided into 100 sec bins |
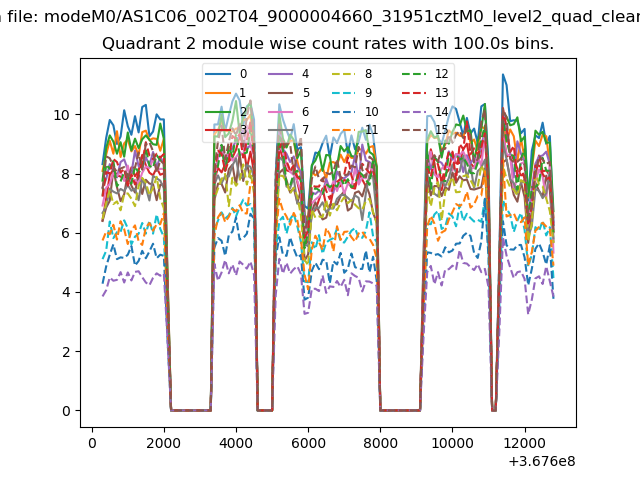 |
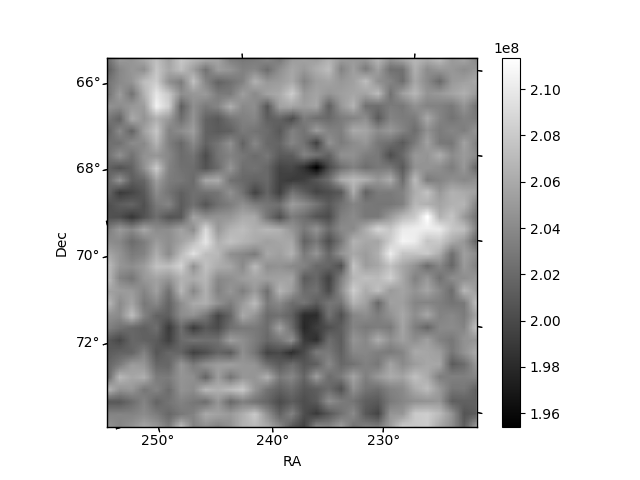 |
| Module-wise count rates for Quadrant D Data is divided into 100 sec bins |
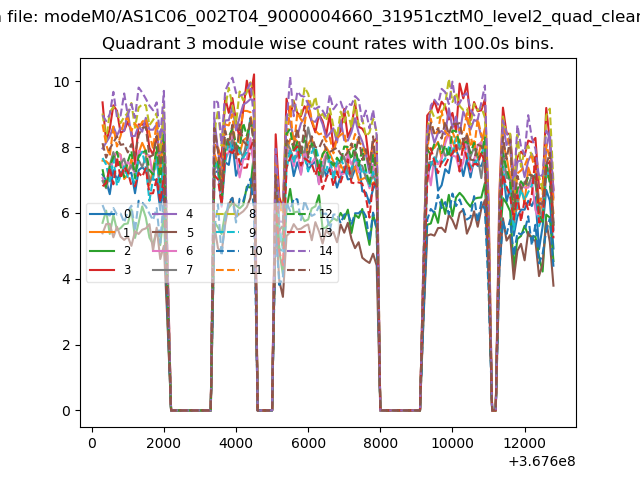 |
 |
| Parameter | Plot |
|---|---|
| CZT HV Monitor |  |
| D_VDD | 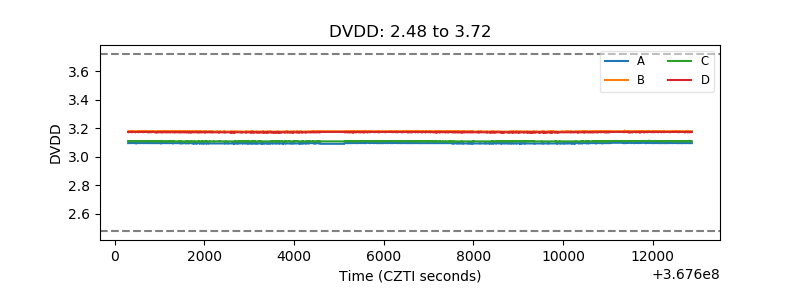 |
| Temperature 1 | 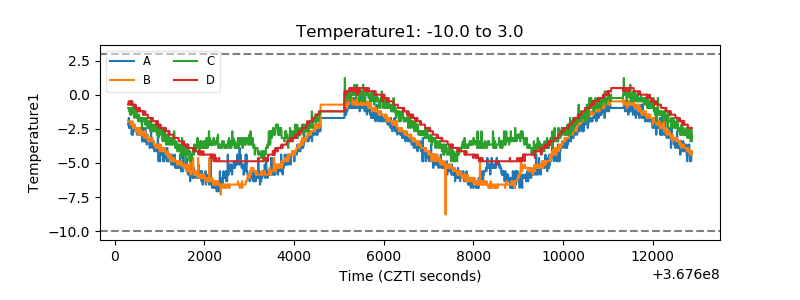 |
| Veto HV Monitor | 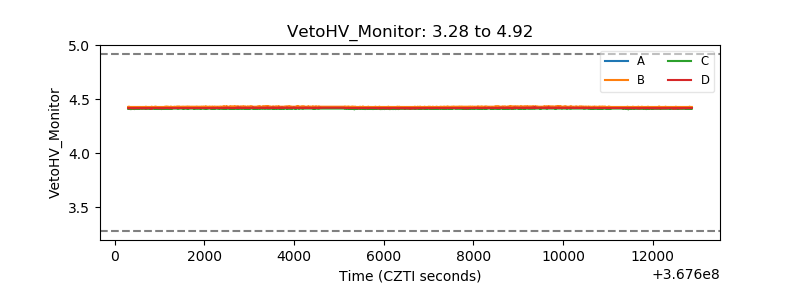 |
| Veto LLD | 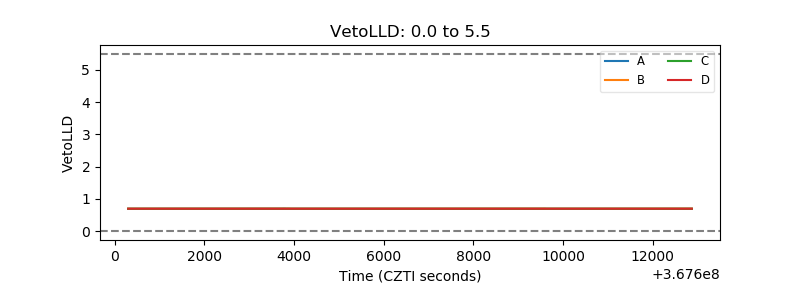 |
| Alpha Counter | 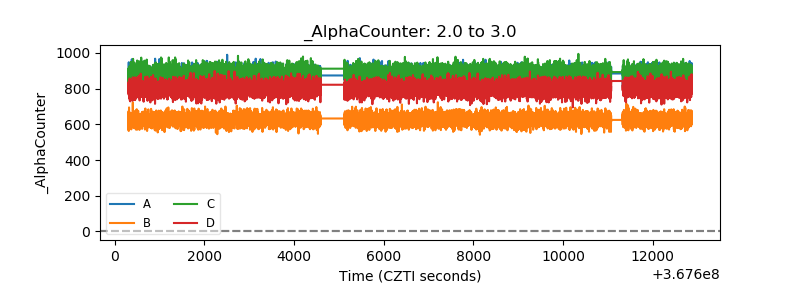 |
| _CPM_Rate | 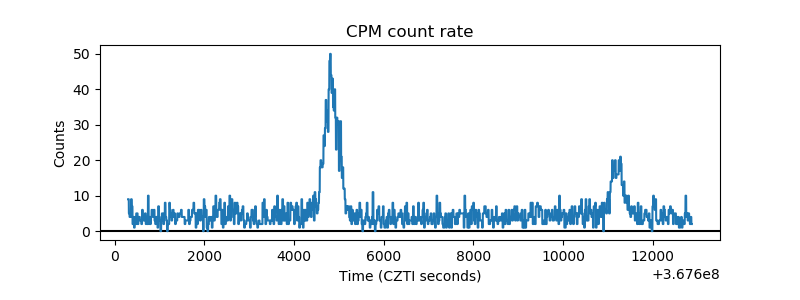 |
| CZT Counter | 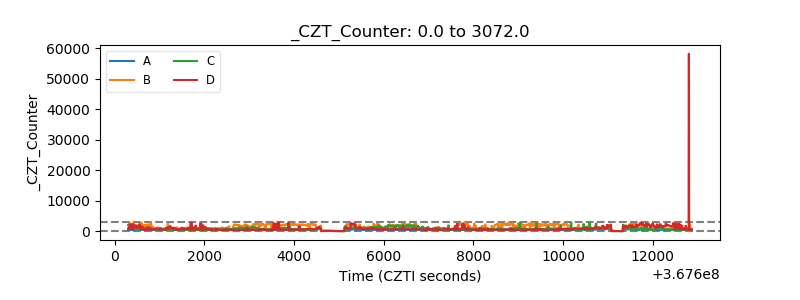 |
| +2.5 Volts monitor |  |
| +5 Volts monitor |  |
| _ROLL_ROT | 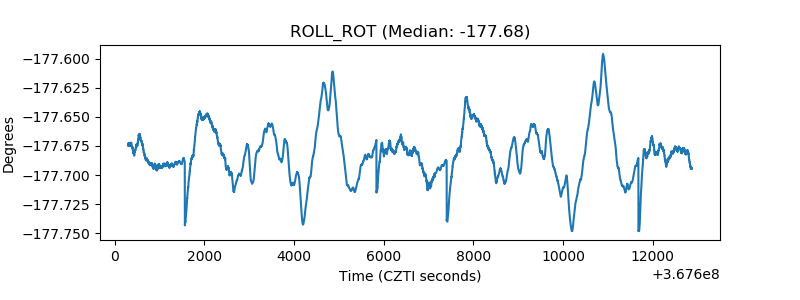 |
| _Roll_DEC | 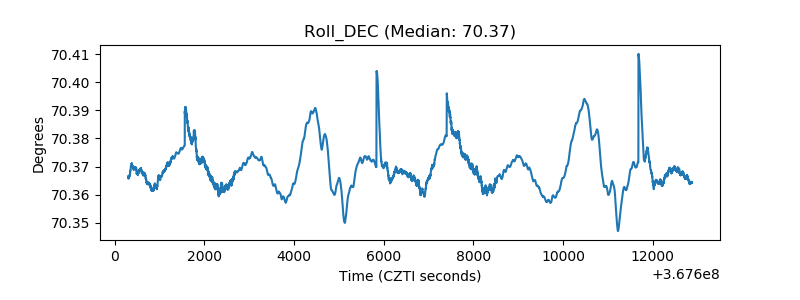 |
| _Roll_RA | 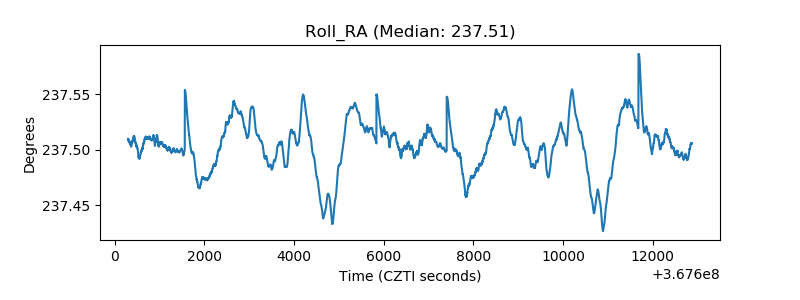 |
| Veto Counter |  |