| Param | Original file | Final file |
|---|---|---|
| Filename | modeM0/AS1C06_002T04_9000004660_31952cztM0_level2.evt | modeM0/AS1C06_002T04_9000004660_31952cztM0_level2_quad_clean.evt |
| Size (bytes) | 762,275,520 | 114,073,920 |
| Size | 727.0 MB | 108.8 MB |
| Events in quadrant A | 3,371,790 | 788,770 |
| Events in quadrant B | 7,866,222 | 738,238 |
| Events in quadrant C | 4,426,000 | 732,031 |
| Events in quadrant D | 6,931,145 | 689,415 |
| Mode SS | |||
|---|---|---|---|
| Quadrant | BADHDUFLAG | Total packets | Discarded packets |
| A | 0 | 148 | 0 |
| B | 0 | 148 | 0 |
| C | 0 | 148 | 0 |
| D | 0 | 148 | 0 |
| Mode M0 | |||
|---|---|---|---|
| Quadrant | BADHDUFLAG | Total packets | Discarded packets |
| A | 0 | 14869 | 1 |
| B | 0 | 28523 | 1 |
| C | 0 | 18132 | 1 |
| D | 0 | 25462 | 1 |
| Mode M9 | |||
|---|---|---|---|
| Quadrant | BADHDUFLAG | Total packets | Discarded packets |
| A | 0 | 3 | 0 |
| B | 0 | 3 | 0 |
| C | 0 | 3 | 0 |
| D | 0 | 3 | 0 |
| Quadrant | Total seconds | Saturated seconds | Saturation percentage |
|---|---|---|---|
| A | 7260 | 31 | 0.426997% |
| B | 7260 | 984 | 13.553719% |
| C | 7260 | 316 | 4.352617% |
| D | 7260 | 985 | 13.567493% |
Noise dominated data is calculated using 1-second bins in cleaned event files. If a bin has >2000 counts, and if more than 50% of those come from <1% of pixels, then it is considered to be noise-dominated and hence unusable.
| Quadrant | # 1 sec bins | Bins with >0 counts | Bins with >2000 counts | High rate bins dominated by noise | Noise dominated (total time) | Noise dominated (detector-on time) | Marked lightcurve |
|---|---|---|---|---|---|---|---|
| A | 7595 | 7261 | 1 | 1 | 0.01% | 0.01% | 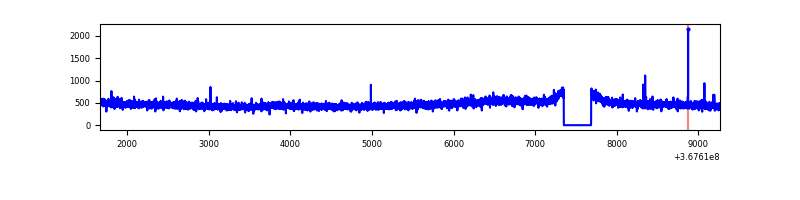 |
| B | 7595 | 7260 | 606 | 606 | 7.98% | 8.35% |  |
| C | 7595 | 7260 | 19 | 19 | 0.25% | 0.26% |  |
| D | 7595 | 7260 | 822 | 822 | 10.82% | 11.32% | 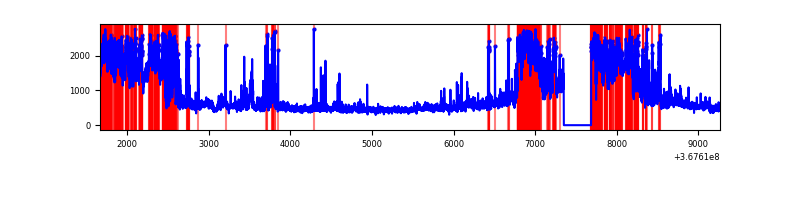 |
Top three noisy pixels from each quadrant. If the there are fewer than three noisy pixels in the level2.evt file, extra rows are filled as -1
| Pixel properties | Quadrant properties | ||||||
|---|---|---|---|---|---|---|---|
| Quadrant | DetID | PixID | Counts | Sigma | Mean | Median | Sigma |
| A | 13 | 6 | 16188 | 88.62 | 864 | 844 | 173.1 |
| A | 13 | 254 | 14980 | 81.64 | 864 | 844 | 173.1 |
| A | 0 | 78 | 9736 | 51.36 | 864 | 844 | 173.1 |
| B | 6 | 159 | 2117747 | 13651.17 | 813 | 790 | 155.1 |
| B | 4 | 80 | 2052895 | 13232.97 | 813 | 790 | 155.1 |
| B | 5 | 172 | 216279 | 1389.58 | 813 | 790 | 155.1 |
| C | 3 | 233 | 845543 | 4432.78 | 818 | 822 | 190.6 |
| C | 14 | 238 | 154382 | 805.83 | 818 | 822 | 190.6 |
| C | 0 | 10 | 153819 | 802.87 | 818 | 822 | 190.6 |
| D | 8 | 195 | 1457559 | 7591.79 | 801 | 779 | 191.9 |
| D | 12 | 33 | 952778 | 4961.2 | 801 | 779 | 191.9 |
| D | 12 | 233 | 753997 | 3925.28 | 801 | 779 | 191.9 |
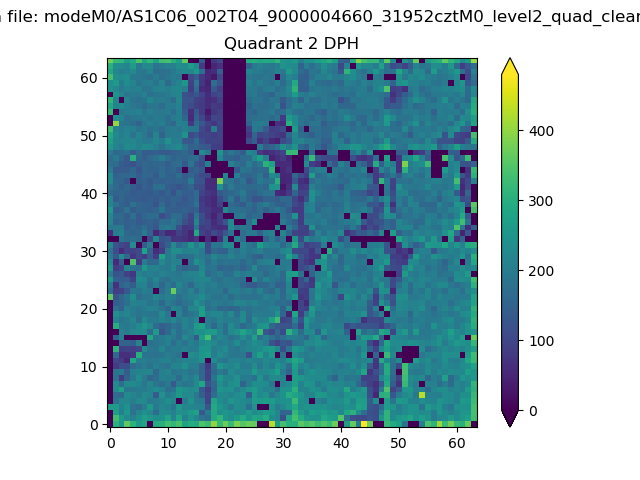
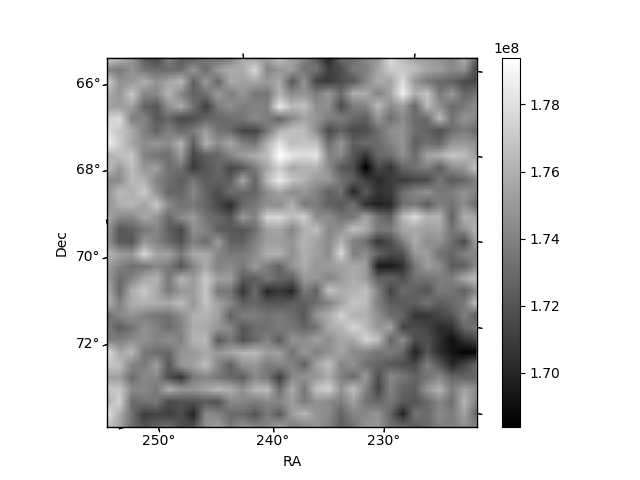
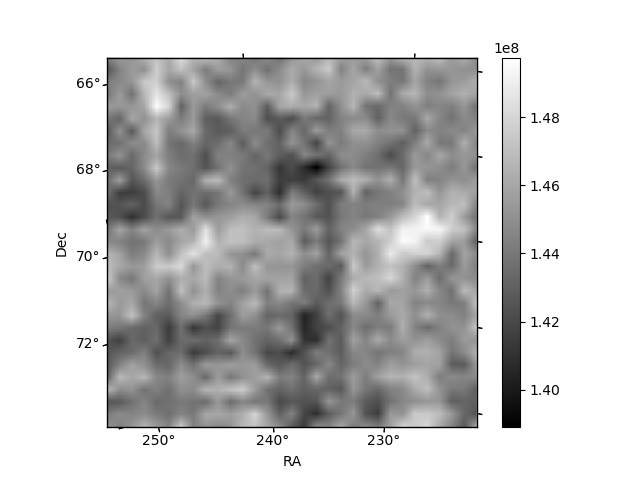
Histogram calculated using DETX and DETY for each event in the final _common_clean file
| Quadrant A | 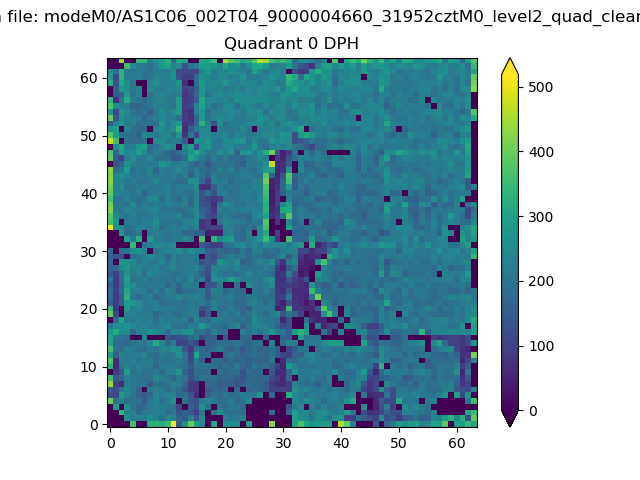 |
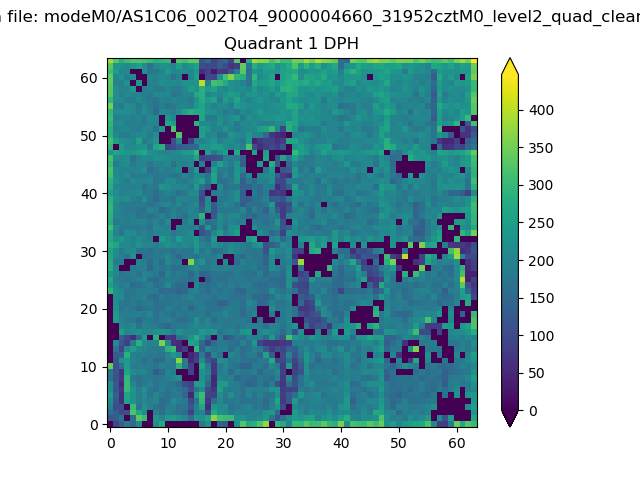 |
Quadrant B |
|---|---|---|---|
| Quadrant D | 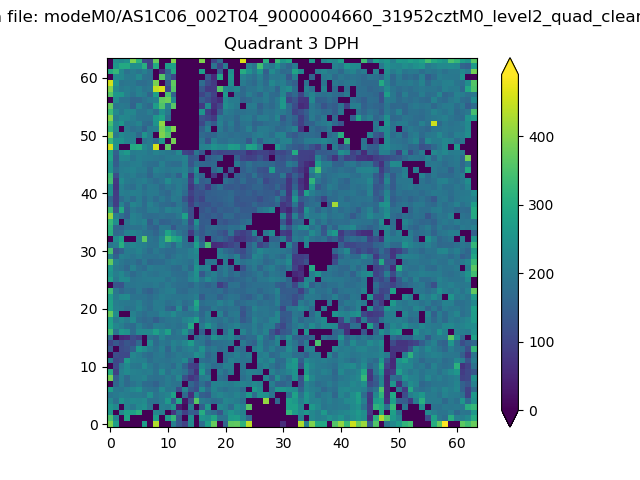 |
 |
Quadrant C |
| Plot type | Count rate plots | Images |
|---|---|---|
| Comparison with Poisson distribution Blue bars denote a histogram of data divided into 1 sec bins. Red curve is a Poisson curve with rate = median count rate of data. |
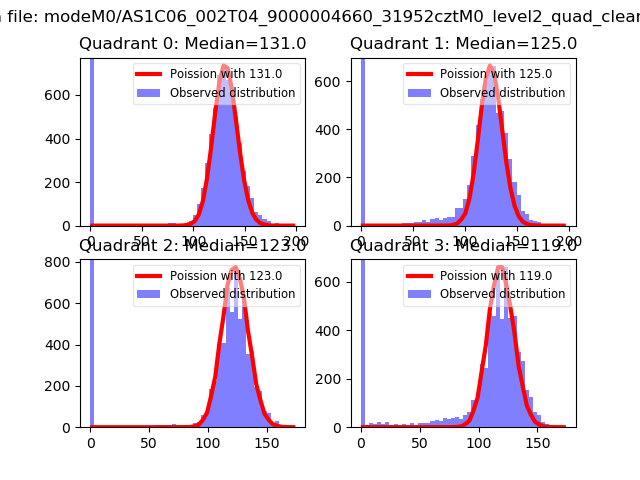 |
 |
| Quadrant-wise count rates Data is divided into 100 sec bins |
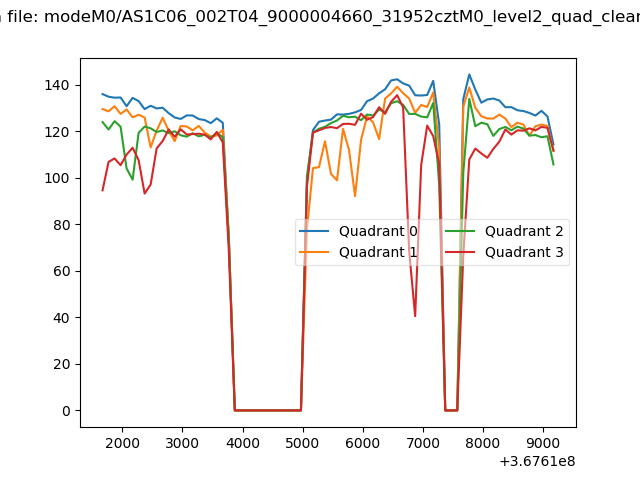 |
|
| Module-wise count rates for Quadrant A Data is divided into 100 sec bins |
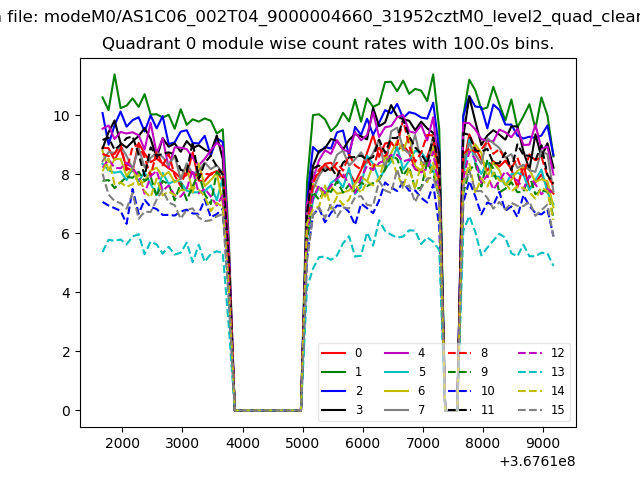 |
 |
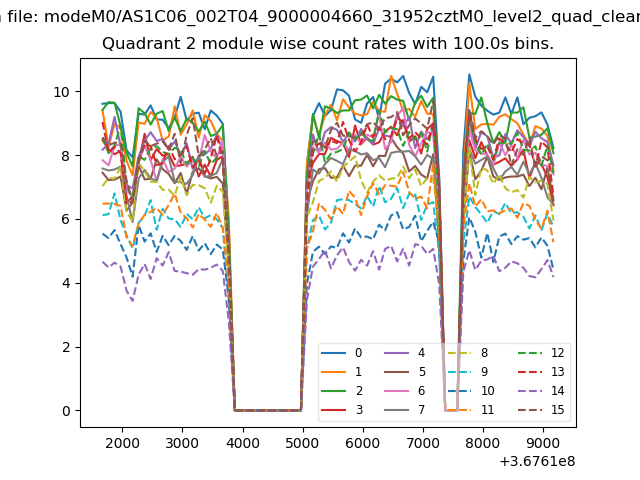
| Module-wise count rates for Quadrant B Data is divided into 100 sec bins |
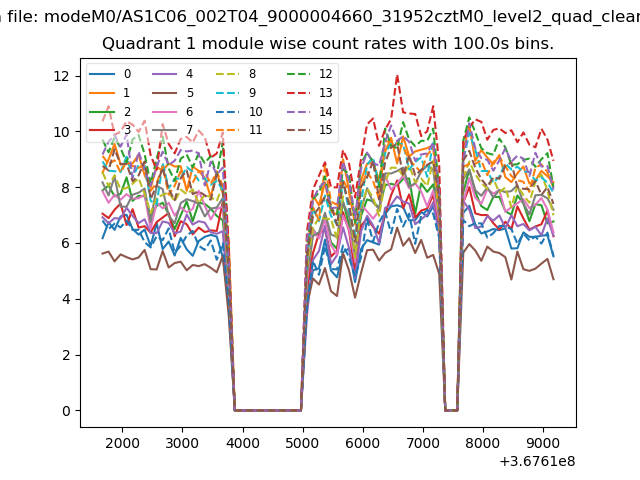 |
 |
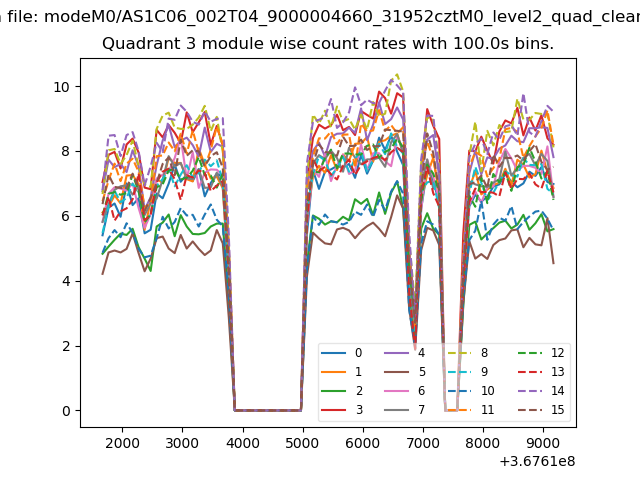
| Module-wise count rates for Quadrant C Data is divided into 100 sec bins |
 |
 |
| Module-wise count rates for Quadrant D Data is divided into 100 sec bins |
 |
 |
| Parameter | Plot |
|---|---|
| CZT HV Monitor |  |
| D_VDD | 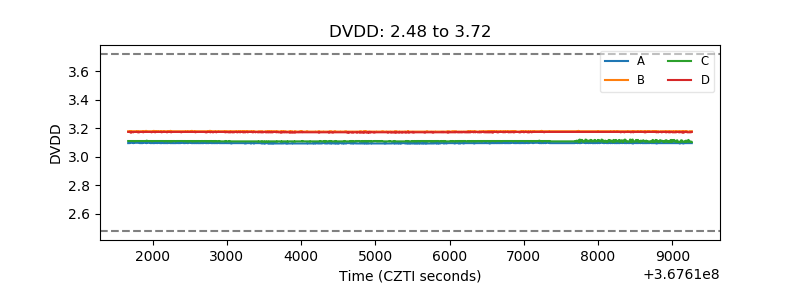 |
| Temperature 1 | 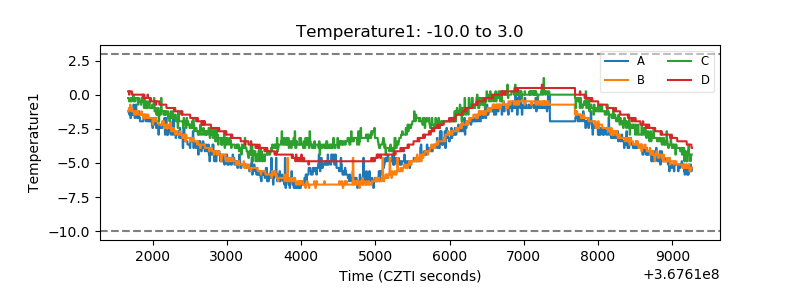 |
| Veto HV Monitor | 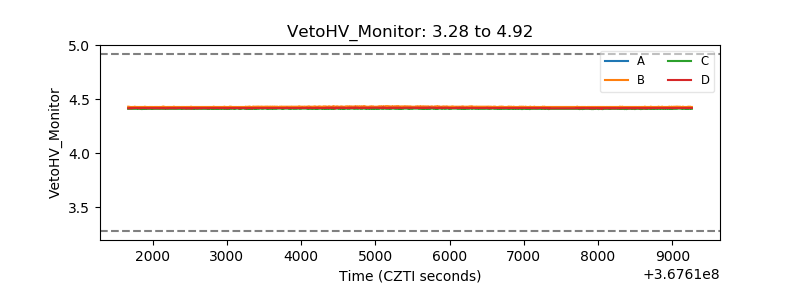 |
| Veto LLD | 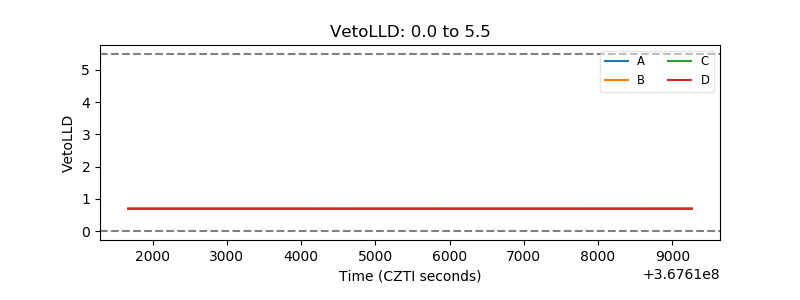 |
| Alpha Counter | 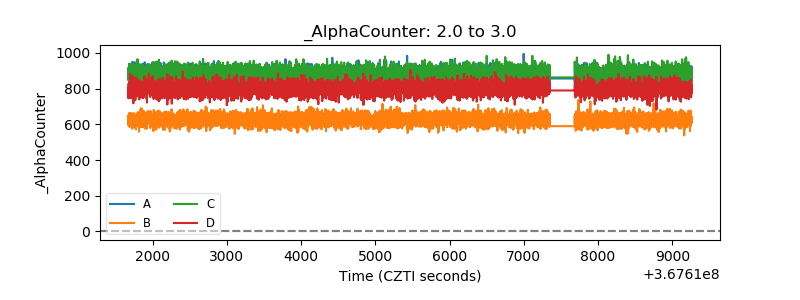 |
| _CPM_Rate | 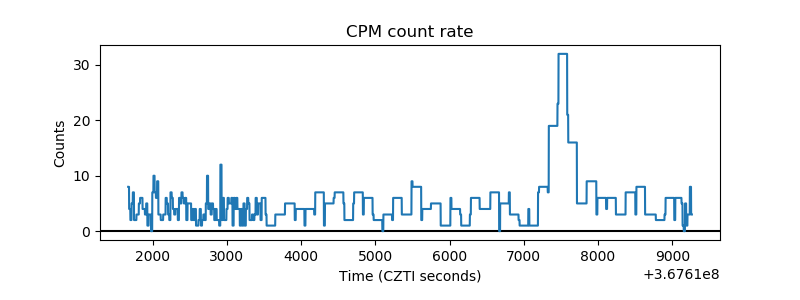 |
| CZT Counter | 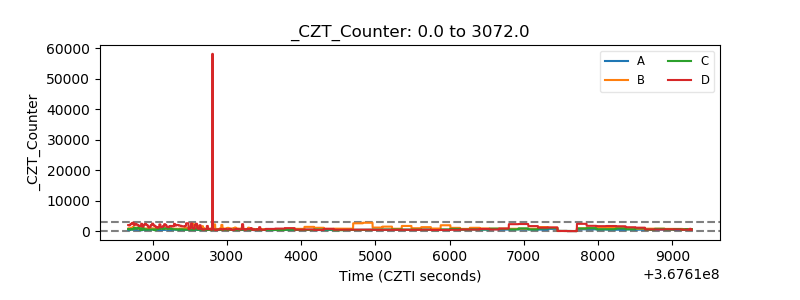 |
| +2.5 Volts monitor |  |
| +5 Volts monitor |  |
| _ROLL_ROT | 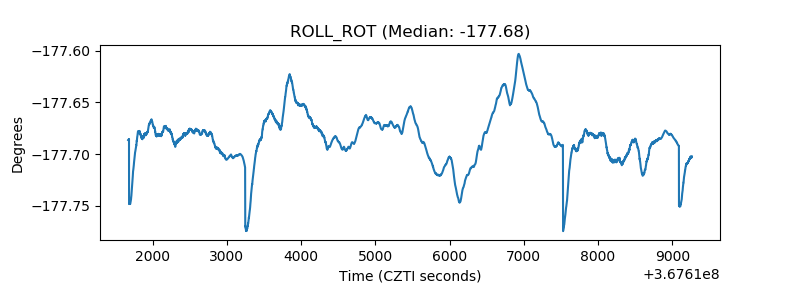 |
| _Roll_DEC | 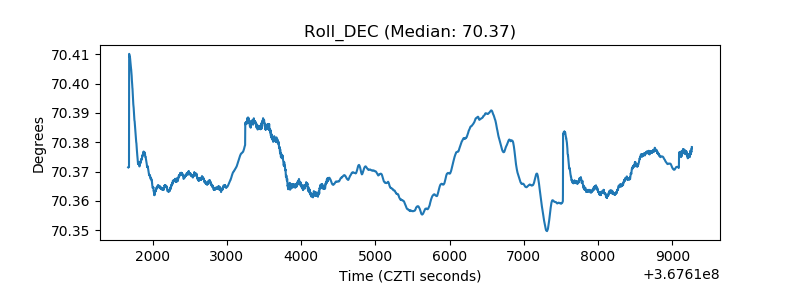 |
| _Roll_RA | 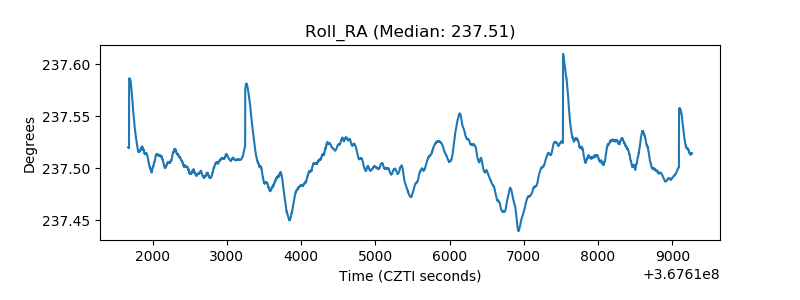 |
| Veto Counter | 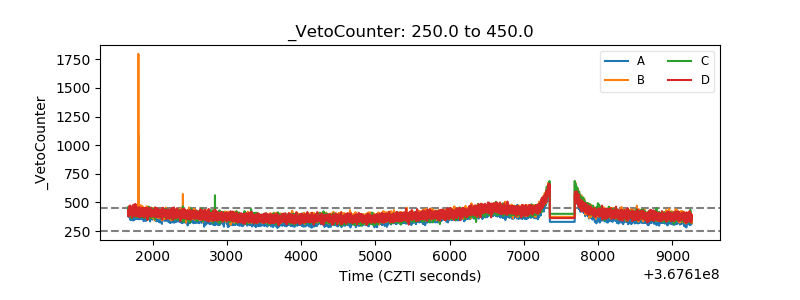 |