| Param | Original file | Final file |
|---|---|---|
| Filename | modeM0/AS1C06_002T04_9000004660_31955cztM0_level2.evt | modeM0/AS1C06_002T04_9000004660_31955cztM0_level2_quad_clean.evt |
| Size (bytes) | 906,877,440 | 127,563,840 |
| Size | 864.9 MB | 121.7 MB |
| Events in quadrant A | 4,305,756 | 862,221 |
| Events in quadrant B | 8,317,272 | 796,037 |
| Events in quadrant C | 6,906,695 | 777,435 |
| Events in quadrant D | 7,302,450 | 776,315 |
| Mode SS | |||
|---|---|---|---|
| Quadrant | BADHDUFLAG | Total packets | Discarded packets |
| A | 0 | 206 | 14 |
| B | 0 | 208 | 22 |
| C | 0 | 208 | 18 |
| D | 0 | 205 | 15 |
| Mode M0 | |||
|---|---|---|---|
| Quadrant | BADHDUFLAG | Total packets | Discarded packets |
| A | 0 | 20855 | 1726 |
| B | 0 | 35192 | 3145 |
| C | 0 | 29515 | 2623 |
| D | 0 | 30977 | 2663 |
| Quadrant | Total seconds | Saturated seconds | Saturation percentage |
|---|---|---|---|
| A | 9422 | 19 | 0.201656% |
| B | 9321 | 598 | 6.415621% |
| C | 9344 | 567 | 6.068065% |
| D | 9395 | 650 | 6.918574% |
Noise dominated data is calculated using 1-second bins in cleaned event files. If a bin has >2000 counts, and if more than 50% of those come from <1% of pixels, then it is considered to be noise-dominated and hence unusable.
| Quadrant | # 1 sec bins | Bins with >0 counts | Bins with >2000 counts | High rate bins dominated by noise | Noise dominated (total time) | Noise dominated (detector-on time) | Marked lightcurve |
|---|---|---|---|---|---|---|---|
| A | 17234 | 9563 | 5 | 5 | 0.03% | 0.05% |  |
| B | 17229 | 9475 | 402 | 402 | 2.33% | 4.24% | 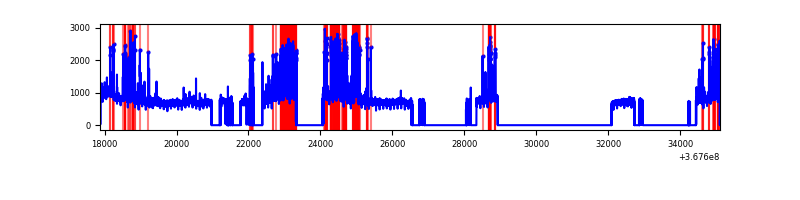 |
| C | 17226 | 9501 | 101 | 101 | 0.59% | 1.06% | 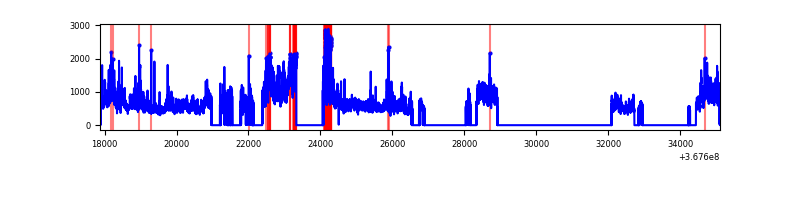 |
| D | 17228 | 9542 | 589 | 589 | 3.42% | 6.17% |  |
Top three noisy pixels from each quadrant. If the there are fewer than three noisy pixels in the level2.evt file, extra rows are filled as -1
| Pixel properties | Quadrant properties | ||||||
|---|---|---|---|---|---|---|---|
| Quadrant | DetID | PixID | Counts | Sigma | Mean | Median | Sigma |
| A | 12 | 96 | 29219 | 127.46 | 1097 | 1073 | 220.8 |
| A | 13 | 6 | 24965 | 108.2 | 1097 | 1073 | 220.8 |
| A | 13 | 254 | 18799 | 80.27 | 1097 | 1073 | 220.8 |
| B | 6 | 159 | 2649610 | 13365.6 | 1044 | 1018 | 198.2 |
| B | 12 | 18 | 507570 | 2556.21 | 1044 | 1018 | 198.2 |
| B | 5 | 172 | 506216 | 2549.38 | 1044 | 1018 | 198.2 |
| C | 3 | 233 | 2324289 | 9657.13 | 1025 | 1030 | 240.6 |
| C | 0 | 10 | 325500 | 1348.73 | 1025 | 1030 | 240.6 |
| C | 14 | 238 | 185555 | 767.02 | 1025 | 1030 | 240.6 |
| D | 13 | 249 | 1152405 | 4664.19 | 1035 | 1009 | 246.9 |
| D | 8 | 195 | 813028 | 3289.4 | 1035 | 1009 | 246.9 |
| D | 12 | 33 | 490442 | 1982.64 | 1035 | 1009 | 246.9 |
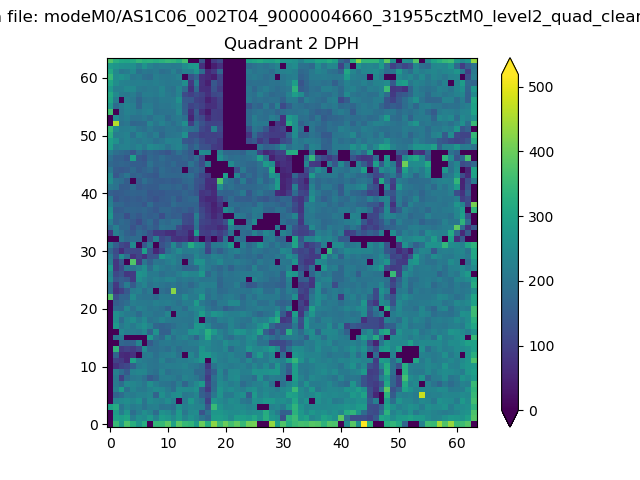
Histogram calculated using DETX and DETY for each event in the final _common_clean file
| Quadrant A | 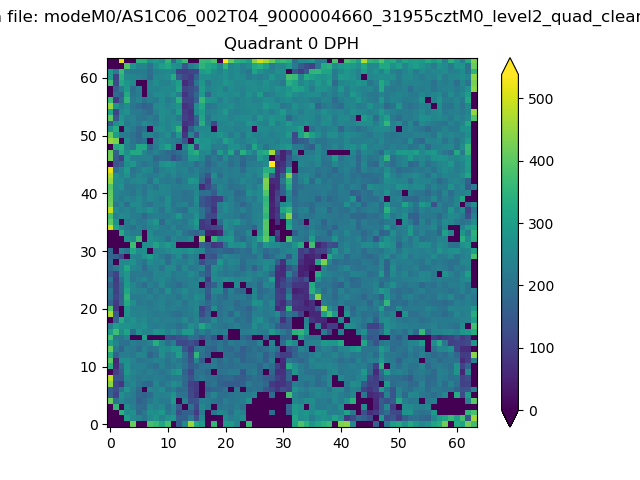 |
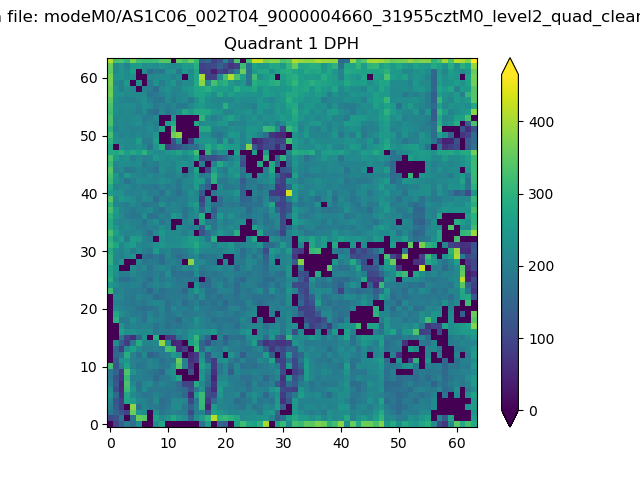 |
Quadrant B |
|---|---|---|---|
| Quadrant D | 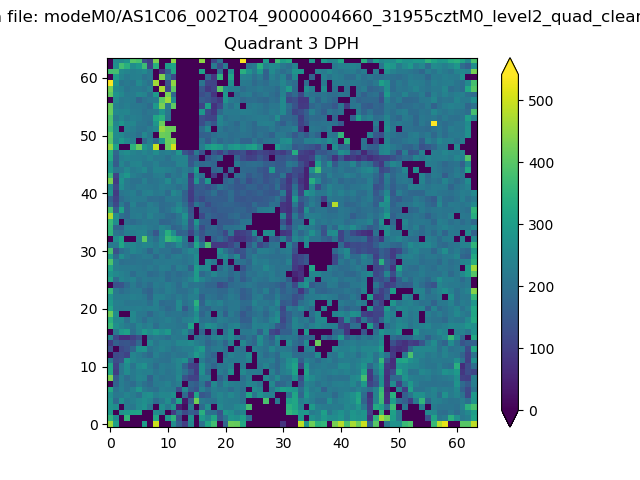 |
 |
Quadrant C |
| Plot type | Count rate plots | Images |
|---|---|---|
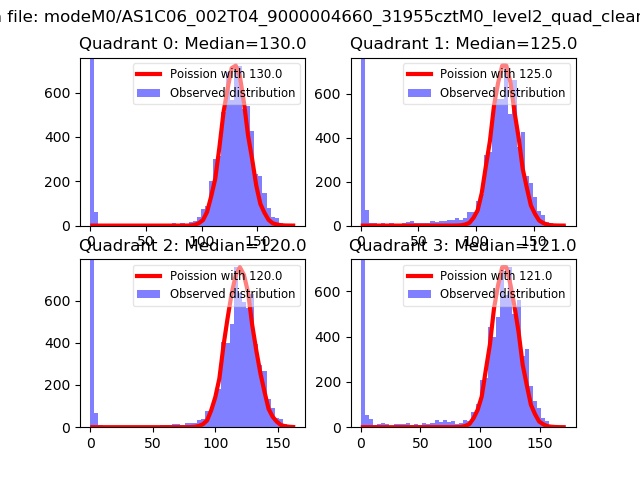
| Comparison with Poisson distribution Blue bars denote a histogram of data divided into 1 sec bins. Red curve is a Poisson curve with rate = median count rate of data. |
 |
 |
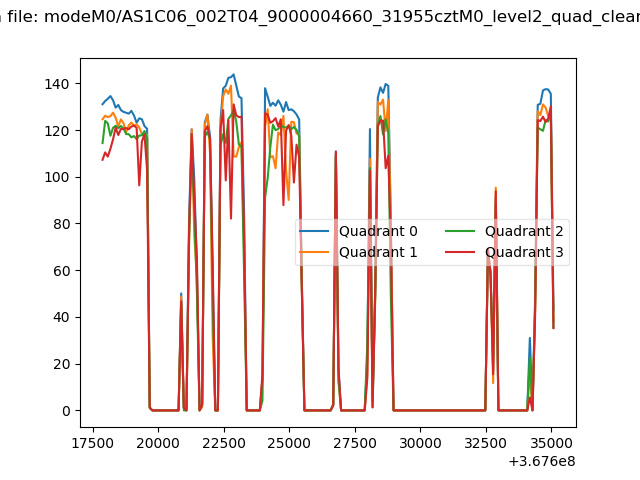
| Quadrant-wise count rates Data is divided into 100 sec bins |
 |
|
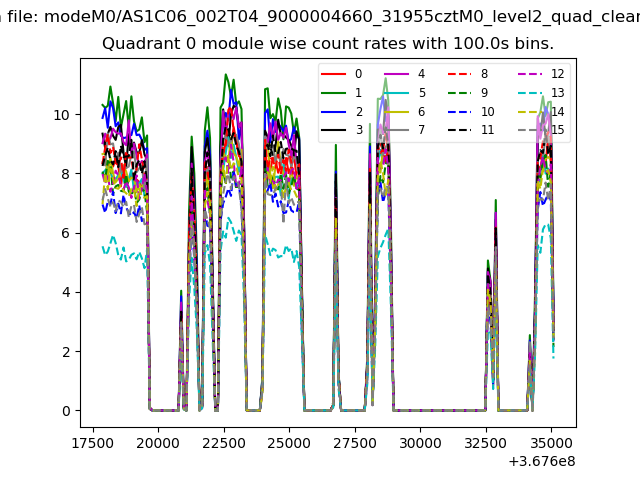
| Module-wise count rates for Quadrant A Data is divided into 100 sec bins |
 |
 |
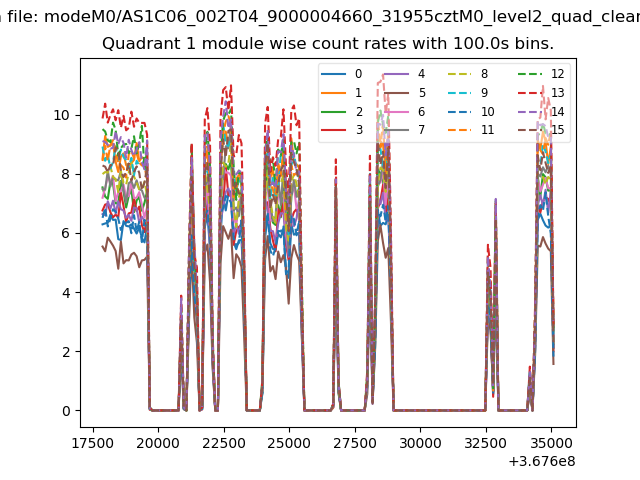
| Module-wise count rates for Quadrant B Data is divided into 100 sec bins |
 |
 |
| Module-wise count rates for Quadrant C Data is divided into 100 sec bins |
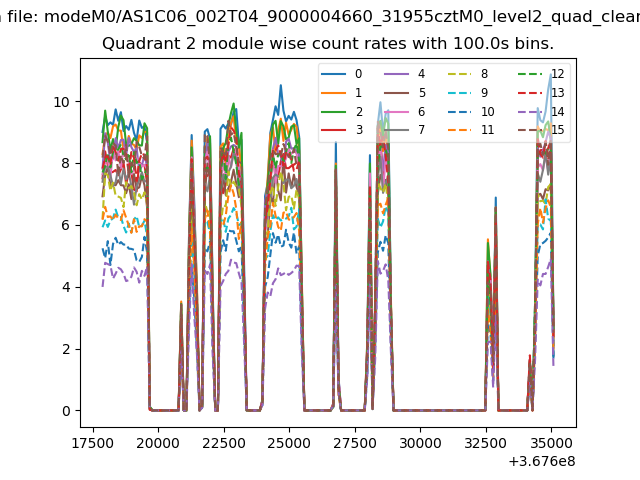 |
 |
| Module-wise count rates for Quadrant D Data is divided into 100 sec bins |
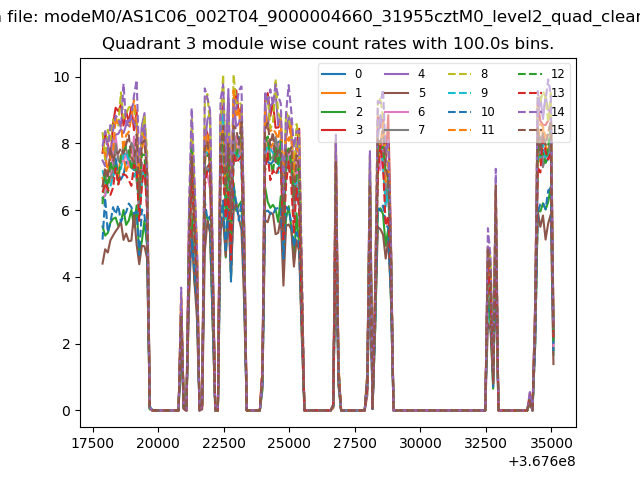 |
 |
| Parameter | Plot |
|---|---|
| CZT HV Monitor | 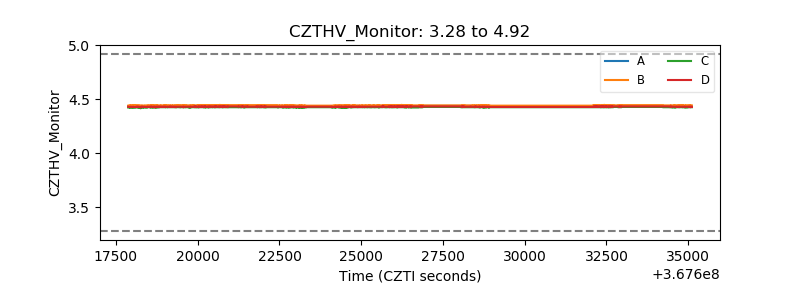 |
| D_VDD | 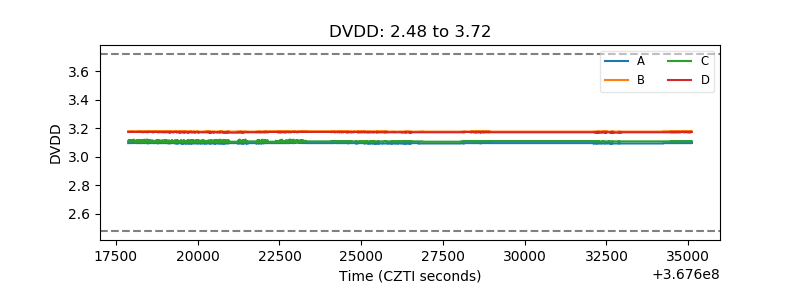 |
| Temperature 1 | 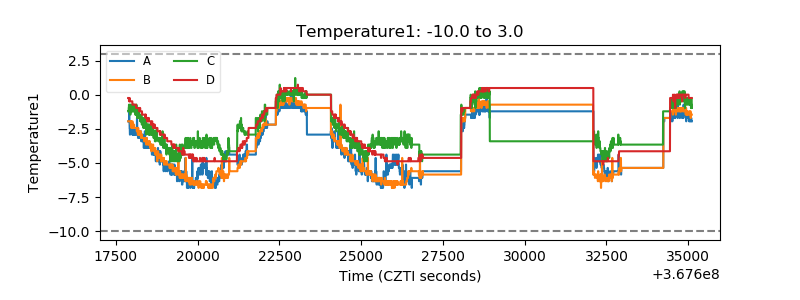 |
| Veto HV Monitor | 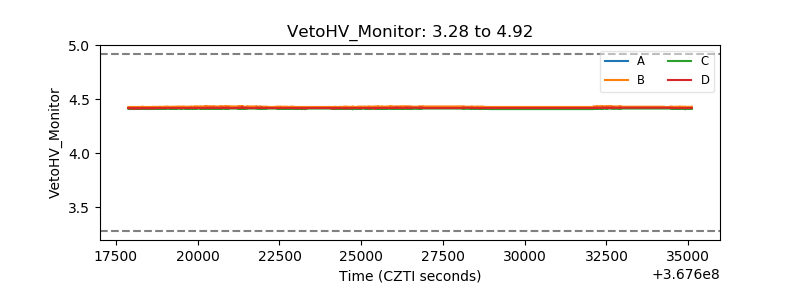 |
| Veto LLD | 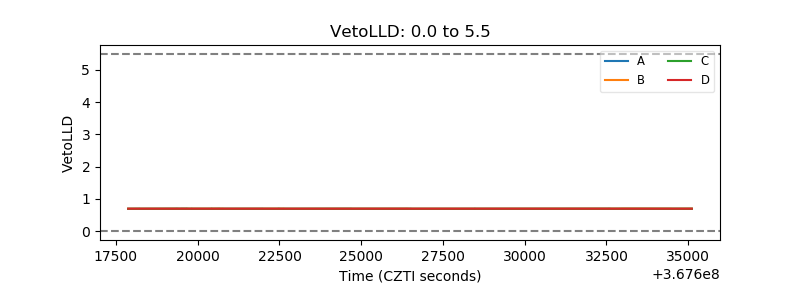 |
| Alpha Counter | 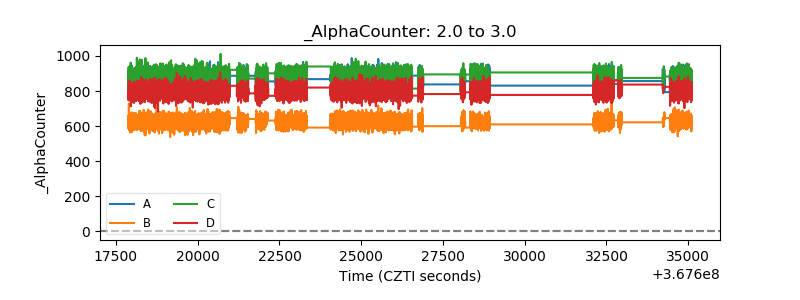 |
| _CPM_Rate | 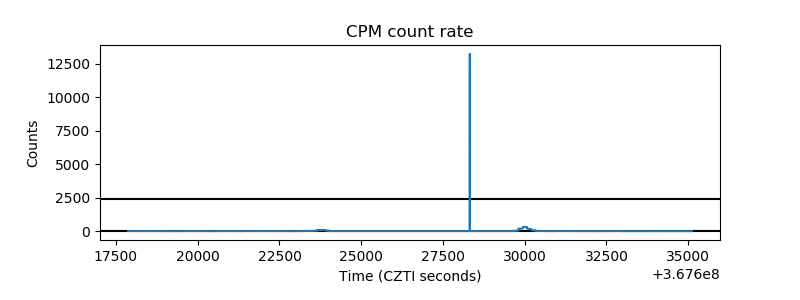 |
| CZT Counter | 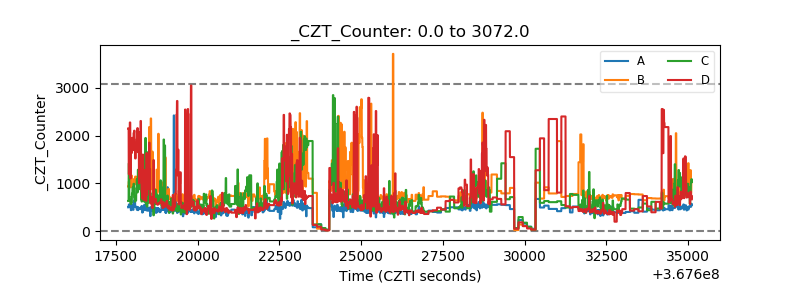 |
| +2.5 Volts monitor |  |
| +5 Volts monitor |  |
| _ROLL_ROT | 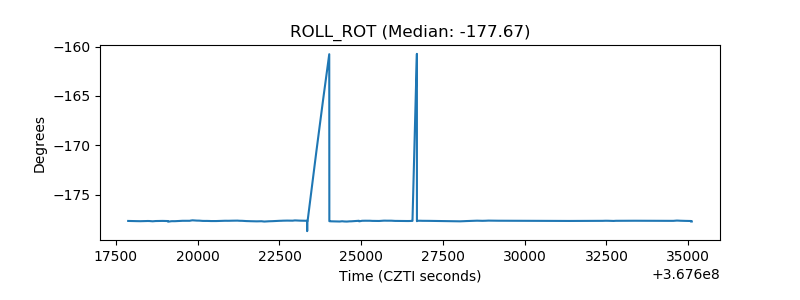 |
| _Roll_DEC | 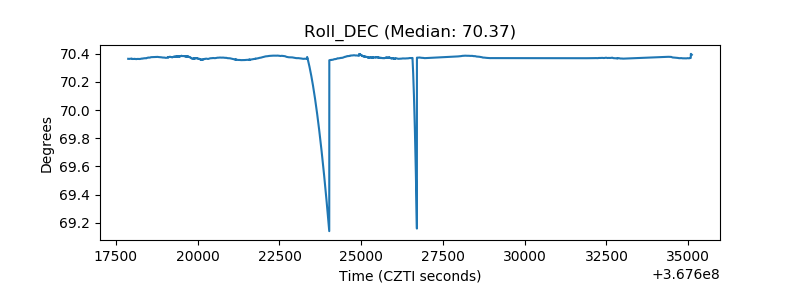 |
| _Roll_RA | 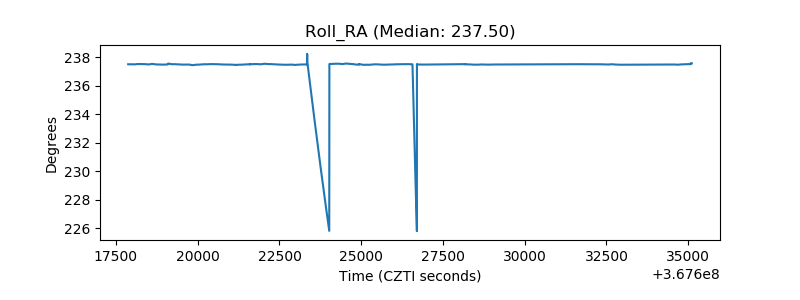 |
| Veto Counter | 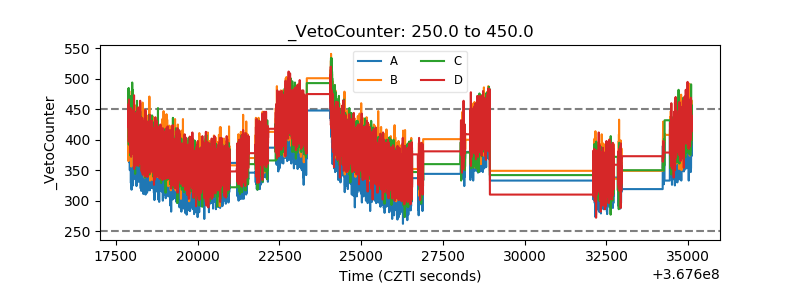 |