| Param | Original file | Final file |
|---|---|---|
| Filename | modeM0/AS1C06_002T04_9000004660_31956cztM0_level2.evt | modeM0/AS1C06_002T04_9000004660_31956cztM0_level2_quad_clean.evt |
| Size (bytes) | 1,722,672,000 | 264,798,720 |
| Size | 1.6 GB | 252.5 MB |
| Events in quadrant A | 8,610,344 | 1,813,121 |
| Events in quadrant B | 15,065,397 | 1,715,466 |
| Events in quadrant C | 13,818,888 | 1,626,433 |
| Events in quadrant D | 13,465,010 | 1,623,720 |
| Mode SS | |||
|---|---|---|---|
| Quadrant | BADHDUFLAG | Total packets | Discarded packets |
| A | 0 | 396 | 24 |
| B | 0 | 398 | 30 |
| C | 0 | 397 | 25 |
| D | 0 | 397 | 23 |
| Mode M0 | |||
|---|---|---|---|
| Quadrant | BADHDUFLAG | Total packets | Discarded packets |
| A | 0 | 40045 | 2803 |
| B | 0 | 63621 | 5468 |
| C | 0 | 57318 | 3991 |
| D | 0 | 57035 | 4359 |
| Mode M9 | |||
|---|---|---|---|
| Quadrant | BADHDUFLAG | Total packets | Discarded packets |
| A | 0 | 30 | 0 |
| B | 0 | 32 | 2 |
| C | 0 | 31 | 1 |
| D | 0 | 30 | 0 |
| Quadrant | Total seconds | Saturated seconds | Saturation percentage |
|---|---|---|---|
| A | 18127 | 70 | 0.386164% |
| B | 17792 | 900 | 5.058453% |
| C | 18023 | 1913 | 10.614215% |
| D | 17936 | 1183 | 6.595674% |
Noise dominated data is calculated using 1-second bins in cleaned event files. If a bin has >2000 counts, and if more than 50% of those come from <1% of pixels, then it is considered to be noise-dominated and hence unusable.
| Quadrant | # 1 sec bins | Bins with >0 counts | Bins with >2000 counts | High rate bins dominated by noise | Noise dominated (total time) | Noise dominated (detector-on time) | Marked lightcurve |
|---|---|---|---|---|---|---|---|
| A | 23313 | 18614 | 1 | 1 | 0.00% | 0.01% | 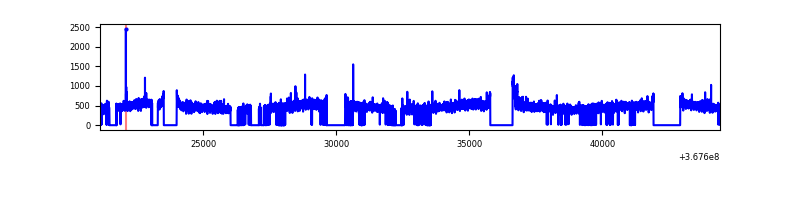 |
| B | 23313 | 18393 | 444 | 444 | 1.90% | 2.41% | 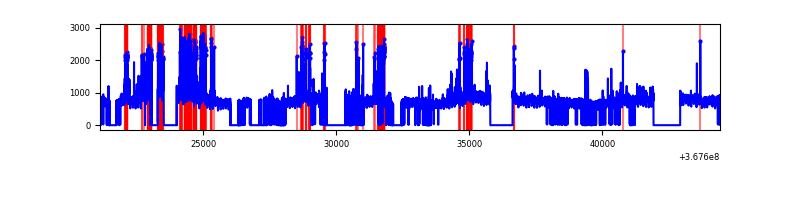 |
| C | 23320 | 18537 | 197 | 197 | 0.84% | 1.06% |  |
| D | 23316 | 18454 | 952 | 952 | 4.08% | 5.16% | 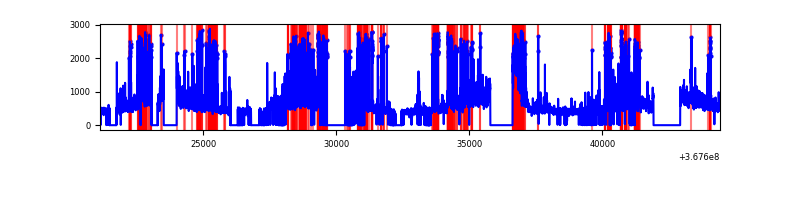 |
Top three noisy pixels from each quadrant. If the there are fewer than three noisy pixels in the level2.evt file, extra rows are filled as -1
| Pixel properties | Quadrant properties | ||||||
|---|---|---|---|---|---|---|---|
| Quadrant | DetID | PixID | Counts | Sigma | Mean | Median | Sigma |
| A | 13 | 170 | 60097 | 132.58 | 2197 | 2152 | 437.1 |
| A | 14 | 238 | 40070 | 86.76 | 2197 | 2152 | 437.1 |
| A | 13 | 254 | 34493 | 74.0 | 2197 | 2152 | 437.1 |
| B | 6 | 159 | 4971509 | 12713.32 | 2089 | 2038 | 390.9 |
| B | 12 | 18 | 800289 | 2042.15 | 2089 | 2038 | 390.9 |
| B | 5 | 172 | 462425 | 1177.8 | 2089 | 2038 | 390.9 |
| C | 3 | 233 | 4677458 | 9964.58 | 2005 | 2014 | 469.2 |
| C | 0 | 10 | 628590 | 1335.39 | 2005 | 2014 | 469.2 |
| C | 14 | 238 | 451881 | 958.78 | 2005 | 2014 | 469.2 |
| D | 8 | 195 | 1920858 | 3917.2 | 2050 | 1992 | 489.9 |
| D | 13 | 249 | 1679259 | 3424.0 | 2050 | 1992 | 489.9 |
| D | 12 | 218 | 857821 | 1747.1 | 2050 | 1992 | 489.9 |
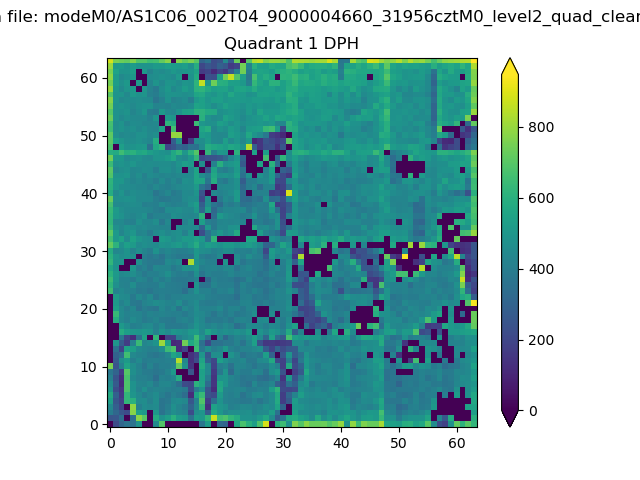
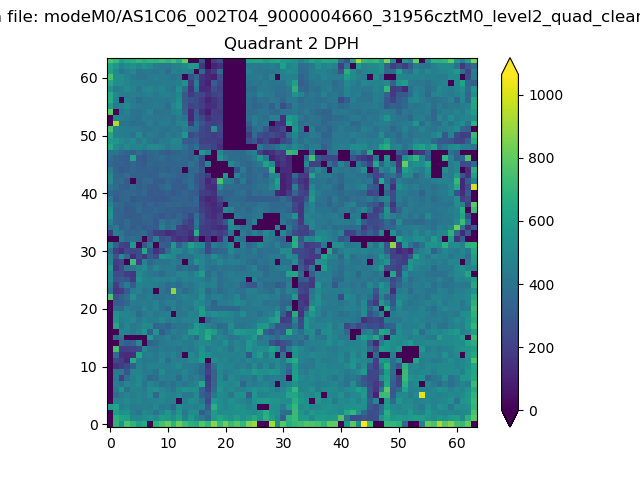
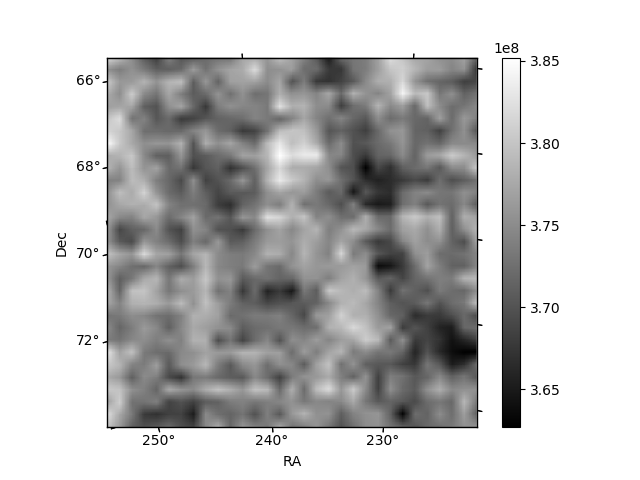
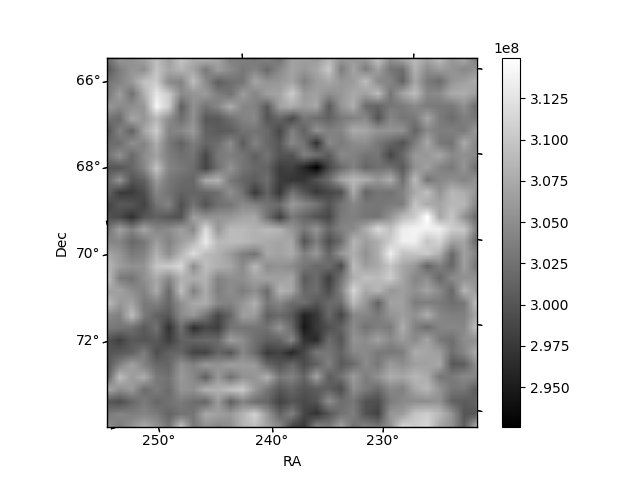
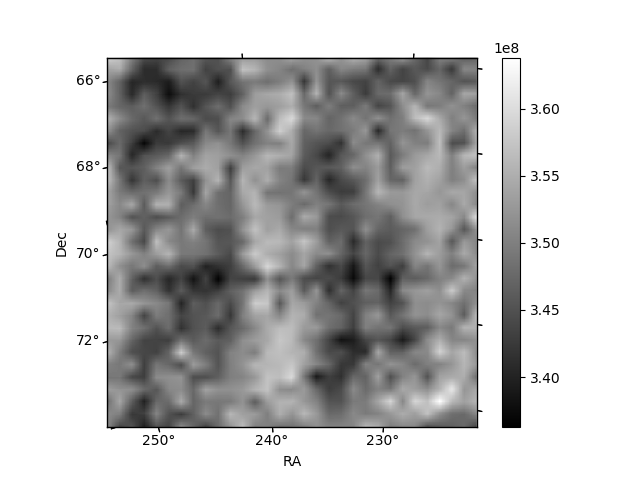
Histogram calculated using DETX and DETY for each event in the final _common_clean file
| Quadrant A | 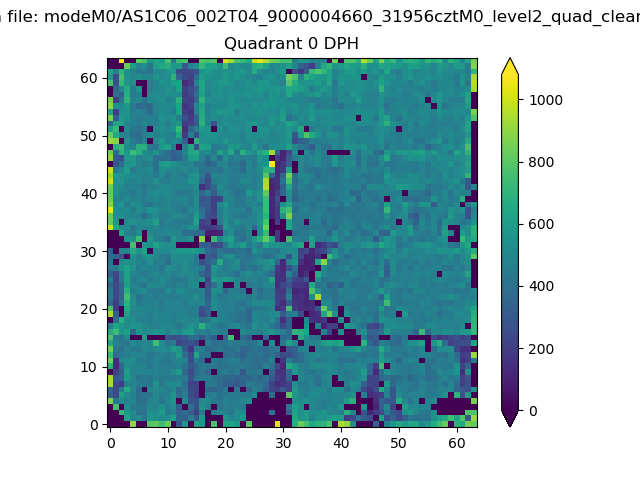 |
 |
Quadrant B |
|---|---|---|---|
| Quadrant D | 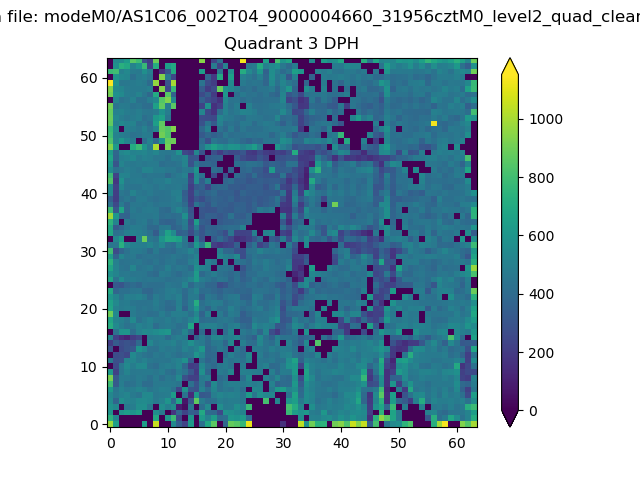 |
 |
Quadrant C |
| Plot type | Count rate plots | Images |
|---|---|---|
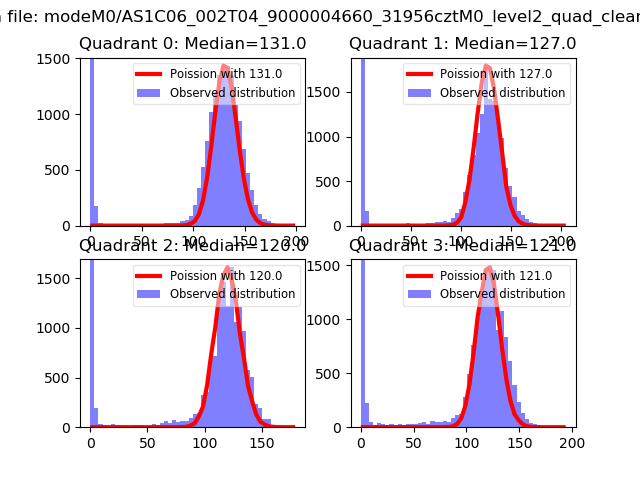
| Comparison with Poisson distribution Blue bars denote a histogram of data divided into 1 sec bins. Red curve is a Poisson curve with rate = median count rate of data. |
 |
 |
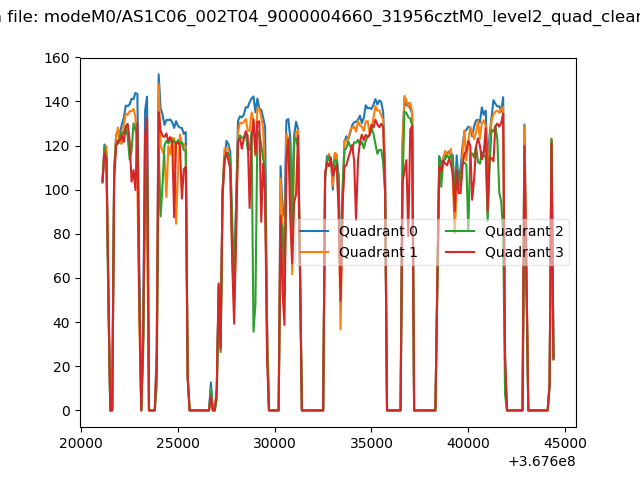
| Quadrant-wise count rates Data is divided into 100 sec bins |
 |
|
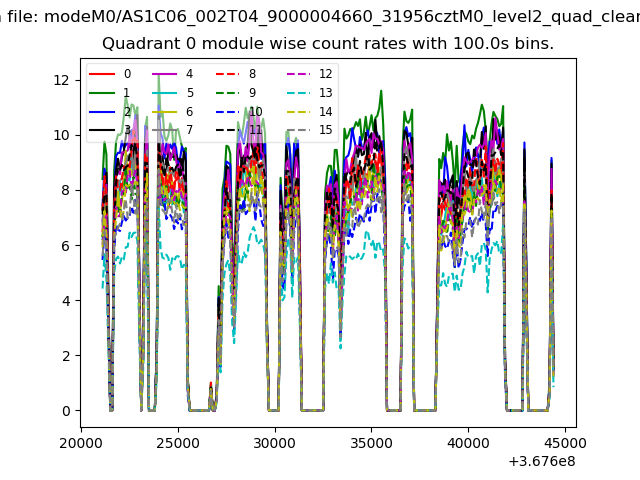
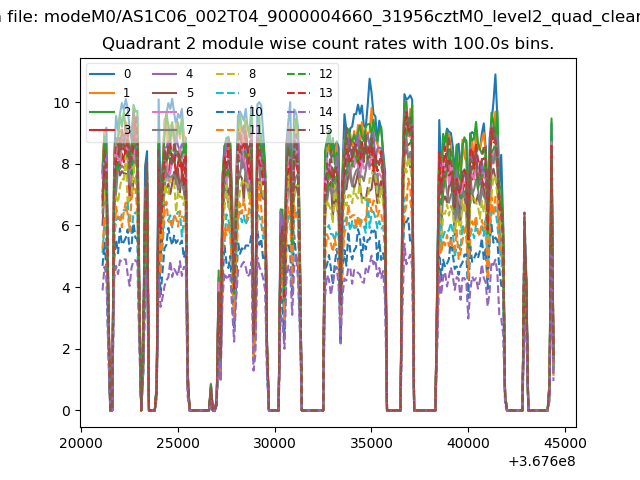
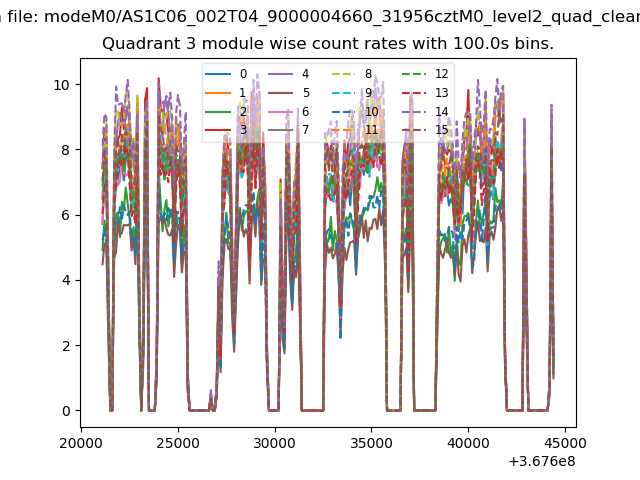
| Module-wise count rates for Quadrant A Data is divided into 100 sec bins |
 |
 |
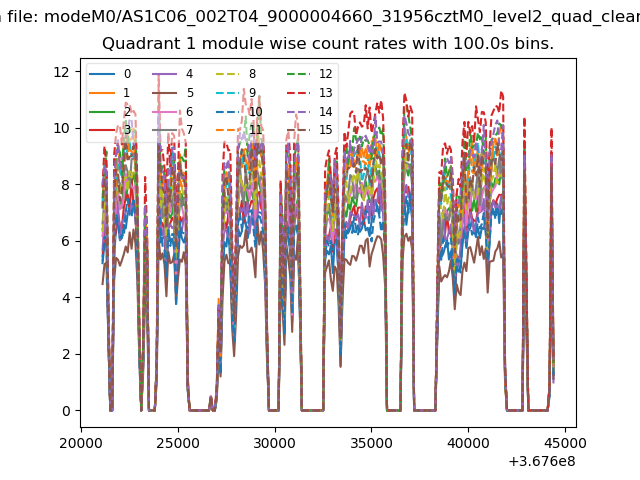
| Module-wise count rates for Quadrant B Data is divided into 100 sec bins |
 |
 |
| Module-wise count rates for Quadrant C Data is divided into 100 sec bins |
 |
 |
| Module-wise count rates for Quadrant D Data is divided into 100 sec bins |
 |
 |
| Parameter | Plot |
|---|---|
| CZT HV Monitor | 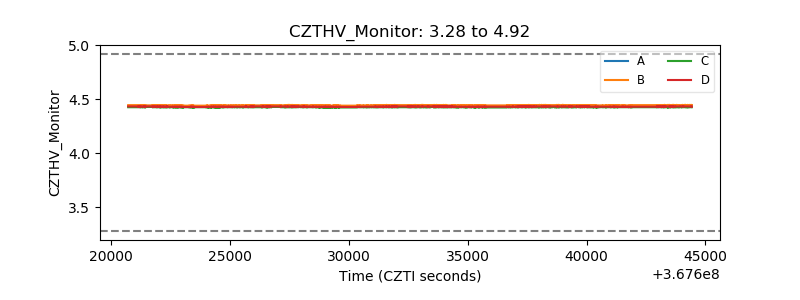 |
| D_VDD | 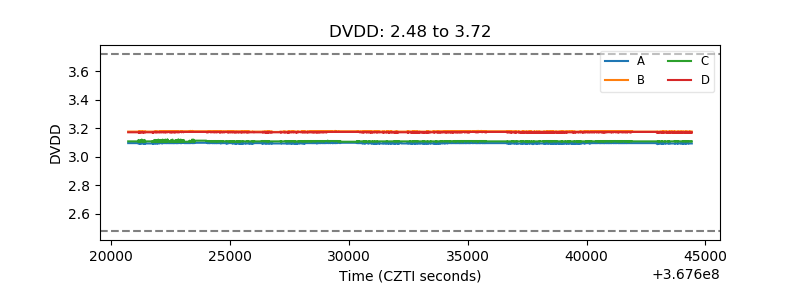 |
| Temperature 1 | 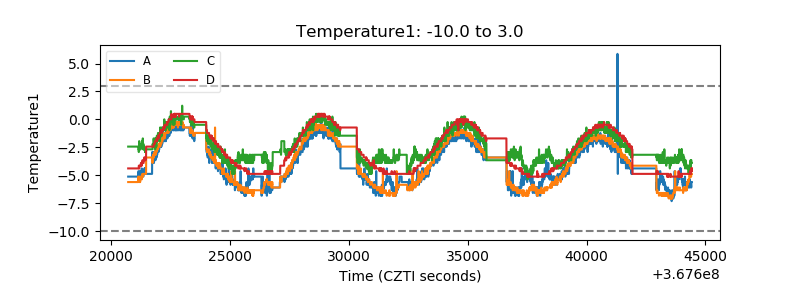 |
| Veto HV Monitor | 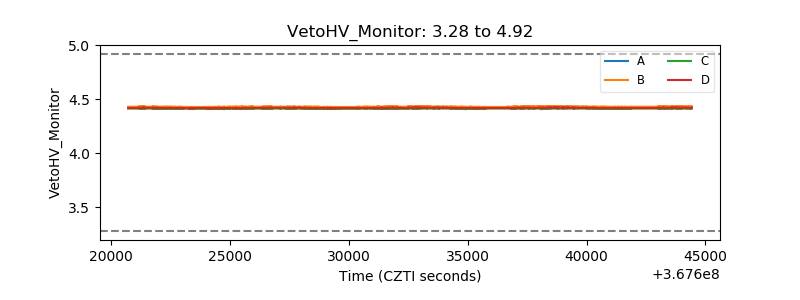 |
| Veto LLD | 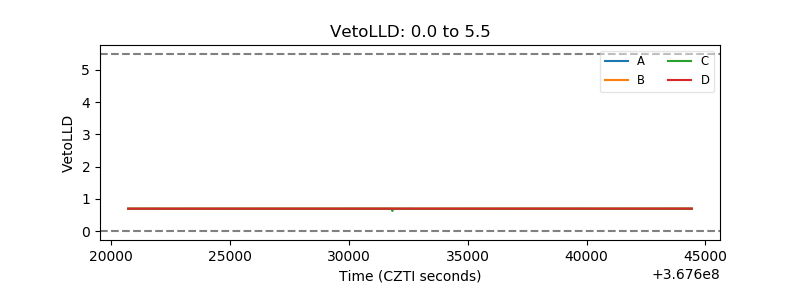 |
| Alpha Counter | 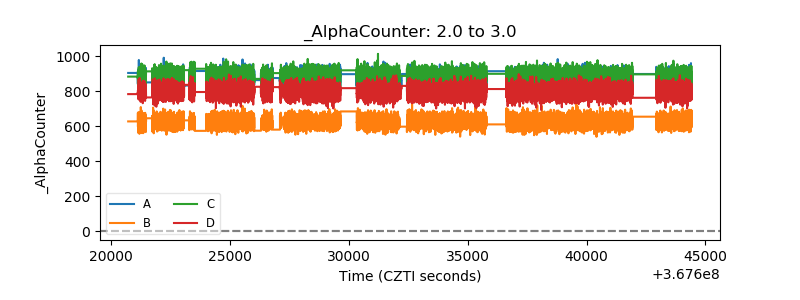 |
| _CPM_Rate | 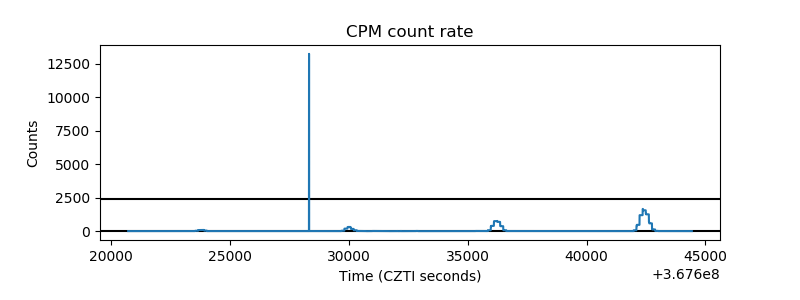 |
| CZT Counter | 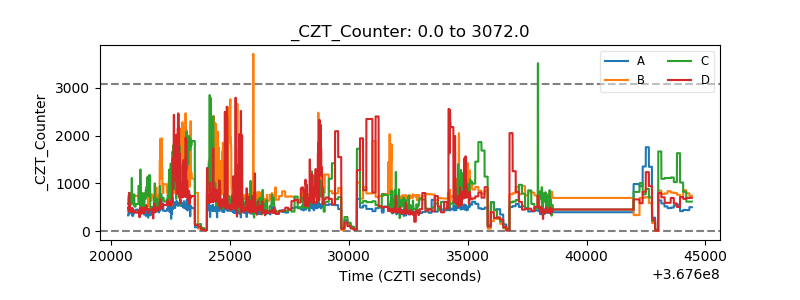 |
| +2.5 Volts monitor |  |
| +5 Volts monitor |  |
| _ROLL_ROT | 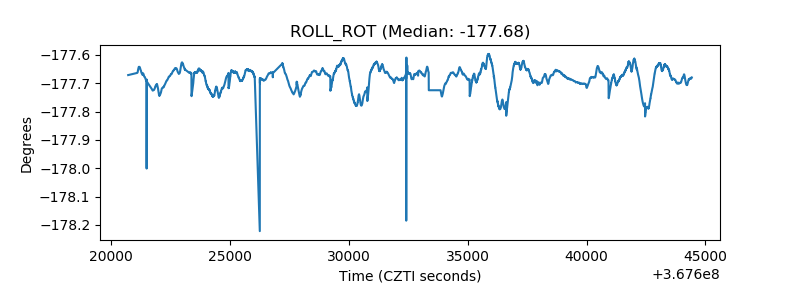 |
| _Roll_DEC | 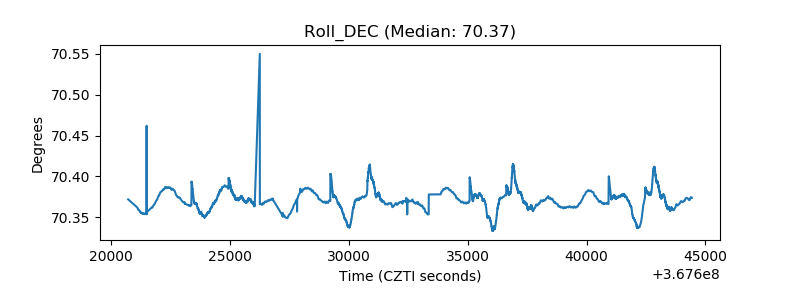 |
| _Roll_RA | 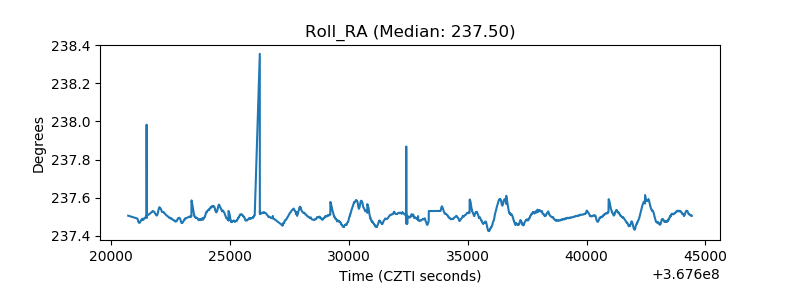 |
| Veto Counter |  |