| Param | Original file | Final file |
|---|---|---|
| Filename | modeM0/AS1C06_002T04_9000004660_31958cztM0_level2.evt | modeM0/AS1C06_002T04_9000004660_31958cztM0_level2_quad_clean.evt |
| Size (bytes) | 153,593,280 | 11,571,840 |
| Size | 146.5 MB | 11.0 MB |
| Events in quadrant A | 754,154 | 58,160 |
| Events in quadrant B | 1,250,794 | 59,163 |
| Events in quadrant C | 1,476,281 | 56,999 |
| Events in quadrant D | 1,058,570 | 56,573 |
| Mode SS | |||
|---|---|---|---|
| Quadrant | BADHDUFLAG | Total packets | Discarded packets |
| A | 0 | 32 | 0 |
| B | 0 | 32 | 0 |
| C | 0 | 32 | 0 |
| D | 0 | 32 | 0 |
| Mode M0 | |||
|---|---|---|---|
| Quadrant | BADHDUFLAG | Total packets | Discarded packets |
| A | 0 | 3250 | 0 |
| B | 0 | 4839 | 0 |
| C | 0 | 5554 | 0 |
| D | 0 | 4333 | 0 |
| Quadrant | Total seconds | Saturated seconds | Saturation percentage |
|---|---|---|---|
| A | 1610 | 2 | 0.124224% |
| B | 1611 | 5 | 0.310366% |
| C | 1611 | 176 | 10.924891% |
| D | 1611 | 21 | 1.303538% |
Noise dominated data is calculated using 1-second bins in cleaned event files. If a bin has >2000 counts, and if more than 50% of those come from <1% of pixels, then it is considered to be noise-dominated and hence unusable.
| Quadrant | # 1 sec bins | Bins with >0 counts | Bins with >2000 counts | High rate bins dominated by noise | Noise dominated (total time) | Noise dominated (detector-on time) | Marked lightcurve |
|---|---|---|---|---|---|---|---|
| A | 1610 | 1610 | 0 | 0 | 0.00% | 0.00% | 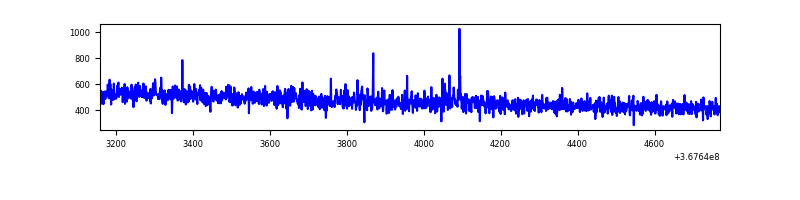 |
| B | 1611 | 1611 | 1 | 1 | 0.06% | 0.06% | 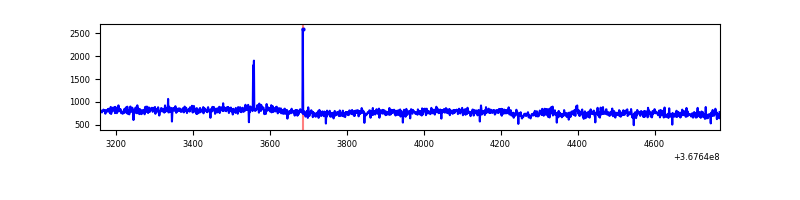 |
| C | 1611 | 1611 | 66 | 66 | 4.10% | 4.10% |  |
| D | 1611 | 1611 | 19 | 19 | 1.18% | 1.18% | 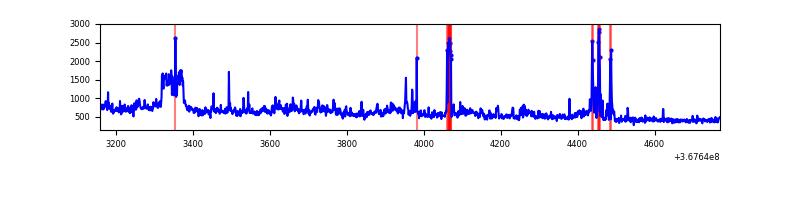 |
Top three noisy pixels from each quadrant. If the there are fewer than three noisy pixels in the level2.evt file, extra rows are filled as -1
| Pixel properties | Quadrant properties | ||||||
|---|---|---|---|---|---|---|---|
| Quadrant | DetID | PixID | Counts | Sigma | Mean | Median | Sigma |
| A | 14 | 238 | 3288 | 76.07 | 194 | 191 | 40.7 |
| A | 13 | 254 | 2818 | 64.52 | 194 | 191 | 40.7 |
| A | 3 | 137 | 1956 | 43.35 | 194 | 191 | 40.7 |
| B | 6 | 159 | 466949 | 12021.81 | 194 | 189 | 38.8 |
| B | 15 | 33 | 15168 | 385.8 | 194 | 189 | 38.8 |
| B | 10 | 247 | 5744 | 143.07 | 194 | 189 | 38.8 |
| C | 3 | 233 | 653077 | 14955.28 | 179 | 180 | 43.7 |
| C | 0 | 10 | 66535 | 1519.93 | 179 | 180 | 43.7 |
| C | 14 | 238 | 39976 | 911.57 | 179 | 180 | 43.7 |
| D | 8 | 195 | 285752 | 6159.28 | 184 | 178 | 46.4 |
| D | 12 | 218 | 53636 | 1152.98 | 184 | 178 | 46.4 |
| D | 12 | 250 | 7763 | 163.58 | 184 | 178 | 46.4 |
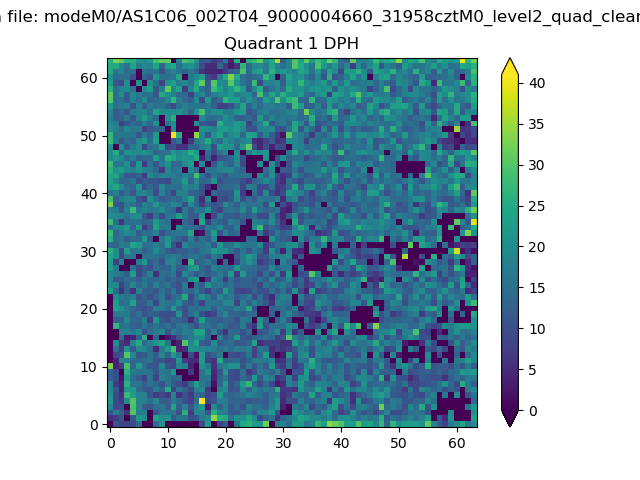
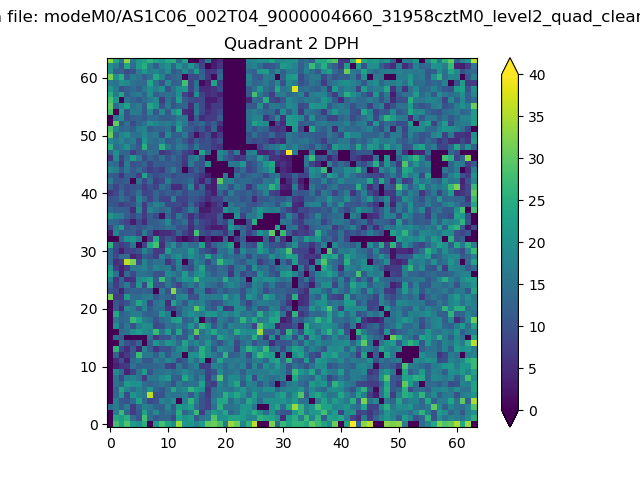
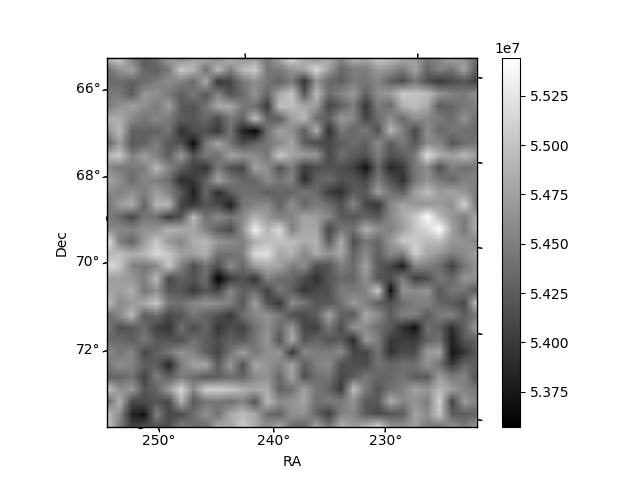
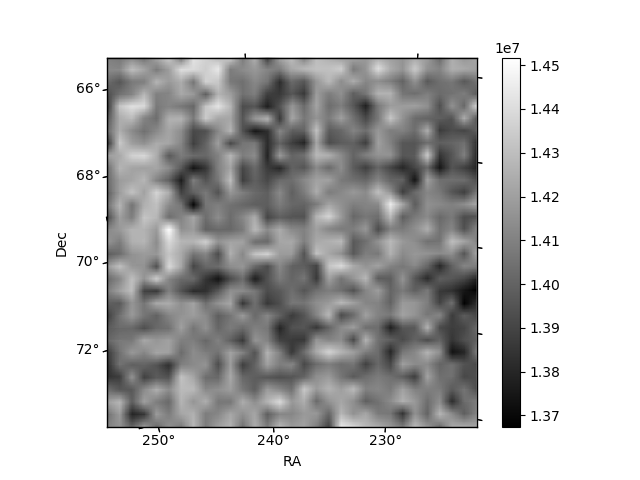
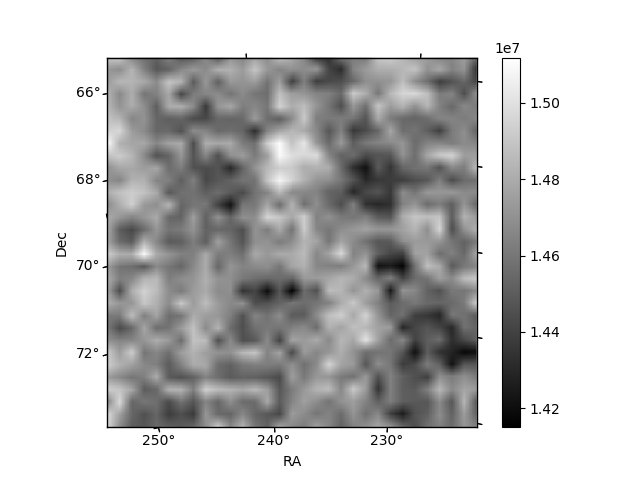
Histogram calculated using DETX and DETY for each event in the final _common_clean file
| Quadrant A | 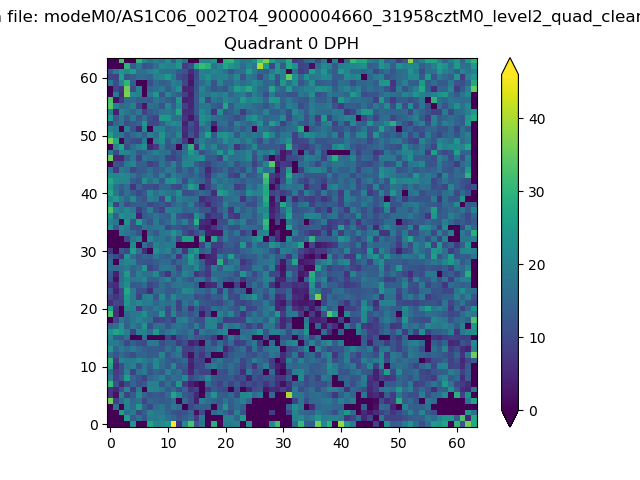 |
 |
Quadrant B |
|---|---|---|---|
| Quadrant D | 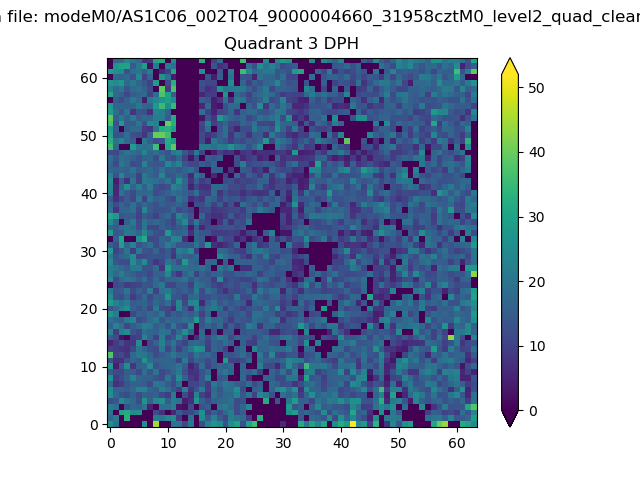 |
 |
Quadrant C |
| Plot type | Count rate plots | Images |
|---|---|---|
| Comparison with Poisson distribution Blue bars denote a histogram of data divided into 1 sec bins. Red curve is a Poisson curve with rate = median count rate of data. |
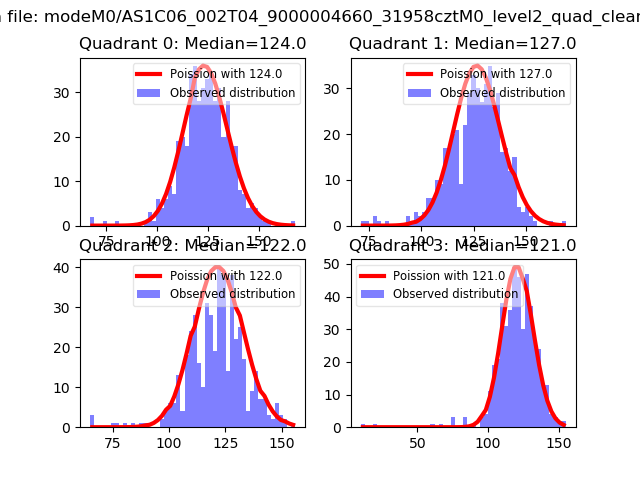 |
 |
| Quadrant-wise count rates Data is divided into 100 sec bins |
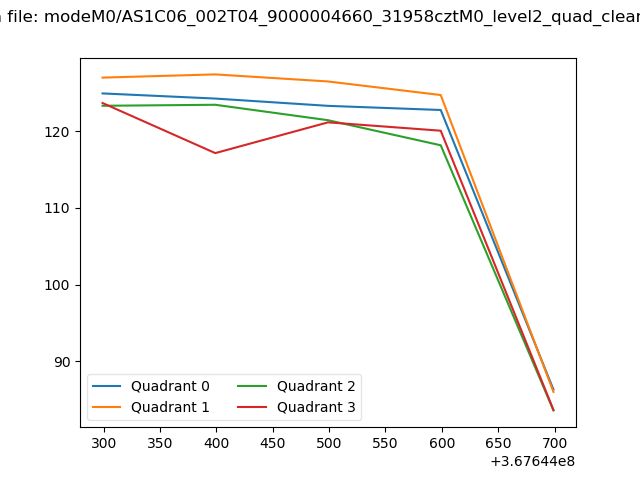 |
|
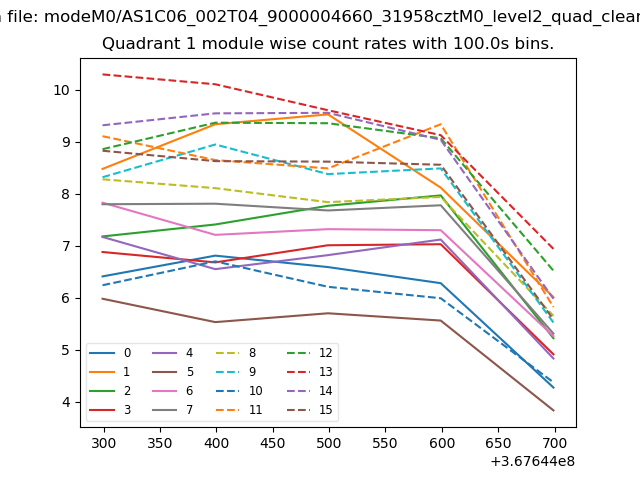
| Module-wise count rates for Quadrant A Data is divided into 100 sec bins |
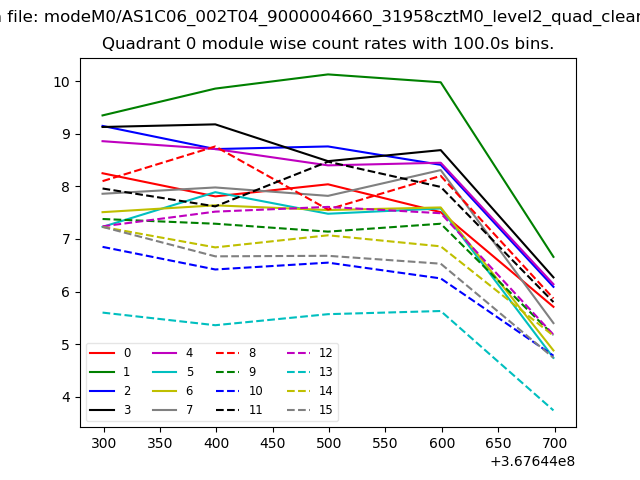 |
 |
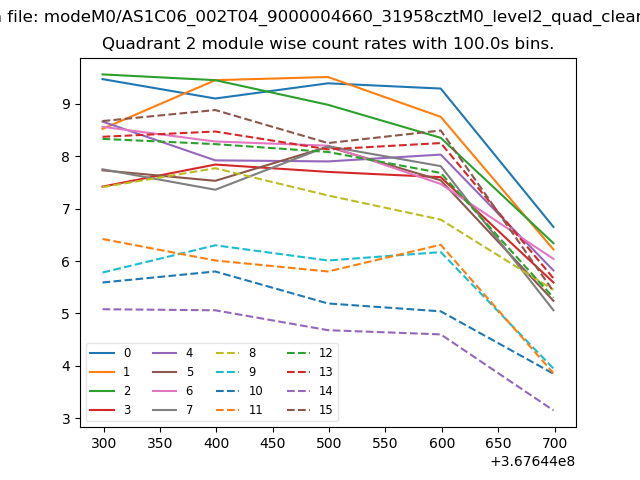
| Module-wise count rates for Quadrant B Data is divided into 100 sec bins |
 |
 |
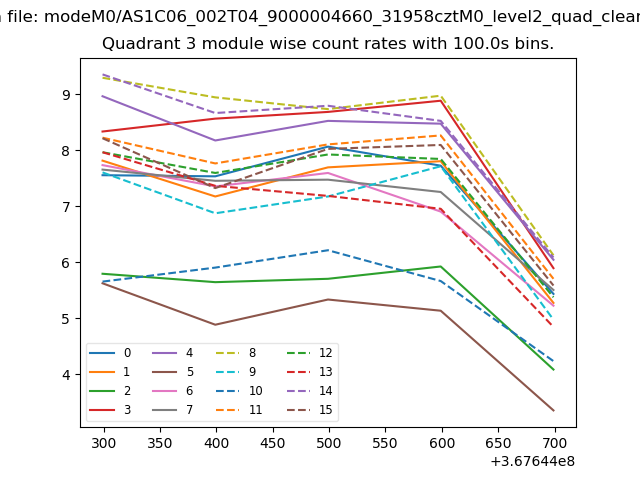
| Module-wise count rates for Quadrant C Data is divided into 100 sec bins |
 |
 |
| Module-wise count rates for Quadrant D Data is divided into 100 sec bins |
 |
 |
| Parameter | Plot |
|---|---|
| CZT HV Monitor | 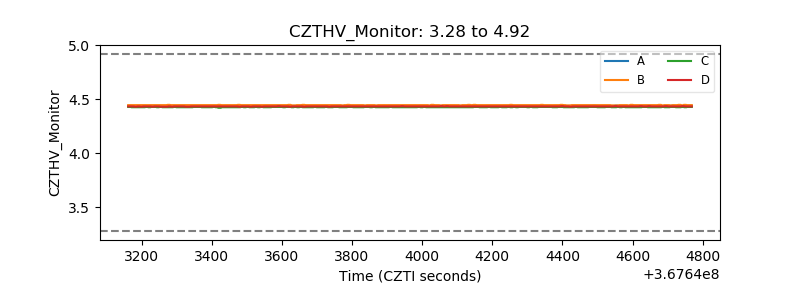 |
| D_VDD | 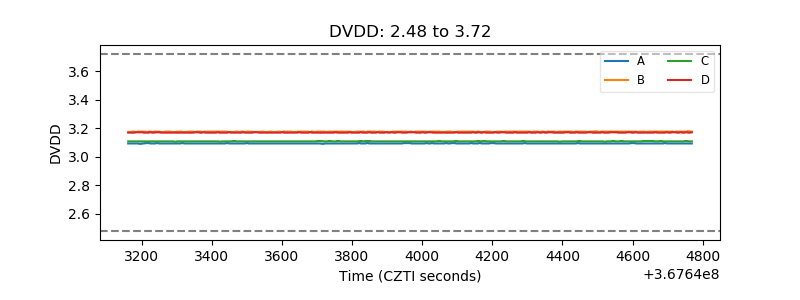 |
| Temperature 1 | 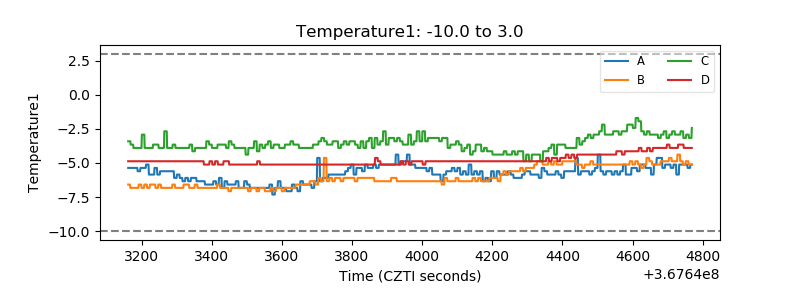 |
| Veto HV Monitor |  |
| Veto LLD | 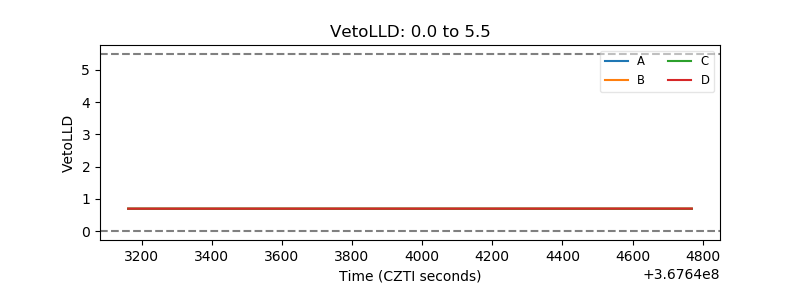 |
| Alpha Counter | 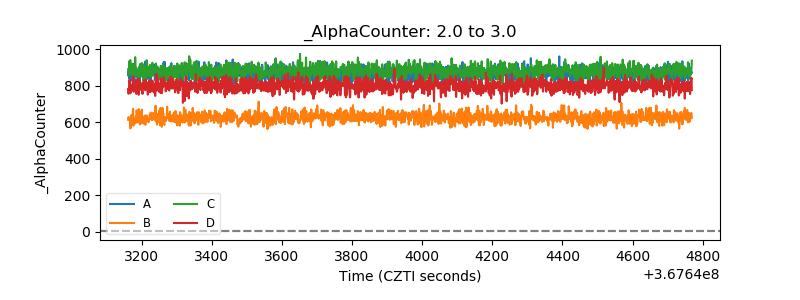 |
| _CPM_Rate | 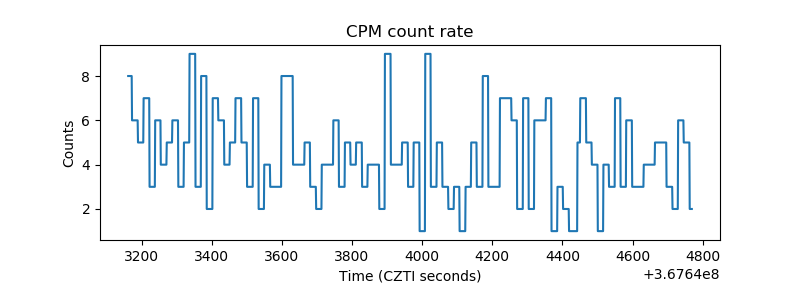 |
| CZT Counter | 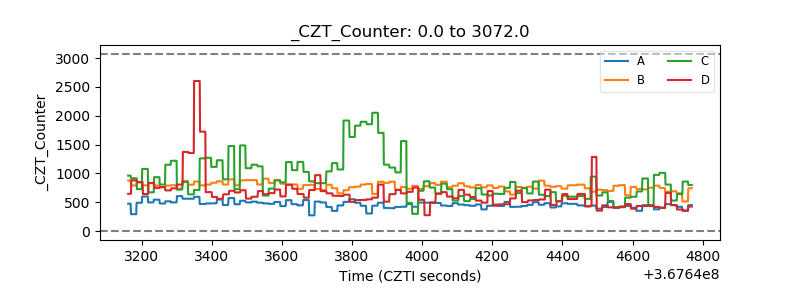 |
| +2.5 Volts monitor |  |
| +5 Volts monitor |  |
| _ROLL_ROT | 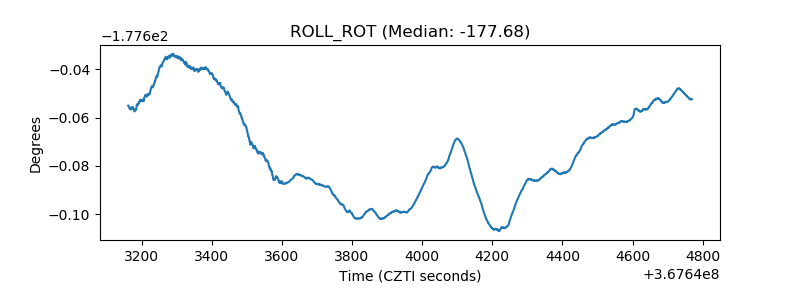 |
| _Roll_DEC | 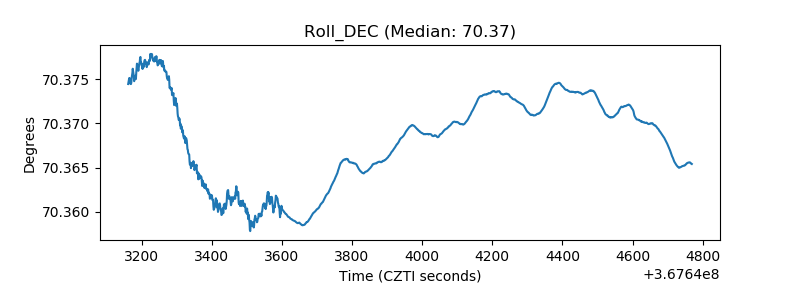 |
| _Roll_RA | 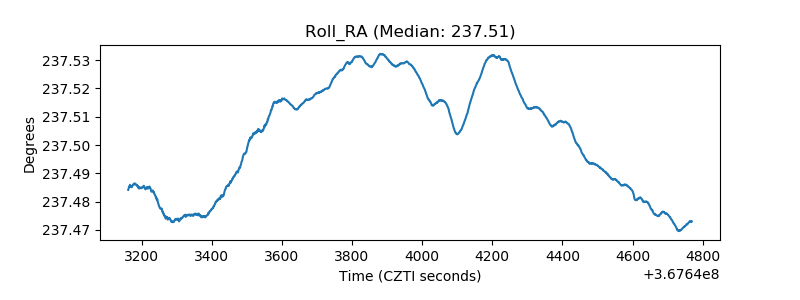 |
| Veto Counter | 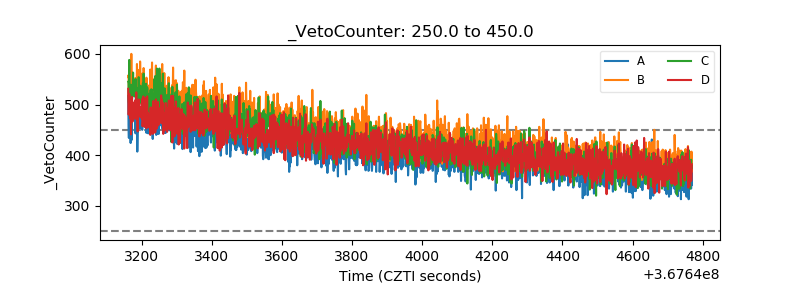 |