| Param | Original file | Final file |
|---|---|---|
| Filename | modeM0/AS1C06_010T03_9000004658cztM0_level2.fits | modeM0/AS1C06_010T03_9000004658cztM0_level2_quad_clean.evt |
| Size (bytes) | 106,488,000 | 142,352,640 |
| Size | 101.6 MB | 135.8 MB |
| Events in quadrant A | 681,874 | 1,012,449 |
| Events in quadrant B | 609,736 | 919,094 |
| Events in quadrant C | 623,816 | 887,939 |
| Events in quadrant D | 512,710 | 696,348 |
| Mode SS | |||
|---|---|---|---|
| Quadrant | BADHDUFLAG | Total packets | Discarded packets |
| A | 0 | 234 | 0 |
| B | 0 | 234 | 0 |
| C | 0 | 234 | 0 |
| D | 0 | 234 | 0 |
| Mode M9 | |||
|---|---|---|---|
| Quadrant | BADHDUFLAG | Total packets | Discarded packets |
| A | 0 | 12 | 0 |
| B | 0 | 12 | 0 |
| C | 0 | 12 | 0 |
| D | 0 | 12 | 0 |
| Mode M0 | |||
|---|---|---|---|
| Quadrant | BADHDUFLAG | Total packets | Discarded packets |
| A | 0 | 26021 | 0 |
| B | 0 | 43430 | 0 |
| C | 0 | 39127 | 0 |
| D | 0 | 49261 | 0 |
| Quadrant | Total seconds | Saturated seconds | Saturation percentage |
|---|---|---|---|
| A | 11493 | 129 | 1.122422% |
| B | 11487 | 1293 | 11.256203% |
| C | 11481 | 1286 | 11.201115% |
| D | 11479 | 2898 | 25.246102% |
Noise dominated data is calculated using 1-second bins in cleaned event files. If a bin has >2000 counts, and if more than 50% of those come from <1% of pixels, then it is considered to be noise-dominated and hence unusable.
| Quadrant | # 1 sec bins | Bins with >0 counts | Bins with >2000 counts | High rate bins dominated by noise | Noise dominated (total time) | Noise dominated (detector-on time) | Marked lightcurve |
|---|---|---|---|---|---|---|---|
| A | 12915 | 11492 | 0 | 0 | 0.00% | 0.00% |  |
| B | 12915 | 11483 | 0 | 0 | 0.00% | 0.00% |  |
| C | 12915 | 11478 | 0 | 0 | 0.00% | 0.00% |  |
| D | 12915 | 11423 | 0 | 0 | 0.00% | 0.00% |  |
Top three noisy pixels from each quadrant. If the there are fewer than three noisy pixels in the level2.evt file, extra rows are filled as -1
| Pixel properties | Quadrant properties | ||||||
|---|---|---|---|---|---|---|---|
| Quadrant | DetID | PixID | Counts | Sigma | Mean | Median | Sigma |
| A | 0 | 29 | 690 | 11.58 | 177 | 168 | 45.1 |
| A | 9 | 19 | 528 | 7.99 | 177 | 168 | 45.1 |
| A | 0 | 30 | 513 | 7.66 | 177 | 168 | 45.1 |
| B | 2 | 9 | 467 | 9.26 | 162 | 155 | 33.7 |
| B | 3 | 17 | 437 | 8.37 | 162 | 155 | 33.7 |
| B | 14 | 254 | 436 | 8.34 | 162 | 155 | 33.7 |
| C | 12 | 241 | 453 | 6.81 | 165 | 155 | 43.7 |
| C | 7 | 111 | 416 | 5.97 | 165 | 155 | 43.7 |
| C | 3 | 187 | 406 | 5.74 | 165 | 155 | 43.7 |
| D | 6 | 231 | 390 | 6.19 | 146 | 133 | 41.5 |
| D | 10 | 189 | 383 | 6.02 | 146 | 133 | 41.5 |
| D | 15 | 47 | 373 | 5.78 | 146 | 133 | 41.5 |
Histogram calculated using DETX and DETY for each event in the final _common_clean file
| Quadrant A | 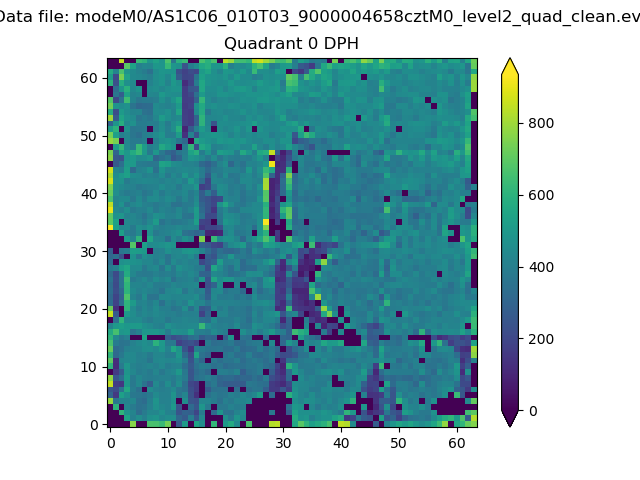 |
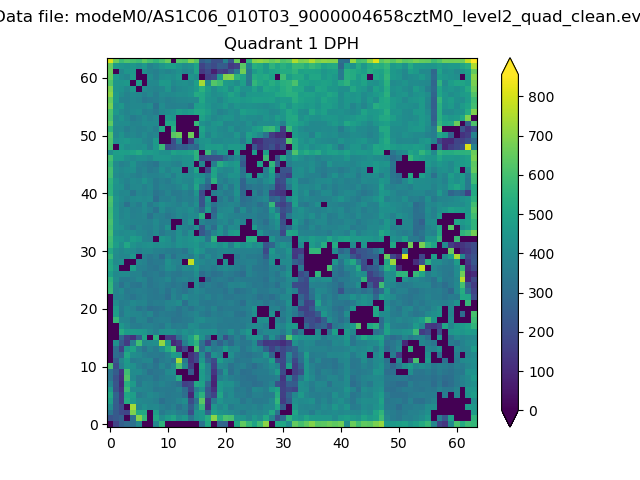 |
Quadrant B |
|---|---|---|---|
| Quadrant D |  |
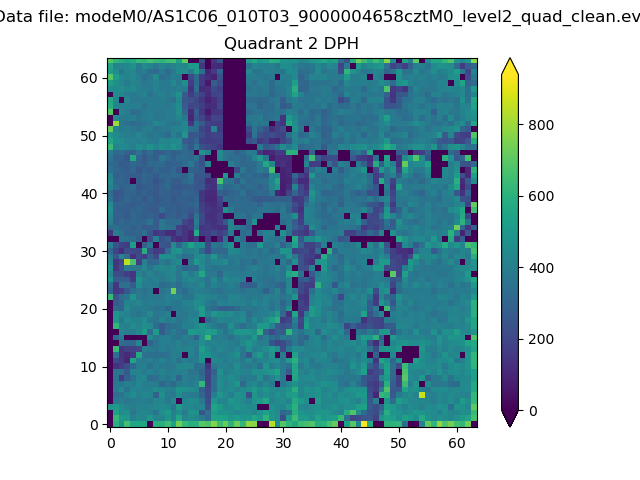 |
Quadrant C |
| Plot type | Count rate plots | Images |
|---|---|---|
| Comparison with Poisson distribution Blue bars denote a histogram of data divided into 1 sec bins. Red curve is a Poisson curve with rate = median count rate of data. |
 |
 |
| Quadrant-wise count rates Data is divided into 100 sec bins |
 |
|
| Module-wise count rates for Quadrant A Data is divided into 100 sec bins |
 |
 |
| Module-wise count rates for Quadrant B Data is divided into 100 sec bins |
 |
 |
| Module-wise count rates for Quadrant C Data is divided into 100 sec bins |
 |
 |
| Module-wise count rates for Quadrant D Data is divided into 100 sec bins |
 |
 |
| Parameter | Plot |
|---|---|
| CZT HV Monitor |  |
| D_VDD |  |
| Temperature 1 |  |
| Veto HV Monitor |  |
| Veto LLD |  |
| Alpha Counter |  |
| _CPM_Rate |  |
| CZT Counter |  |
| +2.5 Volts monitor |  |
| +5 Volts monitor |  |
| _ROLL_ROT |  |
| _Roll_DEC |  |
| _Roll_RA |  |
| Veto Counter |  |