| Param | Original file | Final file |
|---|---|---|
| Filename | modeM0/AS1C06_010T03_9000004658_31935cztM0_level2.evt | modeM0/AS1C06_010T03_9000004658_31935cztM0_level2_quad_clean.evt |
| Size (bytes) | 616,115,520 | 94,829,760 |
| Size | 587.6 MB | 90.4 MB |
| Events in quadrant A | 2,450,524 | 682,237 |
| Events in quadrant B | 4,856,943 | 659,325 |
| Events in quadrant C | 4,610,186 | 617,734 |
| Events in quadrant D | 6,404,596 | 561,813 |
| Mode SS | |||
|---|---|---|---|
| Quadrant | BADHDUFLAG | Total packets | Discarded packets |
| A | 0 | 102 | 0 |
| B | 0 | 102 | 0 |
| C | 0 | 102 | 0 |
| D | 0 | 102 | 0 |
| Mode M9 | |||
|---|---|---|---|
| Quadrant | BADHDUFLAG | Total packets | Discarded packets |
| A | 0 | 8 | 0 |
| B | 0 | 8 | 0 |
| C | 0 | 8 | 0 |
| D | 0 | 8 | 0 |
| Mode M0 | |||
|---|---|---|---|
| Quadrant | BADHDUFLAG | Total packets | Discarded packets |
| A | 0 | 10595 | 1 |
| B | 0 | 17980 | 1 |
| C | 0 | 17275 | 1 |
| D | 0 | 22341 | 9 |
| Quadrant | Total seconds | Saturated seconds | Saturation percentage |
|---|---|---|---|
| A | 4986 | 53 | 1.062976% |
| B | 4986 | 422 | 8.463698% |
| C | 4986 | 590 | 11.833133% |
| D | 4985 | 1454 | 29.167503% |
Noise dominated data is calculated using 1-second bins in cleaned event files. If a bin has >2000 counts, and if more than 50% of those come from <1% of pixels, then it is considered to be noise-dominated and hence unusable.
| Quadrant | # 1 sec bins | Bins with >0 counts | Bins with >2000 counts | High rate bins dominated by noise | Noise dominated (total time) | Noise dominated (detector-on time) | Marked lightcurve |
|---|---|---|---|---|---|---|---|
| A | 5741 | 4986 | 5 | 5 | 0.09% | 0.10% | 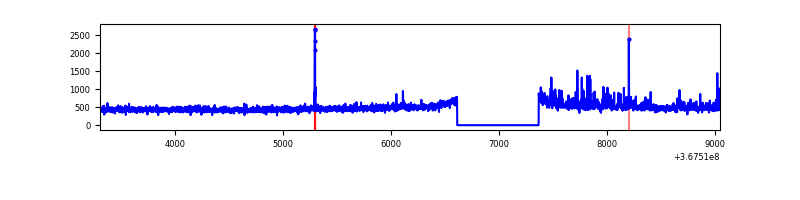 |
| B | 5741 | 4986 | 173 | 173 | 3.01% | 3.47% | 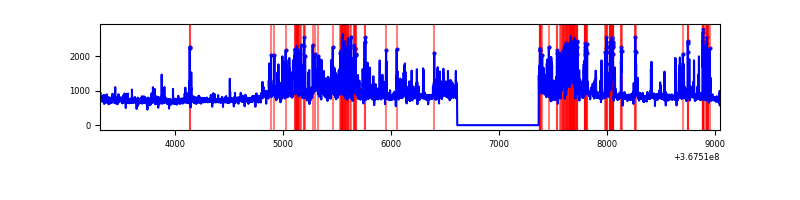 |
| C | 5741 | 4987 | 182 | 182 | 3.17% | 3.65% | 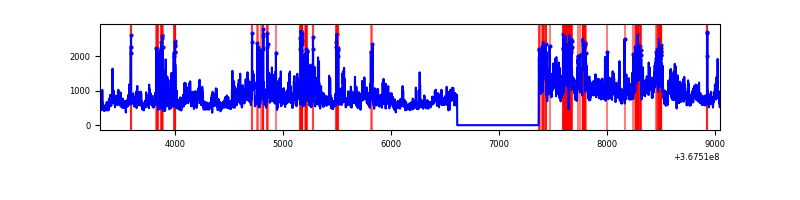 |
| D | 5740 | 4984 | 1257 | 1257 | 21.90% | 25.22% | 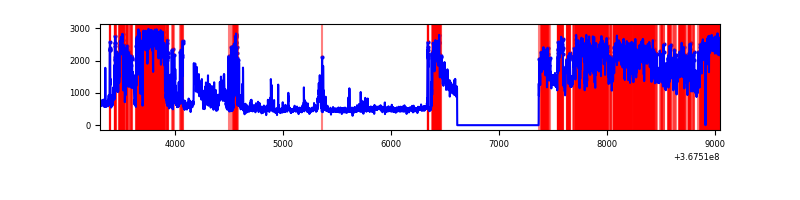 |
Top three noisy pixels from each quadrant. If the there are fewer than three noisy pixels in the level2.evt file, extra rows are filled as -1
| Pixel properties | Quadrant properties | ||||||
|---|---|---|---|---|---|---|---|
| Quadrant | DetID | PixID | Counts | Sigma | Mean | Median | Sigma |
| A | 12 | 96 | 117893 | 977.69 | 602 | 590 | 120.0 |
| A | 13 | 254 | 9476 | 74.06 | 602 | 590 | 120.0 |
| A | 13 | 6 | 6685 | 50.8 | 602 | 590 | 120.0 |
| B | 6 | 159 | 1403740 | 12707.8 | 584 | 570 | 110.4 |
| B | 5 | 255 | 771122 | 6978.5 | 584 | 570 | 110.4 |
| B | 5 | 172 | 232584 | 2101.23 | 584 | 570 | 110.4 |
| C | 3 | 233 | 2016061 | 15572.85 | 557 | 560 | 129.4 |
| C | 0 | 10 | 264666 | 2040.63 | 557 | 560 | 129.4 |
| C | 14 | 238 | 104713 | 804.74 | 557 | 560 | 129.4 |
| D | 12 | 33 | 2289529 | 18242.34 | 523 | 508 | 125.5 |
| D | 13 | 249 | 1058172 | 8429.05 | 523 | 508 | 125.5 |
| D | 8 | 195 | 859760 | 6847.8 | 523 | 508 | 125.5 |
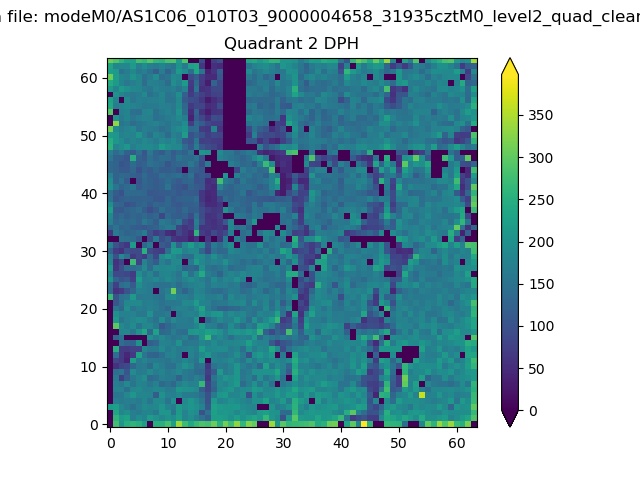
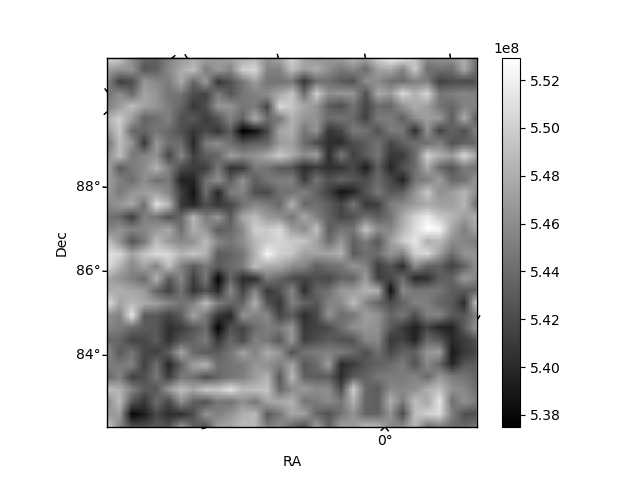
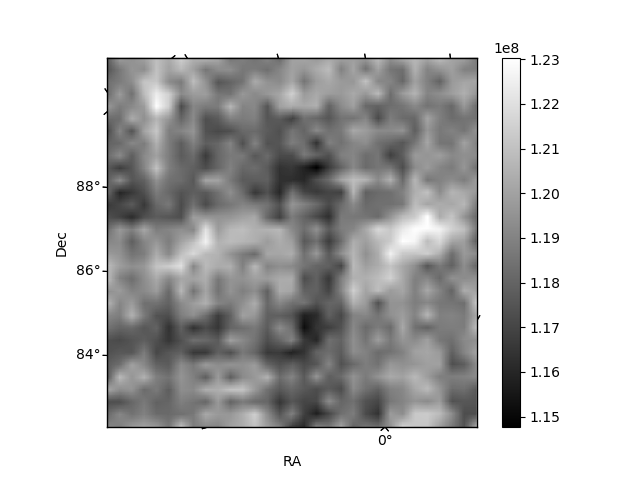
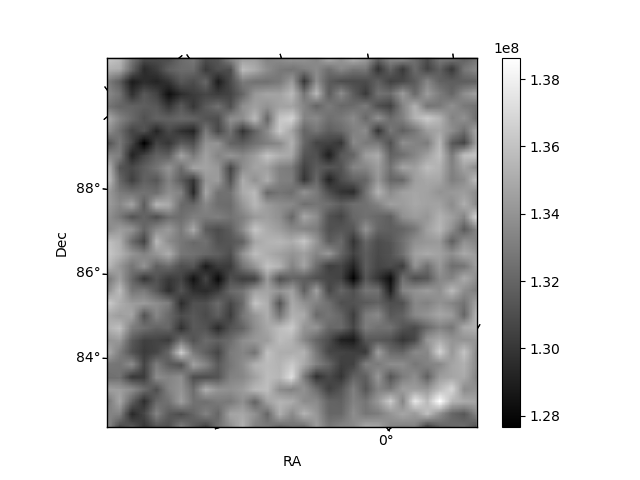
Histogram calculated using DETX and DETY for each event in the final _common_clean file
| Quadrant A | 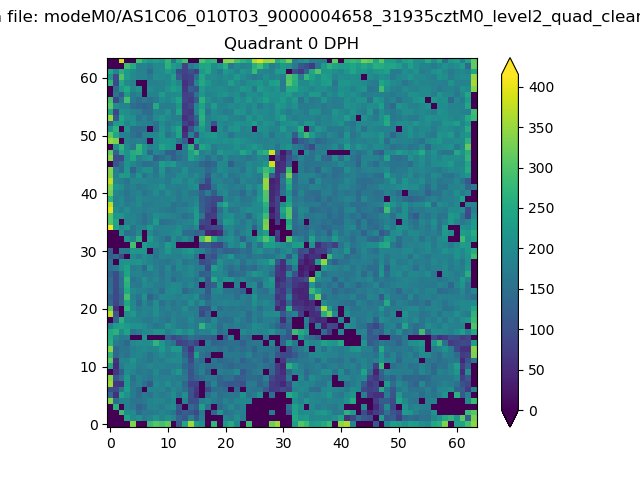 |
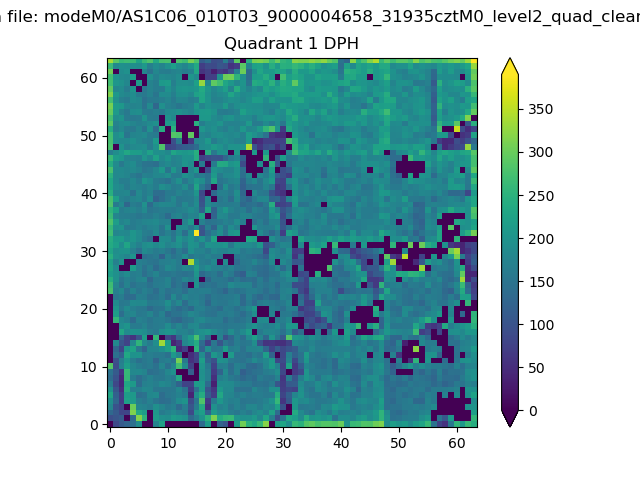 |
Quadrant B |
|---|---|---|---|
| Quadrant D | 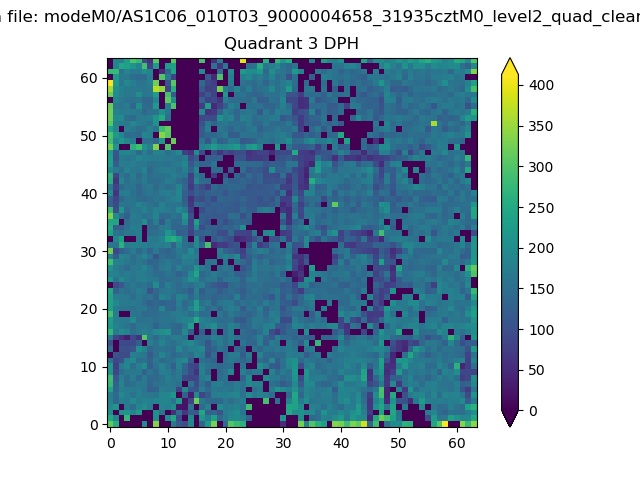 |
 |
Quadrant C |
| Plot type | Count rate plots | Images |
|---|---|---|
| Comparison with Poisson distribution Blue bars denote a histogram of data divided into 1 sec bins. Red curve is a Poisson curve with rate = median count rate of data. |
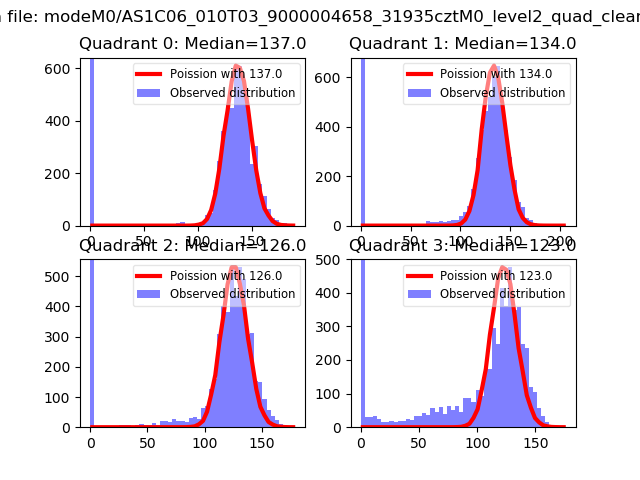 |
 |
| Quadrant-wise count rates Data is divided into 100 sec bins |
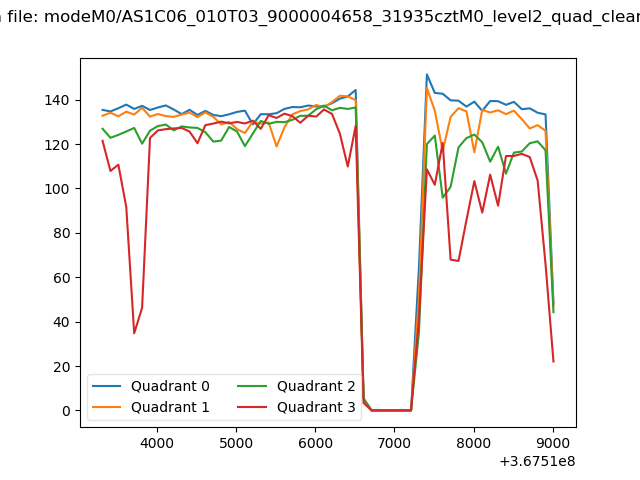 |
|
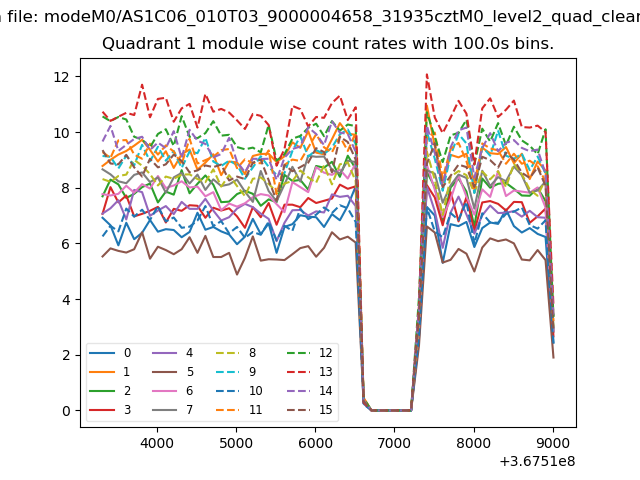
| Module-wise count rates for Quadrant A Data is divided into 100 sec bins |
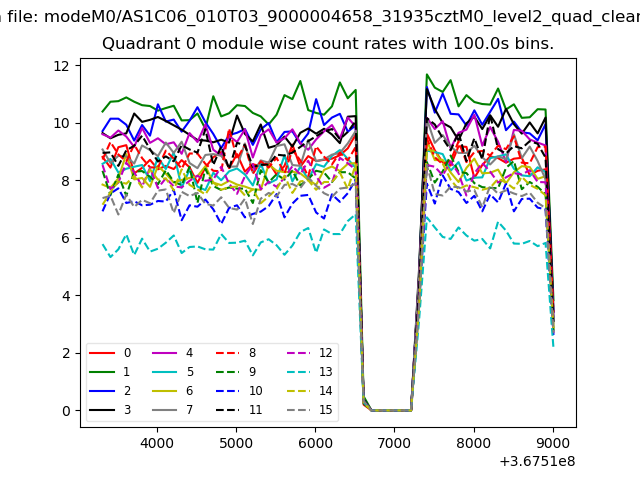 |
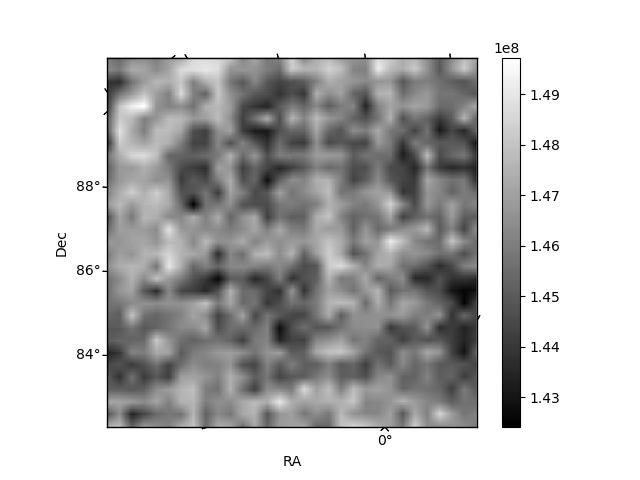 |
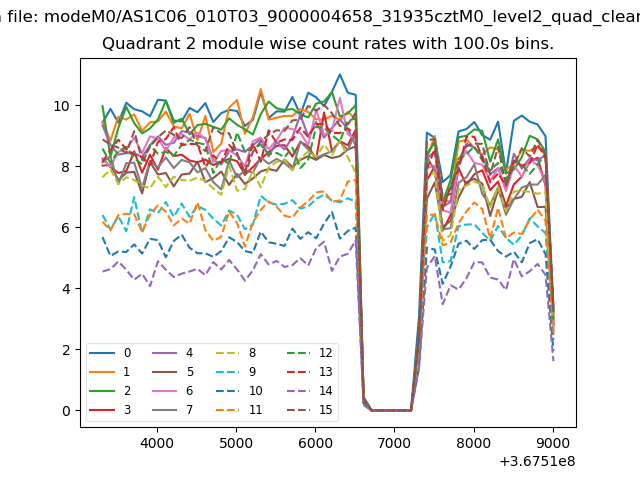
| Module-wise count rates for Quadrant B Data is divided into 100 sec bins |
 |
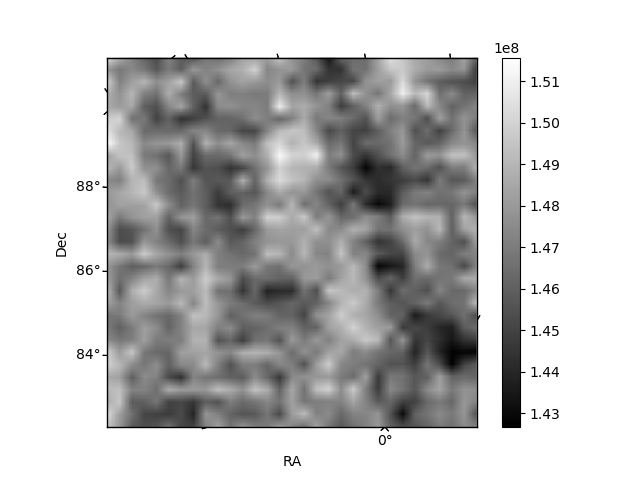 |
| Module-wise count rates for Quadrant C Data is divided into 100 sec bins |
 |
 |
| Module-wise count rates for Quadrant D Data is divided into 100 sec bins |
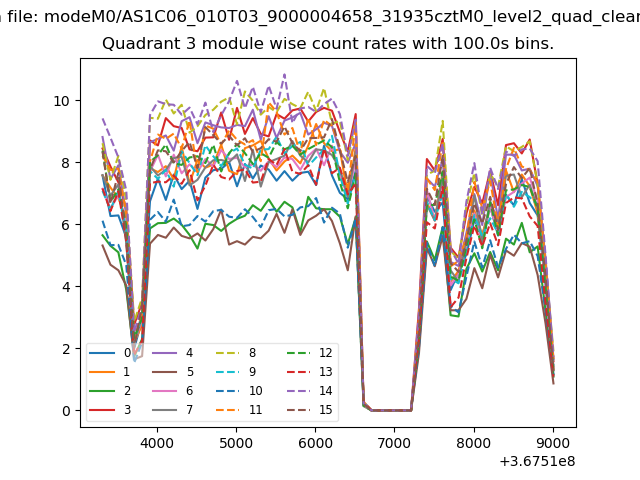 |
 |
| Parameter | Plot |
|---|---|
| CZT HV Monitor |  |
| D_VDD | 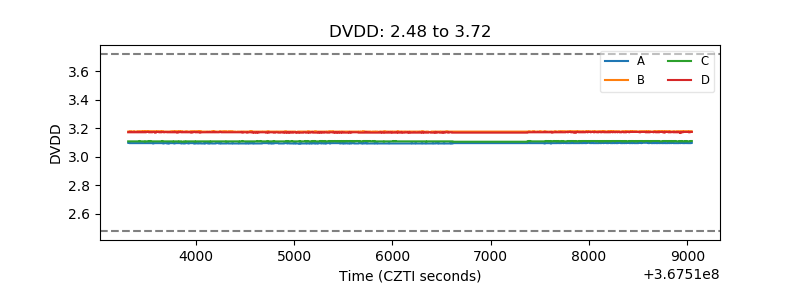 |
| Temperature 1 | 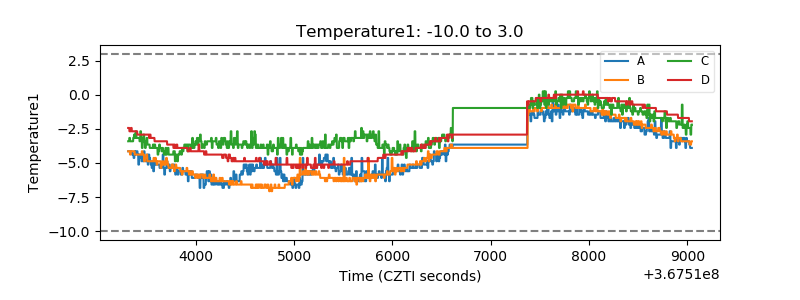 |
| Veto HV Monitor | 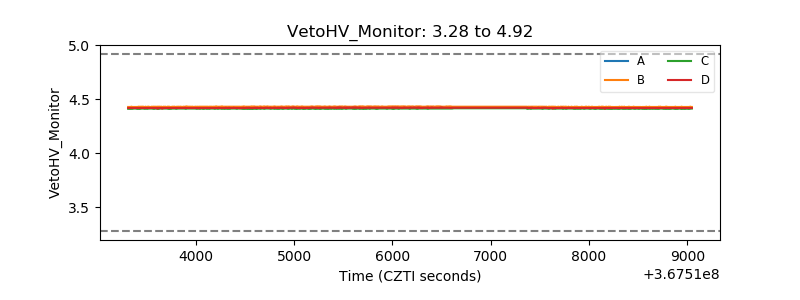 |
| Veto LLD | 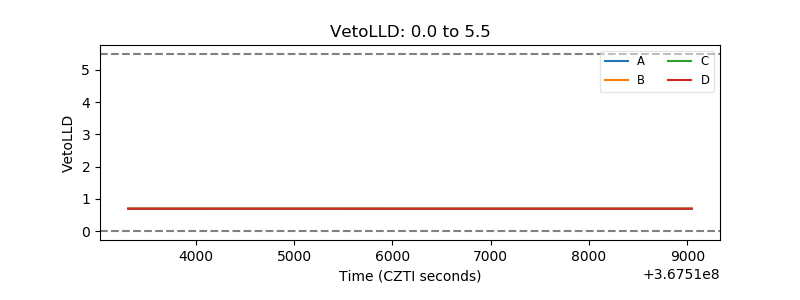 |
| Alpha Counter | 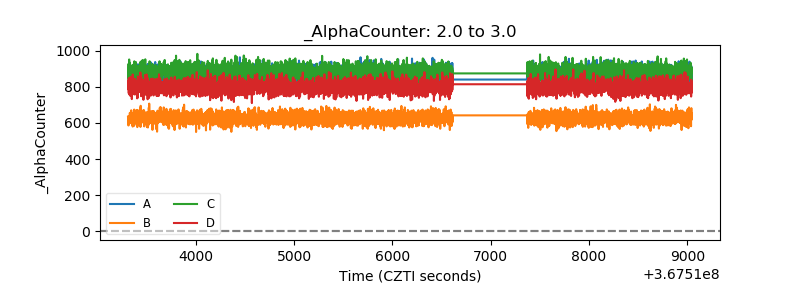 |
| _CPM_Rate | 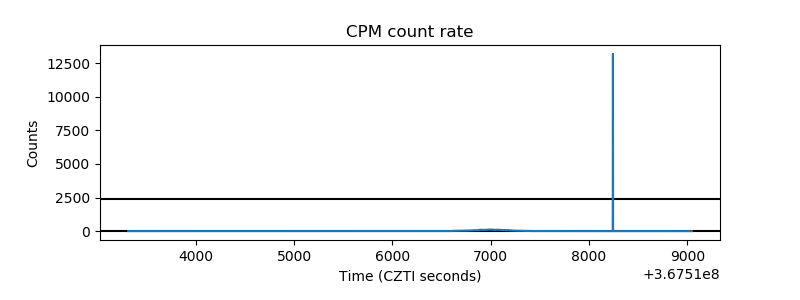 |
| CZT Counter | 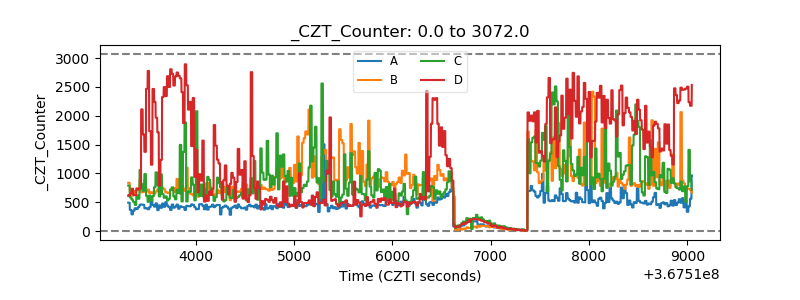 |
| +2.5 Volts monitor | 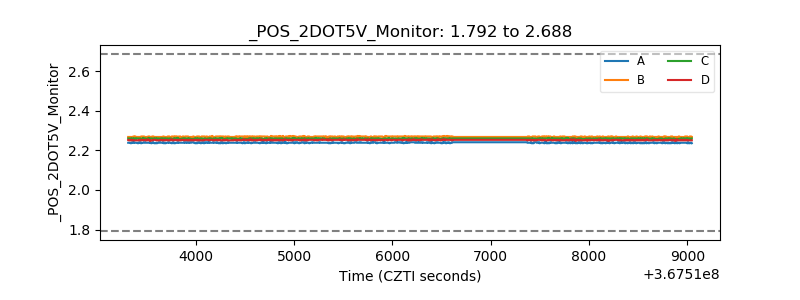 |
| +5 Volts monitor |  |
| _ROLL_ROT | 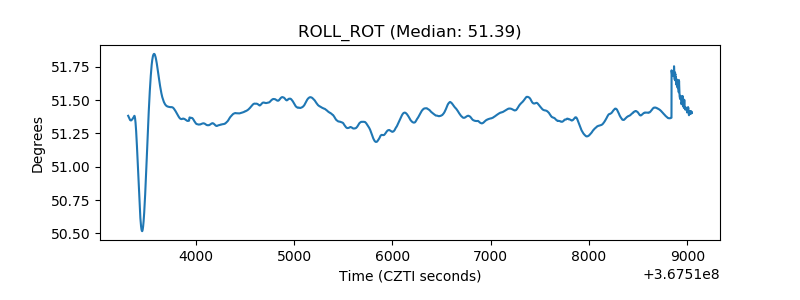 |
| _Roll_DEC | 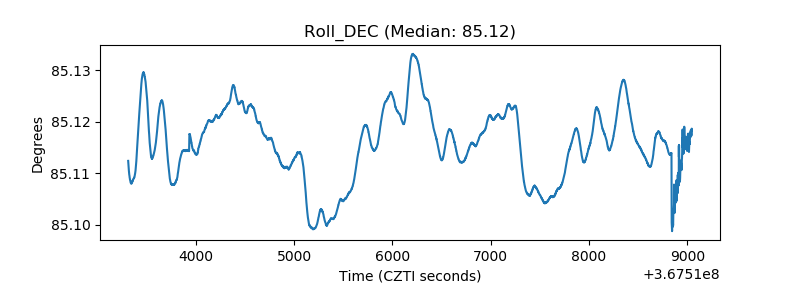 |
| _Roll_RA | 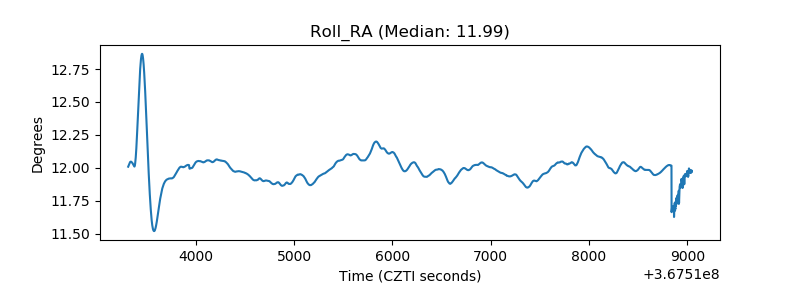 |
| Veto Counter | 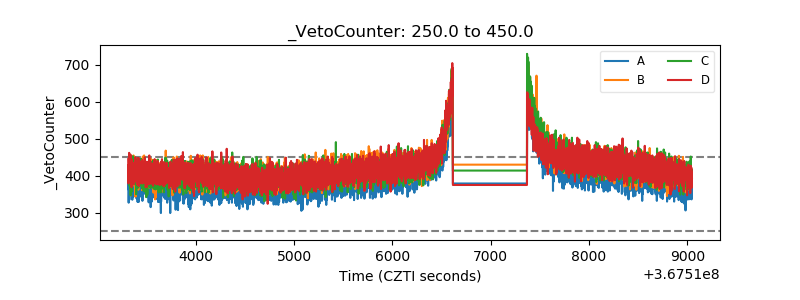 |