| Param | Original file | Final file |
|---|---|---|
| Filename | modeM0/AS1C06_010T03_9000004658_31936cztM0_level2.evt | modeM0/AS1C06_010T03_9000004658_31936cztM0_level2_quad_clean.evt |
| Size (bytes) | 760,406,400 | 106,191,360 |
| Size | 725.2 MB | 101.3 MB |
| Events in quadrant A | 3,286,244 | 764,299 |
| Events in quadrant B | 6,609,566 | 715,135 |
| Events in quadrant C | 5,540,345 | 697,524 |
| Events in quadrant D | 7,205,880 | 636,178 |
| Mode SS | |||
|---|---|---|---|
| Quadrant | BADHDUFLAG | Total packets | Discarded packets |
| A | 0 | 126 | 6 |
| B | 0 | 125 | 5 |
| C | 0 | 124 | 4 |
| D | 0 | 127 | 7 |
| Mode M9 | |||
|---|---|---|---|
| Quadrant | BADHDUFLAG | Total packets | Discarded packets |
| A | 0 | 4 | 0 |
| B | 0 | 4 | 0 |
| C | 0 | 4 | 0 |
| D | 0 | 6 | 2 |
| Mode M0 | |||
|---|---|---|---|
| Quadrant | BADHDUFLAG | Total packets | Discarded packets |
| A | 0 | 14362 | 908 |
| B | 0 | 24772 | 1263 |
| C | 0 | 22045 | 1463 |
| D | 0 | 28353 | 3083 |
| Quadrant | Total seconds | Saturated seconds | Saturation percentage |
|---|---|---|---|
| A | 5750 | 44 | 0.765217% |
| B | 5739 | 917 | 15.978393% |
| C | 5726 | 764 | 13.342648% |
| D | 5714 | 1597 | 27.948897% |
Noise dominated data is calculated using 1-second bins in cleaned event files. If a bin has >2000 counts, and if more than 50% of those come from <1% of pixels, then it is considered to be noise-dominated and hence unusable.
| Quadrant | # 1 sec bins | Bins with >0 counts | Bins with >2000 counts | High rate bins dominated by noise | Noise dominated (total time) | Noise dominated (detector-on time) | Marked lightcurve |
|---|---|---|---|---|---|---|---|
| A | 7353 | 5782 | 20 | 20 | 0.27% | 0.35% | 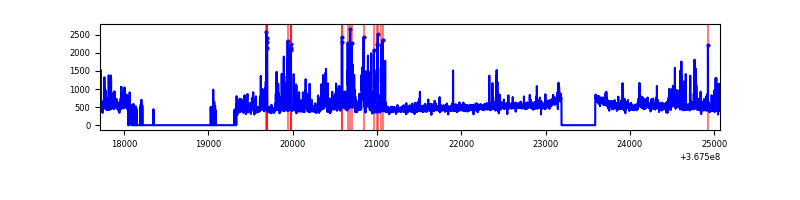 |
| B | 7353 | 5768 | 590 | 590 | 8.02% | 10.23% | 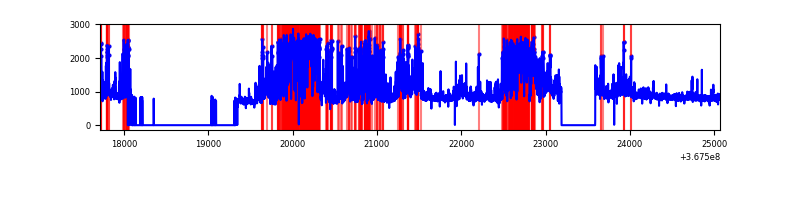 |
| C | 7353 | 5746 | 172 | 172 | 2.34% | 2.99% | 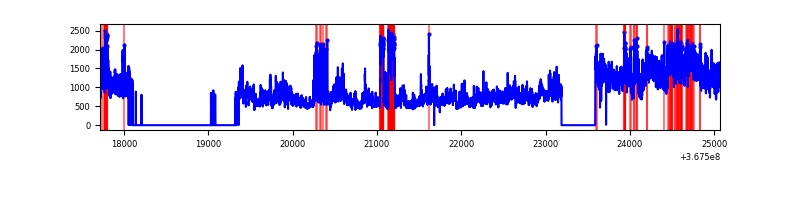 |
| D | 7352 | 5717 | 1377 | 1377 | 18.73% | 24.09% | 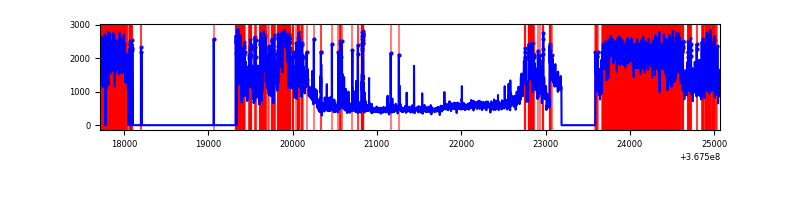 |
Top three noisy pixels from each quadrant. If the there are fewer than three noisy pixels in the level2.evt file, extra rows are filled as -1
| Pixel properties | Quadrant properties | ||||||
|---|---|---|---|---|---|---|---|
| Quadrant | DetID | PixID | Counts | Sigma | Mean | Median | Sigma |
| A | 12 | 96 | 589955 | 4239.69 | 695 | 682 | 139.0 |
| A | 13 | 254 | 10918 | 73.65 | 695 | 682 | 139.0 |
| A | 13 | 6 | 8184 | 53.98 | 695 | 682 | 139.0 |
| B | 5 | 255 | 2162587 | 17600.76 | 654 | 639 | 122.8 |
| B | 6 | 159 | 1644962 | 13386.69 | 654 | 639 | 122.8 |
| B | 5 | 172 | 115658 | 936.39 | 654 | 639 | 122.8 |
| C | 3 | 233 | 2762332 | 18423.84 | 640 | 643 | 149.9 |
| C | 0 | 10 | 127495 | 846.26 | 640 | 643 | 149.9 |
| C | 14 | 238 | 107323 | 711.69 | 640 | 643 | 149.9 |
| D | 12 | 33 | 2795741 | 19381.06 | 603 | 586 | 144.2 |
| D | 8 | 195 | 941182 | 6521.91 | 603 | 586 | 144.2 |
| D | 13 | 249 | 753287 | 5219.08 | 603 | 586 | 144.2 |
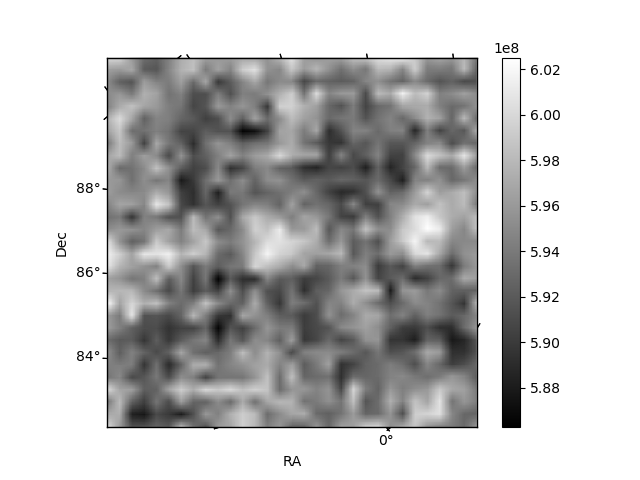
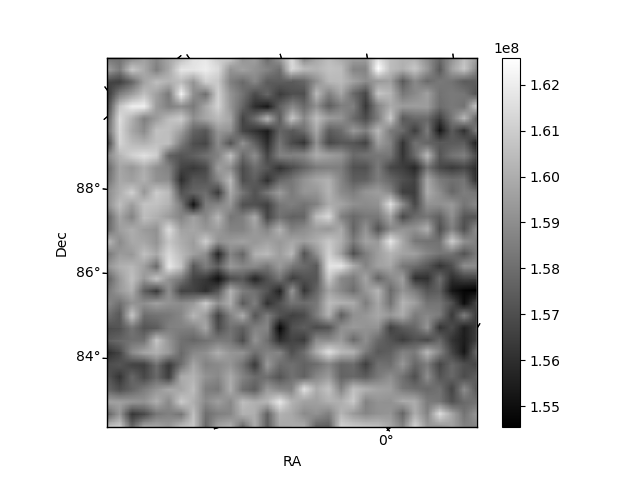
Histogram calculated using DETX and DETY for each event in the final _common_clean file
| Quadrant A | 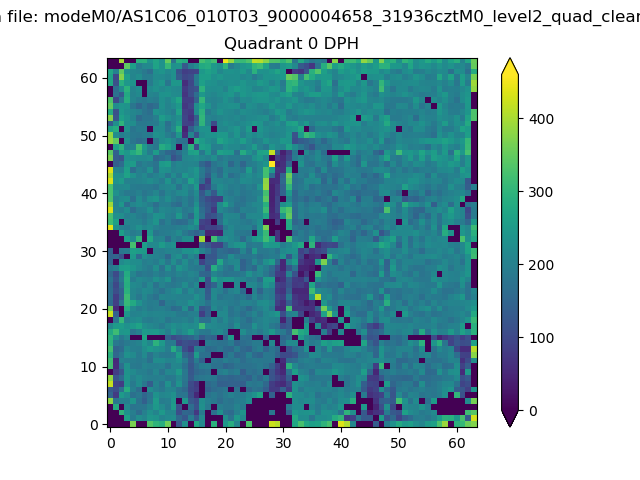 |
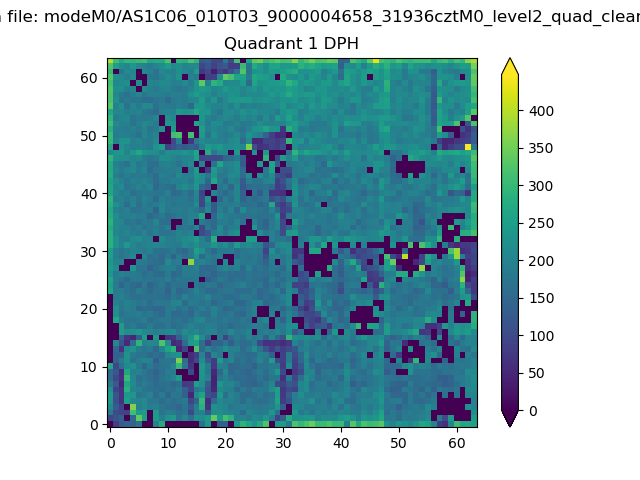 |
Quadrant B |
|---|---|---|---|
| Quadrant D | 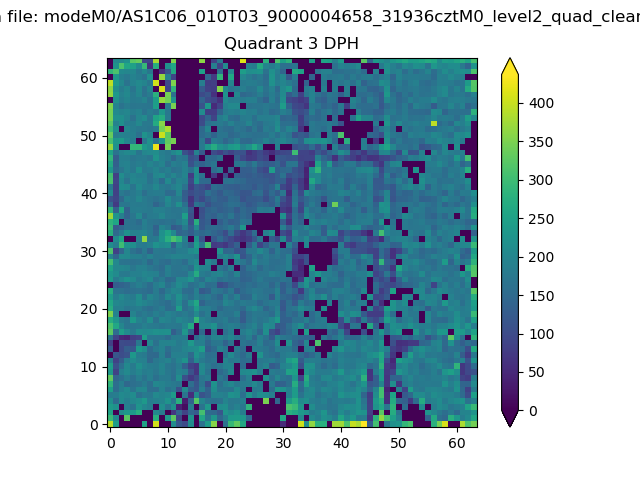 |
 |
Quadrant C |
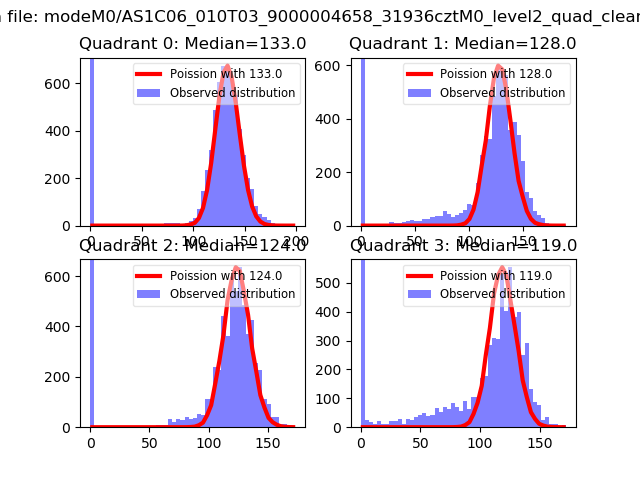
| Plot type | Count rate plots | Images |
|---|---|---|
| Comparison with Poisson distribution Blue bars denote a histogram of data divided into 1 sec bins. Red curve is a Poisson curve with rate = median count rate of data. |
 |
 |
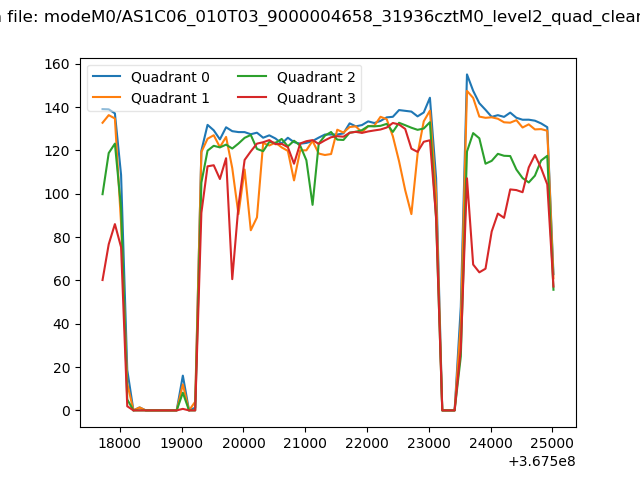
| Quadrant-wise count rates Data is divided into 100 sec bins |
 |
|
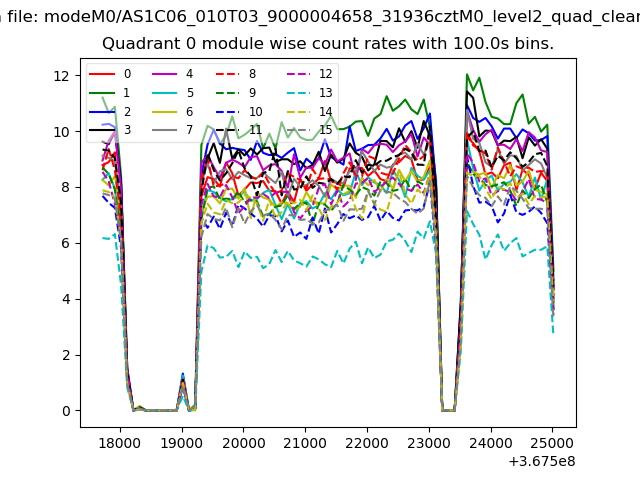
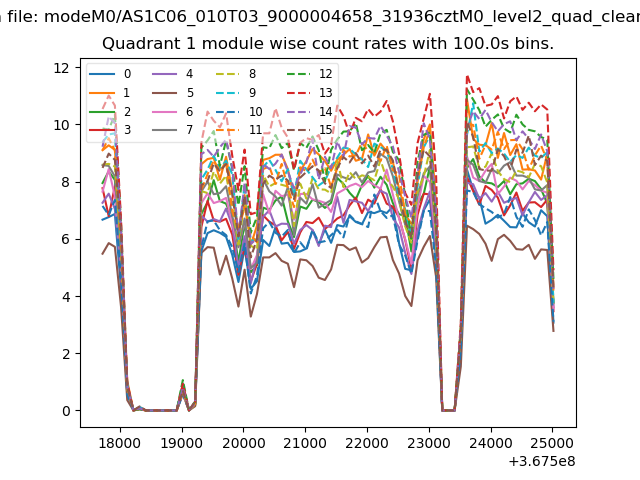
| Module-wise count rates for Quadrant A Data is divided into 100 sec bins |
 |
 |
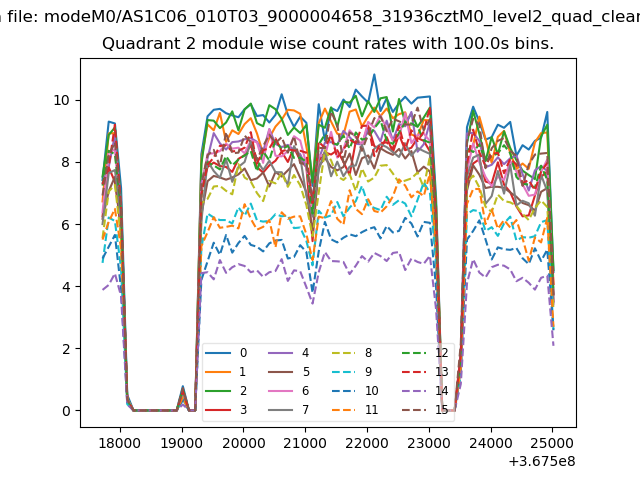
| Module-wise count rates for Quadrant B Data is divided into 100 sec bins |
 |
 |
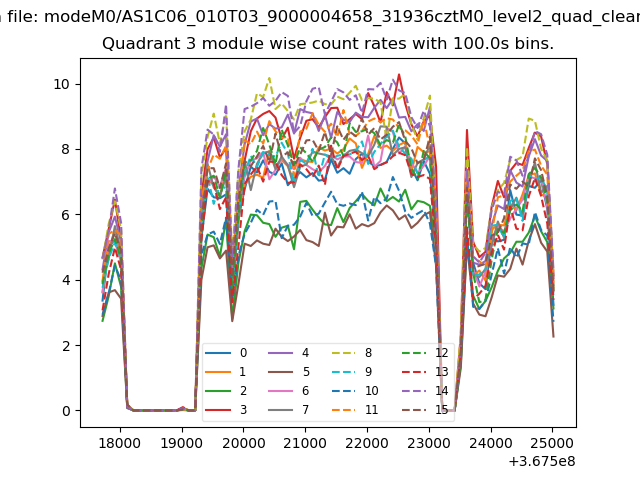
| Module-wise count rates for Quadrant C Data is divided into 100 sec bins |
 |
 |
| Module-wise count rates for Quadrant D Data is divided into 100 sec bins |
 |
 |
| Parameter | Plot |
|---|---|
| CZT HV Monitor |  |
| D_VDD | 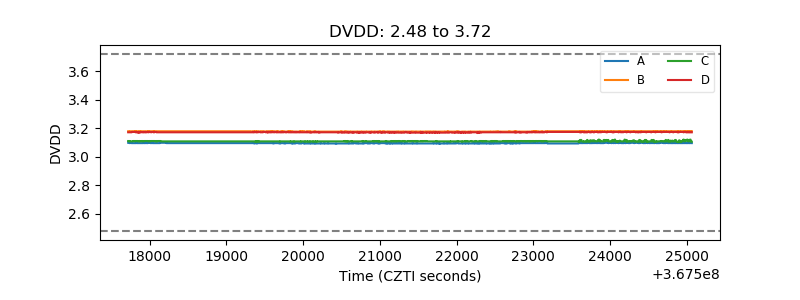 |
| Temperature 1 | 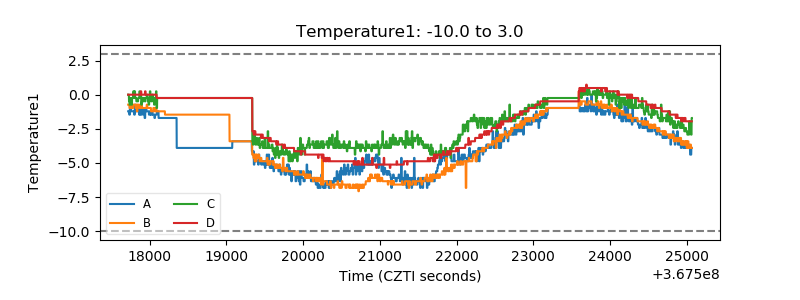 |
| Veto HV Monitor | 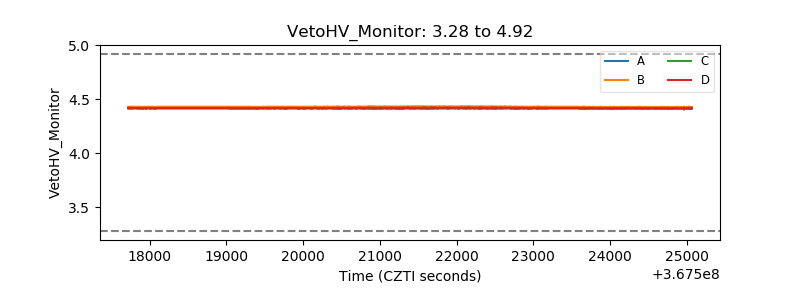 |
| Veto LLD | 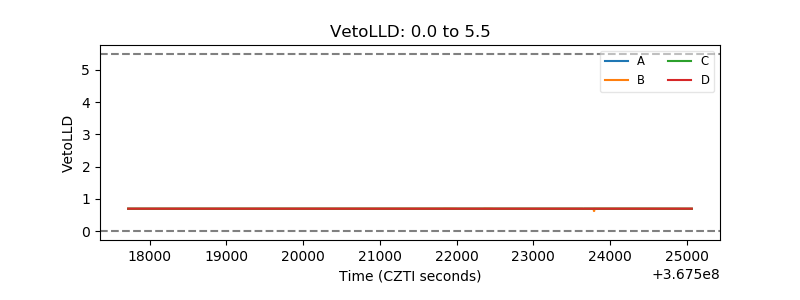 |
| Alpha Counter | 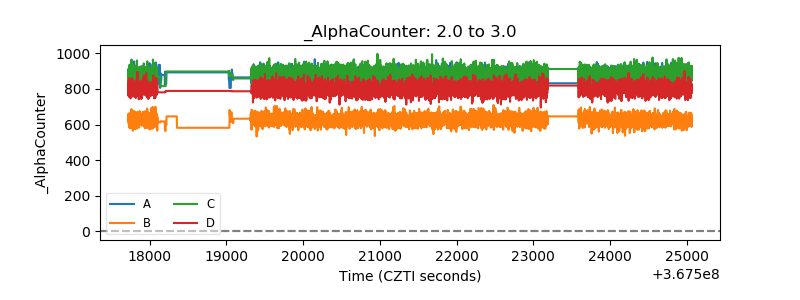 |
| _CPM_Rate | 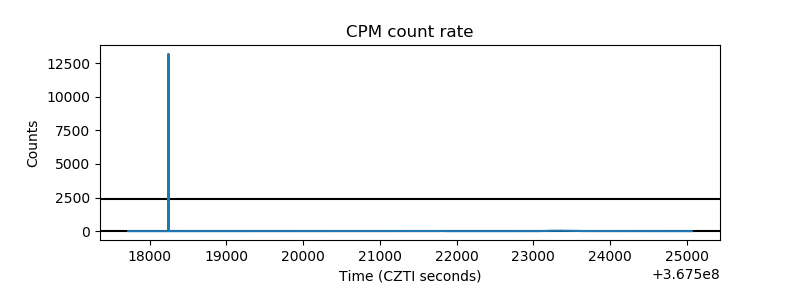 |
| CZT Counter |  |
| +2.5 Volts monitor |  |
| +5 Volts monitor |  |
| _ROLL_ROT | 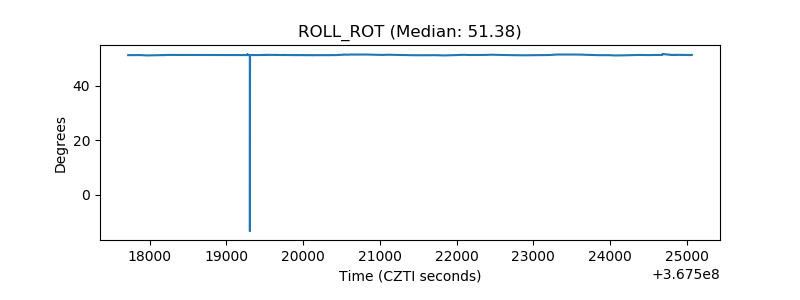 |
| _Roll_DEC |  |
| _Roll_RA |  |
| Veto Counter | 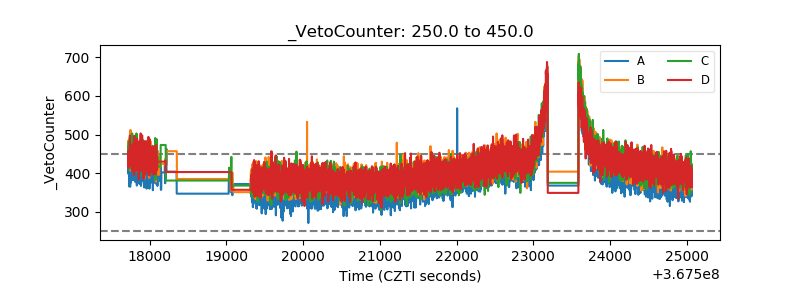 |