| Param | Original file | Final file |
|---|---|---|
| Filename | modeM0/AS1C06_010T03_9000004658_31937cztM0_level2.evt | modeM0/AS1C06_010T03_9000004658_31937cztM0_level2_quad_clean.evt |
| Size (bytes) | 957,516,480 | 137,730,240 |
| Size | 913.2 MB | 131.3 MB |
| Events in quadrant A | 4,272,244 | 982,033 |
| Events in quadrant B | 7,908,899 | 933,963 |
| Events in quadrant C | 6,734,668 | 906,793 |
| Events in quadrant D | 9,580,798 | 827,799 |
| Mode SS | |||
|---|---|---|---|
| Quadrant | BADHDUFLAG | Total packets | Discarded packets |
| A | 0 | 150 | 0 |
| B | 0 | 150 | 0 |
| C | 0 | 150 | 0 |
| D | 0 | 150 | 0 |
| Mode M9 | |||
|---|---|---|---|
| Quadrant | BADHDUFLAG | Total packets | Discarded packets |
| A | 0 | 4 | 0 |
| B | 0 | 4 | 0 |
| C | 0 | 4 | 0 |
| D | 0 | 4 | 0 |
| Mode M0 | |||
|---|---|---|---|
| Quadrant | BADHDUFLAG | Total packets | Discarded packets |
| A | 0 | 17562 | 1 |
| B | 0 | 28718 | 3 |
| C | 0 | 25330 | 1 |
| D | 0 | 33551 | 1 |
| Quadrant | Total seconds | Saturated seconds | Saturation percentage |
|---|---|---|---|
| A | 7469 | 76 | 1.017539% |
| B | 7467 | 902 | 12.079818% |
| C | 7469 | 794 | 10.630607% |
| D | 7469 | 2013 | 26.951399% |
Noise dominated data is calculated using 1-second bins in cleaned event files. If a bin has >2000 counts, and if more than 50% of those come from <1% of pixels, then it is considered to be noise-dominated and hence unusable.
| Quadrant | # 1 sec bins | Bins with >0 counts | Bins with >2000 counts | High rate bins dominated by noise | Noise dominated (total time) | Noise dominated (detector-on time) | Marked lightcurve |
|---|---|---|---|---|---|---|---|
| A | 7868 | 7469 | 35 | 35 | 0.44% | 0.47% |  |
| B | 7869 | 7469 | 574 | 574 | 7.29% | 7.69% |  |
| C | 7869 | 7469 | 169 | 169 | 2.15% | 2.26% | 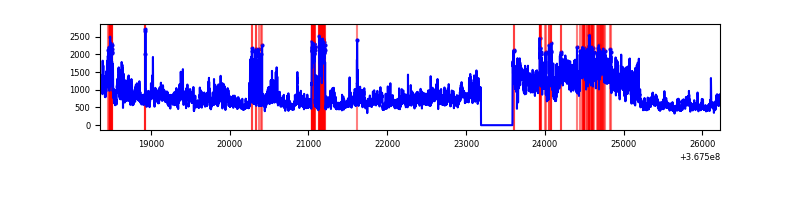 |
| D | 7869 | 7469 | 1829 | 1829 | 23.24% | 24.49% | 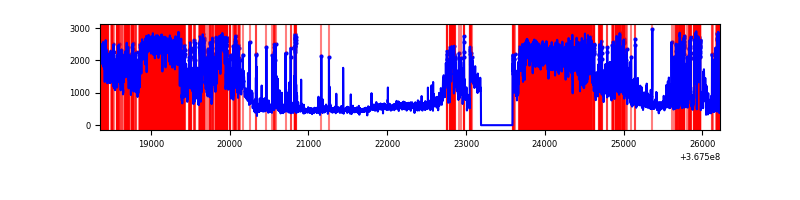 |
Top three noisy pixels from each quadrant. If the there are fewer than three noisy pixels in the level2.evt file, extra rows are filled as -1
| Pixel properties | Quadrant properties | ||||||
|---|---|---|---|---|---|---|---|
| Quadrant | DetID | PixID | Counts | Sigma | Mean | Median | Sigma |
| A | 12 | 96 | 862550 | 4944.39 | 878 | 862 | 174.3 |
| A | 13 | 254 | 14184 | 76.44 | 878 | 862 | 174.3 |
| A | 13 | 6 | 12335 | 65.83 | 878 | 862 | 174.3 |
| B | 6 | 159 | 2129303 | 13638.95 | 841 | 821 | 156.1 |
| B | 5 | 255 | 2120831 | 13584.66 | 841 | 821 | 156.1 |
| B | 5 | 172 | 168987 | 1077.58 | 841 | 821 | 156.1 |
| C | 3 | 233 | 3157956 | 16548.63 | 825 | 828 | 190.8 |
| C | 0 | 10 | 162053 | 845.09 | 825 | 828 | 190.8 |
| C | 14 | 238 | 139719 | 728.02 | 825 | 828 | 190.8 |
| D | 12 | 33 | 3879598 | 21024.0 | 778 | 754 | 184.5 |
| D | 8 | 195 | 1382074 | 7486.99 | 778 | 754 | 184.5 |
| D | 13 | 249 | 833130 | 4511.62 | 778 | 754 | 184.5 |
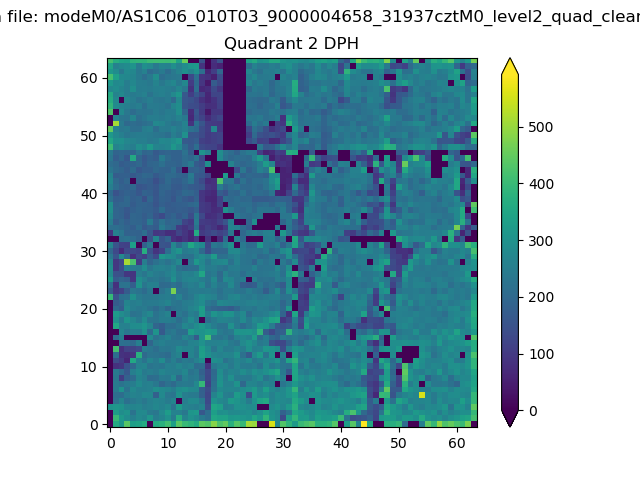
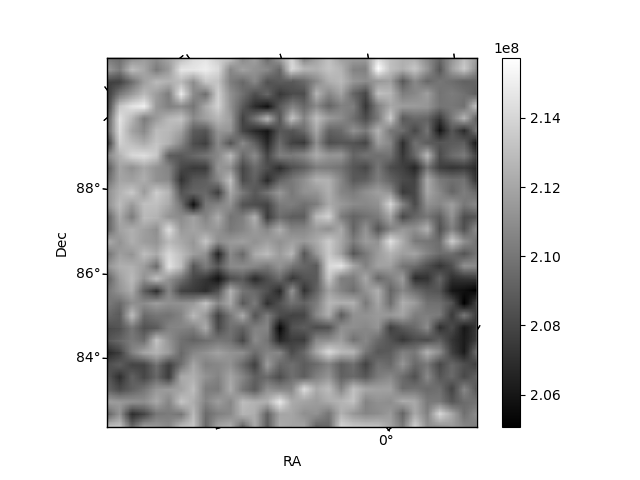
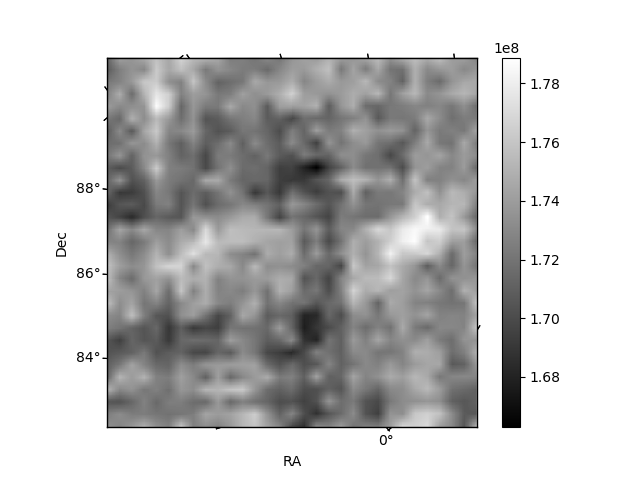
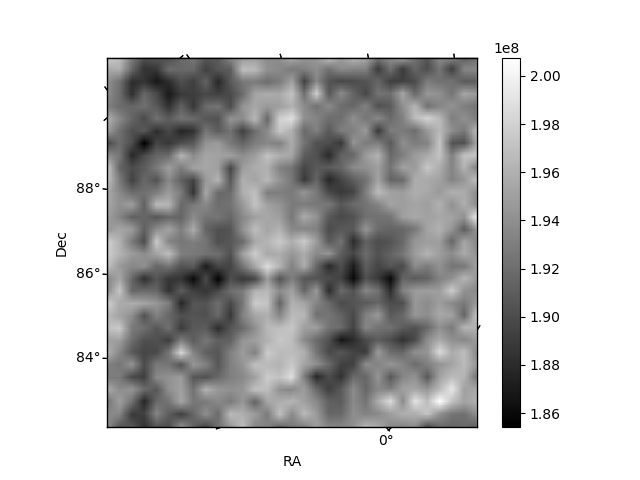
Histogram calculated using DETX and DETY for each event in the final _common_clean file
| Quadrant A | 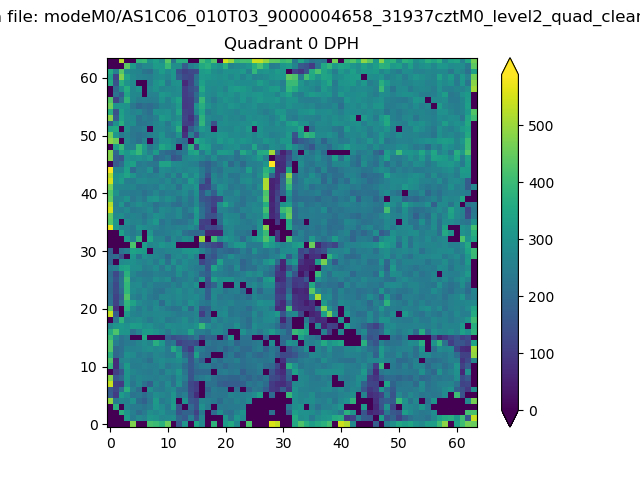 |
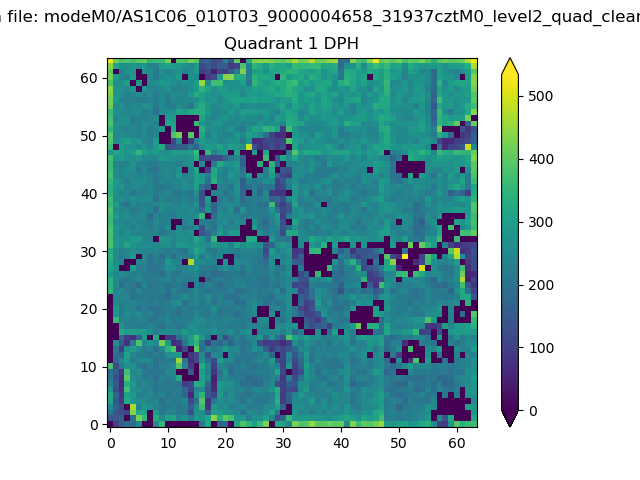 |
Quadrant B |
|---|---|---|---|
| Quadrant D | 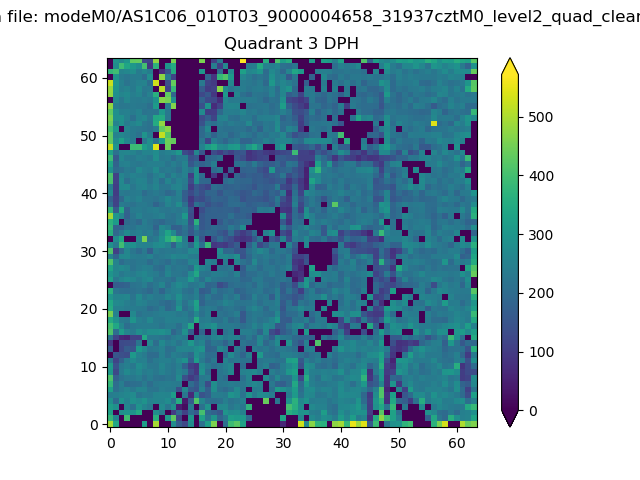 |
 |
Quadrant C |
| Plot type | Count rate plots | Images |
|---|---|---|
| Comparison with Poisson distribution Blue bars denote a histogram of data divided into 1 sec bins. Red curve is a Poisson curve with rate = median count rate of data. |
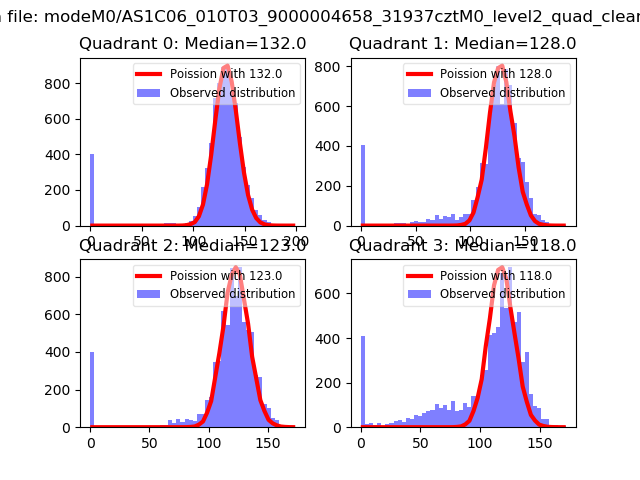 |
 |
| Quadrant-wise count rates Data is divided into 100 sec bins |
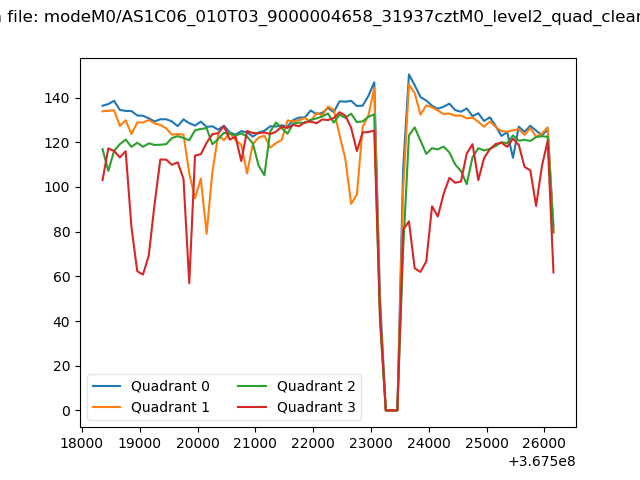 |
|
| Module-wise count rates for Quadrant A Data is divided into 100 sec bins |
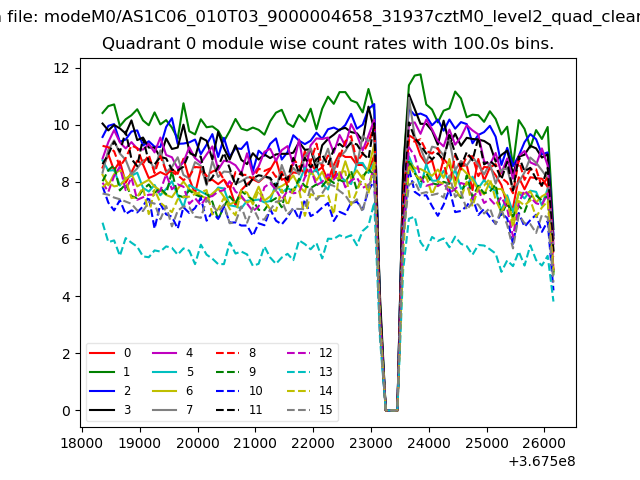 |
 |
| Module-wise count rates for Quadrant B Data is divided into 100 sec bins |
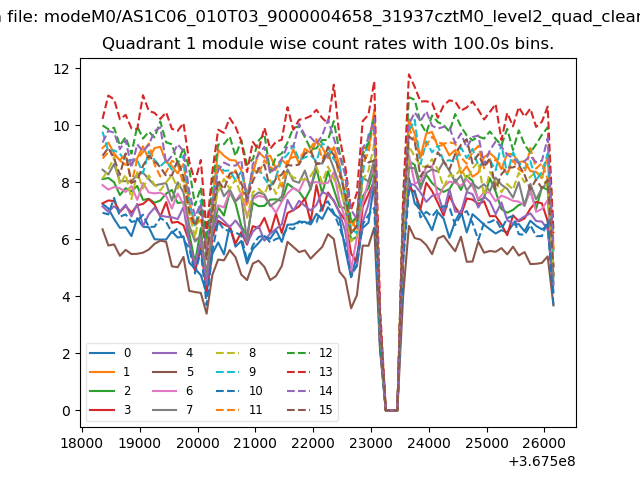 |
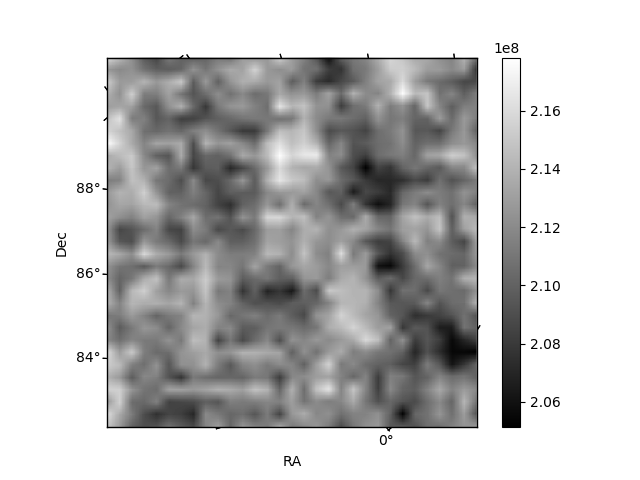 |
| Module-wise count rates for Quadrant C Data is divided into 100 sec bins |
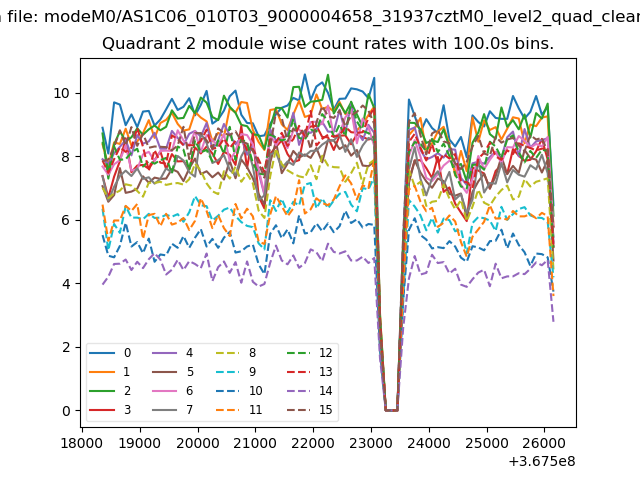 |
 |
| Module-wise count rates for Quadrant D Data is divided into 100 sec bins |
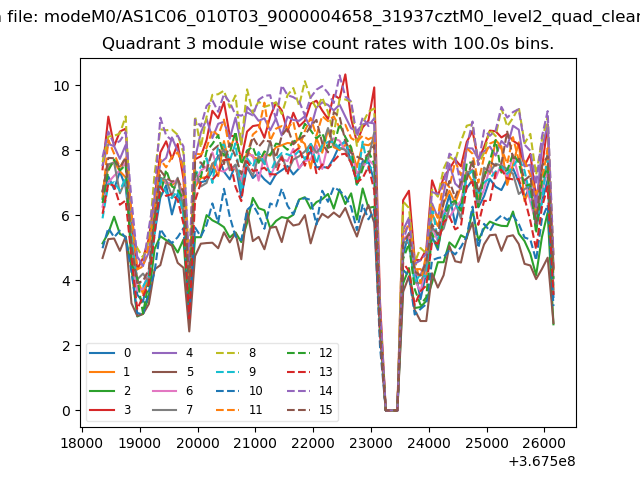 |
 |
| Parameter | Plot |
|---|---|
| CZT HV Monitor | 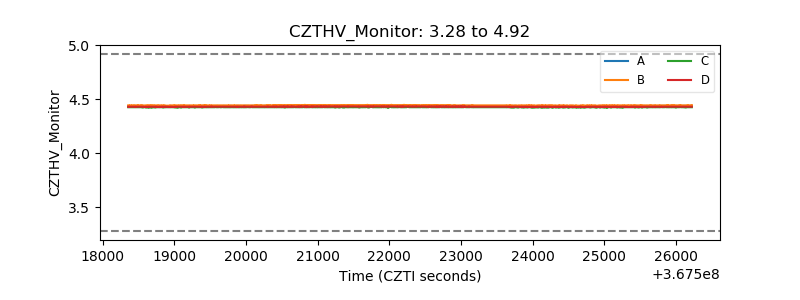 |
| D_VDD | 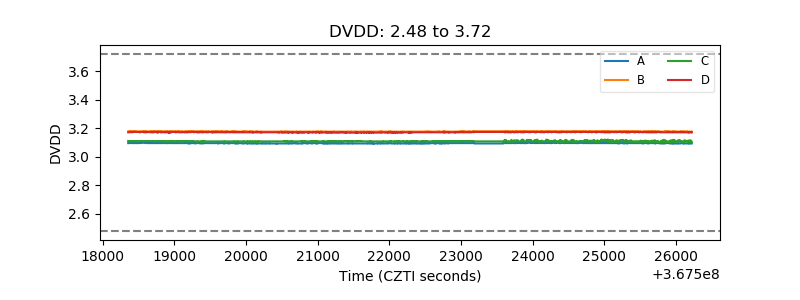 |
| Temperature 1 | 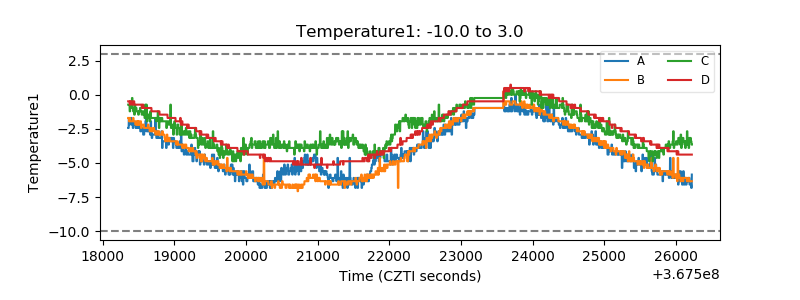 |
| Veto HV Monitor | 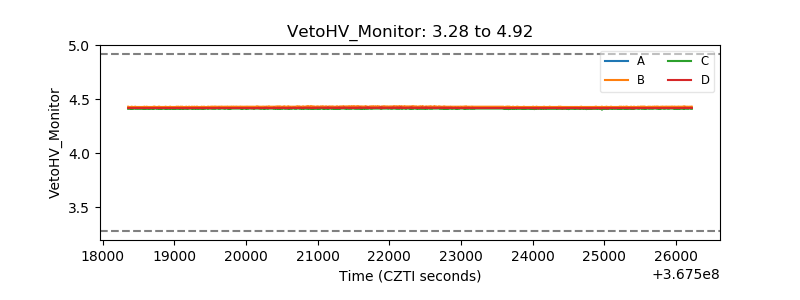 |
| Veto LLD | 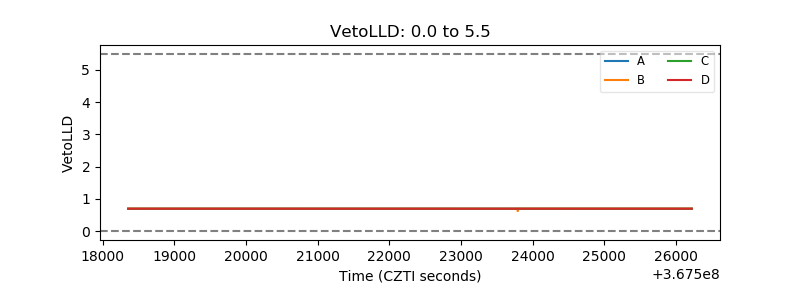 |
| Alpha Counter | 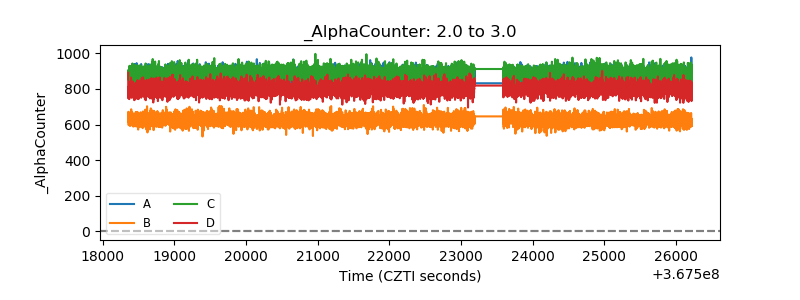 |
| _CPM_Rate | 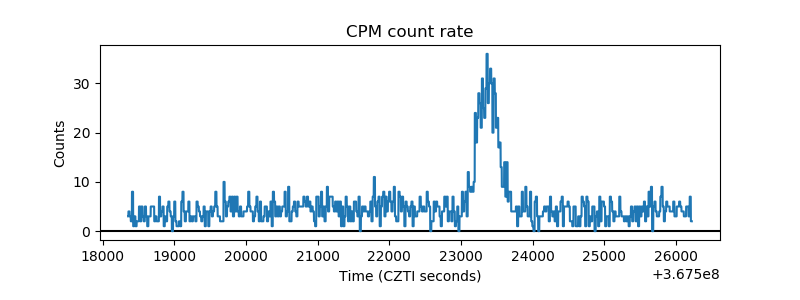 |
| CZT Counter | 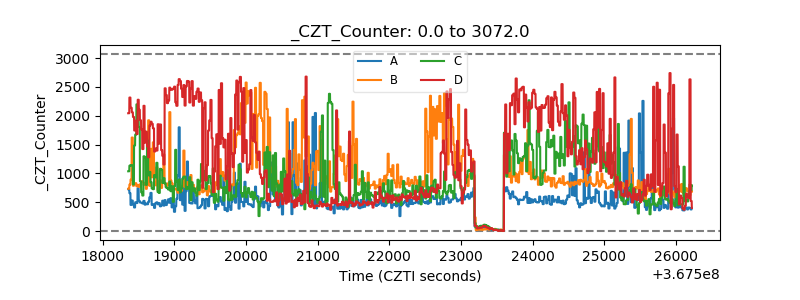 |
| +2.5 Volts monitor |  |
| +5 Volts monitor | 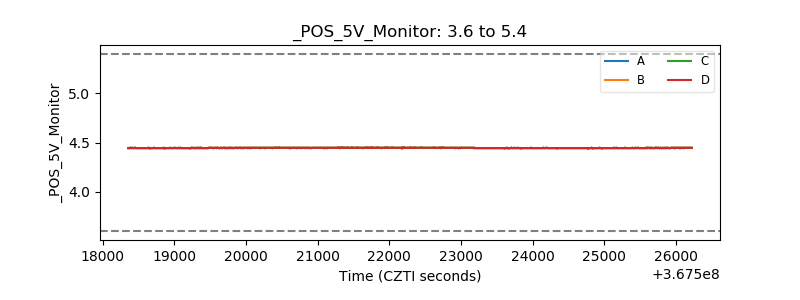 |
| _ROLL_ROT | 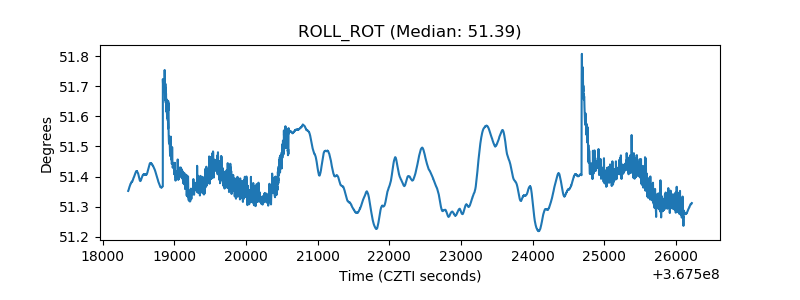 |
| _Roll_DEC | 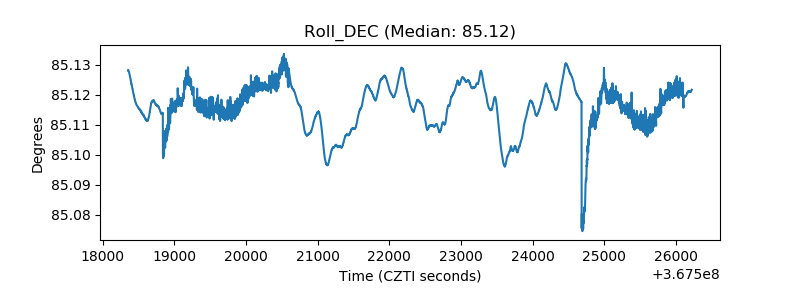 |
| _Roll_RA | 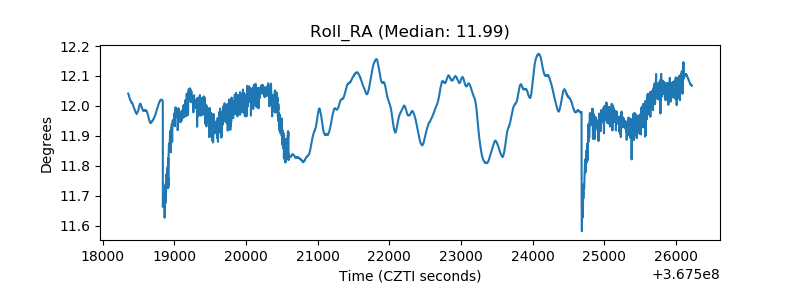 |
| Veto Counter | 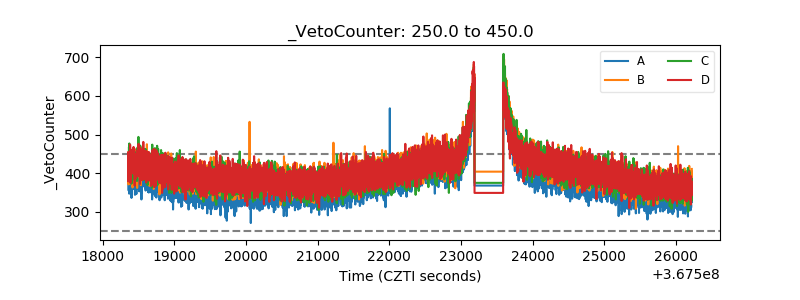 |