| Param | Original file | Final file |
|---|---|---|
| Filename | modeM0/AS1A10_053T11_9000004668cztM0_level2.fits | modeM0/AS1A10_053T11_9000004668cztM0_level2_quad_clean.evt |
| Size (bytes) | 352,788,480 | 161,156,160 |
| Size | 336.4 MB | 153.7 MB |
| Events in quadrant A | 2,192,020 | 610,324 |
| Events in quadrant B | 2,048,446 | 601,810 |
| Events in quadrant C | 2,076,156 | 582,994 |
| Events in quadrant D | 1,822,068 | 538,345 |
| Mode M9 | |||
|---|---|---|---|
| Quadrant | BADHDUFLAG | Total packets | Discarded packets |
| A | 0 | 40 | 0 |
| B | 0 | 40 | 0 |
| C | 0 | 40 | 0 |
| D | 0 | 40 | 0 |
| Mode M0 | |||
|---|---|---|---|
| Quadrant | BADHDUFLAG | Total packets | Discarded packets |
| A | 0 | 76494 | 0 |
| B | 0 | 113625 | 0 |
| C | 0 | 94780 | 0 |
| D | 0 | 109292 | 0 |
| Mode SS | |||
|---|---|---|---|
| Quadrant | BADHDUFLAG | Total packets | Discarded packets |
| A | 0 | 758 | 0 |
| B | 0 | 758 | 0 |
| C | 0 | 758 | 0 |
| D | 0 | 758 | 0 |
| Quadrant | Total seconds | Saturated seconds | Saturation percentage |
|---|---|---|---|
| A | 37027 | 410 | 1.107300% |
| B | 37029 | 1039 | 2.805909% |
| C | 37028 | 1672 | 4.515502% |
| D | 37028 | 2657 | 7.175651% |
Noise dominated data is calculated using 1-second bins in cleaned event files. If a bin has >2000 counts, and if more than 50% of those come from <1% of pixels, then it is considered to be noise-dominated and hence unusable.
| Quadrant | # 1 sec bins | Bins with >0 counts | Bins with >2000 counts | High rate bins dominated by noise | Noise dominated (total time) | Noise dominated (detector-on time) | Marked lightcurve |
|---|---|---|---|---|---|---|---|
| A | 41163 | 37023 | 0 | 0 | 0.00% | 0.00% |  |
| B | 41164 | 37022 | 0 | 0 | 0.00% | 0.00% |  |
| C | 41164 | 37022 | 0 | 0 | 0.00% | 0.00% |  |
| D | 41164 | 36997 | 0 | 0 | 0.00% | 0.00% |  |
Top three noisy pixels from each quadrant. If the there are fewer than three noisy pixels in the level2.evt file, extra rows are filled as -1
| Pixel properties | Quadrant properties | ||||||
|---|---|---|---|---|---|---|---|
| Quadrant | DetID | PixID | Counts | Sigma | Mean | Median | Sigma |
| A | 0 | 29 | 2115 | 11.07 | 571 | 537 | 142.5 |
| A | 7 | 110 | 1720 | 8.3 | 571 | 537 | 142.5 |
| A | 0 | 30 | 1690 | 8.09 | 571 | 537 | 142.5 |
| B | 2 | 9 | 1660 | 10.59 | 540 | 515 | 108.2 |
| B | 2 | 8 | 1390 | 8.09 | 540 | 515 | 108.2 |
| B | 3 | 17 | 1376 | 7.96 | 540 | 515 | 108.2 |
| C | 3 | 126 | 1484 | 6.94 | 549 | 513 | 139.9 |
| C | 12 | 241 | 1445 | 6.66 | 549 | 513 | 139.9 |
| C | 9 | 242 | 1415 | 6.45 | 549 | 513 | 139.9 |
| D | 3 | 14 | 1415 | 6.64 | 521 | 475 | 141.5 |
| D | 10 | 189 | 1367 | 6.3 | 521 | 475 | 141.5 |
| D | 15 | 47 | 1272 | 5.63 | 521 | 475 | 141.5 |
Histogram calculated using DETX and DETY for each event in the final _common_clean file
| Quadrant A |  |
 |
Quadrant B |
|---|---|---|---|
| Quadrant D |  |
 |
Quadrant C |
| Plot type | Count rate plots | Images |
|---|---|---|
| Comparison with Poisson distribution Blue bars denote a histogram of data divided into 1 sec bins. Red curve is a Poisson curve with rate = median count rate of data. |
 |
 |
| Quadrant-wise count rates Data is divided into 100 sec bins |
 |
|
| Module-wise count rates for Quadrant A Data is divided into 100 sec bins |
 |
 |
| Module-wise count rates for Quadrant B Data is divided into 100 sec bins |
 |
 |
| Module-wise count rates for Quadrant C Data is divided into 100 sec bins |
 |
 |
| Module-wise count rates for Quadrant D Data is divided into 100 sec bins |
 |
 |
| Parameter | Plot |
|---|---|
| CZT HV Monitor |  |
| D_VDD |  |
| Temperature 1 | 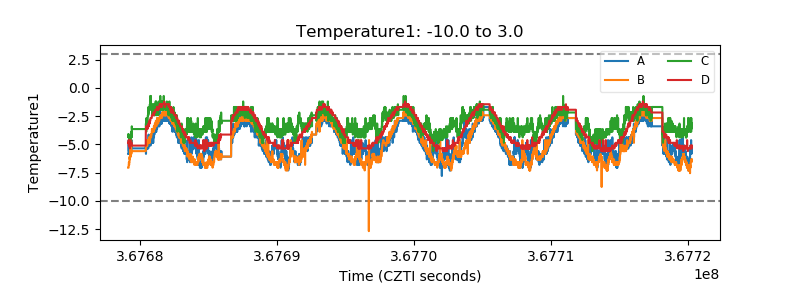 |
| Veto HV Monitor |  |
| Veto LLD |  |
| Alpha Counter |  |
| _CPM_Rate |  |
| CZT Counter |  |
| +2.5 Volts monitor |  |
| +5 Volts monitor |  |
| _ROLL_ROT | 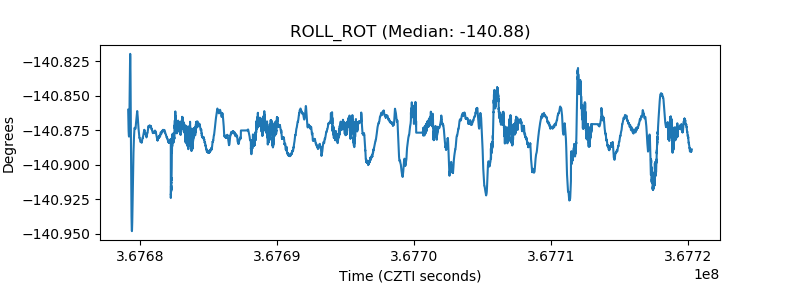 |
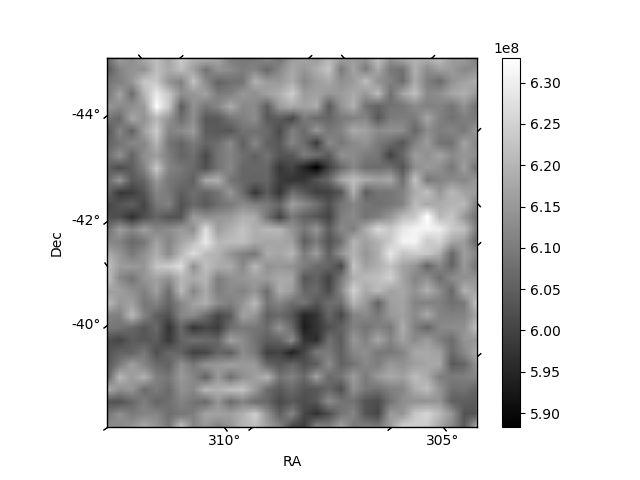
| _Roll_DEC |  |
| _Roll_RA |  |
| Veto Counter |  |