| Param | Original file | Final file |
|---|---|---|
| Filename | modeM0/AS1A10_053T11_9000004668_31971cztM0_level2.evt | modeM0/AS1A10_053T11_9000004668_31971cztM0_level2_quad_clean.evt |
| Size (bytes) | 3,319,683,840 | 479,833,920 |
| Size | 3.1 GB | 457.6 MB |
| Events in quadrant A | 17,508,290 | 3,099,641 |
| Events in quadrant B | 28,376,254 | 3,070,094 |
| Events in quadrant C | 23,710,293 | 2,978,936 |
| Events in quadrant D | 28,451,865 | 2,840,039 |
| Mode M9 | |||
|---|---|---|---|
| Quadrant | BADHDUFLAG | Total packets | Discarded packets |
| A | 0 | 40 | 0 |
| B | 0 | 40 | 0 |
| C | 0 | 40 | 0 |
| D | 0 | 40 | 0 |
| Mode M0 | |||
|---|---|---|---|
| Quadrant | BADHDUFLAG | Total packets | Discarded packets |
| A | 0 | 76502 | 8 |
| B | 0 | 113632 | 7 |
| C | 0 | 94790 | 10 |
| D | 0 | 109300 | 8 |
| Mode SS | |||
|---|---|---|---|
| Quadrant | BADHDUFLAG | Total packets | Discarded packets |
| A | 0 | 758 | 0 |
| B | 0 | 758 | 0 |
| C | 0 | 758 | 0 |
| D | 0 | 758 | 0 |
| Quadrant | Total seconds | Saturated seconds | Saturation percentage |
|---|---|---|---|
| A | 37027 | 410 | 1.107300% |
| B | 37029 | 1039 | 2.805909% |
| C | 37028 | 1672 | 4.515502% |
| D | 37028 | 2657 | 7.175651% |
Noise dominated data is calculated using 1-second bins in cleaned event files. If a bin has >2000 counts, and if more than 50% of those come from <1% of pixels, then it is considered to be noise-dominated and hence unusable.
| Quadrant | # 1 sec bins | Bins with >0 counts | Bins with >2000 counts | High rate bins dominated by noise | Noise dominated (total time) | Noise dominated (detector-on time) | Marked lightcurve |
|---|---|---|---|---|---|---|---|
| A | 41163 | 37030 | 15 | 15 | 0.04% | 0.04% | 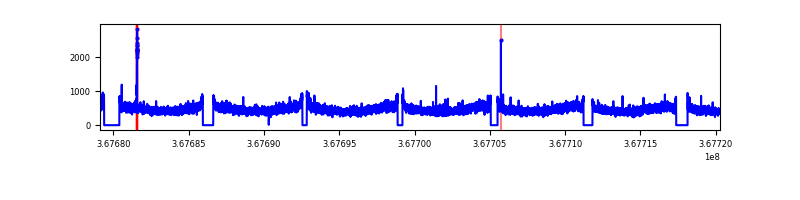 |
| B | 41164 | 37030 | 131 | 131 | 0.32% | 0.35% | 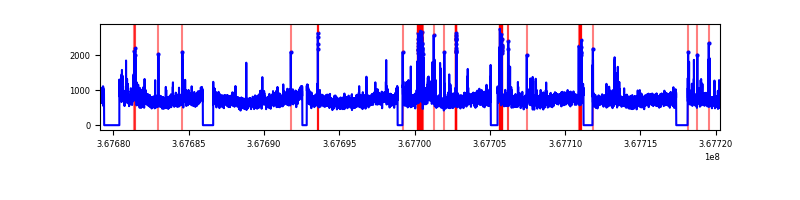 |
| C | 41164 | 37031 | 511 | 511 | 1.24% | 1.38% | 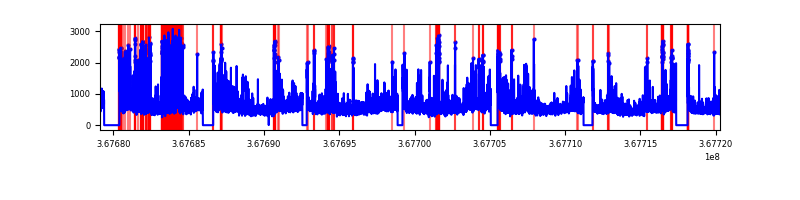 |
| D | 41164 | 37031 | 2389 | 2389 | 5.80% | 6.45% | 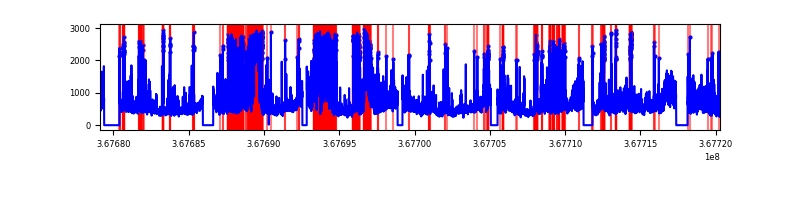 |
Top three noisy pixels from each quadrant. If the there are fewer than three noisy pixels in the level2.evt file, extra rows are filled as -1
| Pixel properties | Quadrant properties | ||||||
|---|---|---|---|---|---|---|---|
| Quadrant | DetID | PixID | Counts | Sigma | Mean | Median | Sigma |
| A | 13 | 254 | 65182 | 67.41 | 4518 | 4427 | 901.3 |
| A | 12 | 96 | 51296 | 52.0 | 4518 | 4427 | 901.3 |
| A | 3 | 137 | 47661 | 47.97 | 4518 | 4427 | 901.3 |
| B | 6 | 159 | 9676931 | 11303.5 | 4455 | 4327 | 855.7 |
| B | 10 | 245 | 707930 | 822.24 | 4455 | 4327 | 855.7 |
| B | 0 | 190 | 138755 | 157.09 | 4455 | 4327 | 855.7 |
| C | 0 | 10 | 4136386 | 4106.55 | 4294 | 4310 | 1006.2 |
| C | 3 | 233 | 2012593 | 1995.88 | 4294 | 4310 | 1006.2 |
| C | 14 | 238 | 701458 | 692.84 | 4294 | 4310 | 1006.2 |
| D | 7 | 238 | 7377916 | 7281.21 | 4276 | 4161 | 1012.7 |
| D | 8 | 195 | 2360020 | 2326.29 | 4276 | 4161 | 1012.7 |
| D | 12 | 218 | 1084381 | 1066.66 | 4276 | 4161 | 1012.7 |
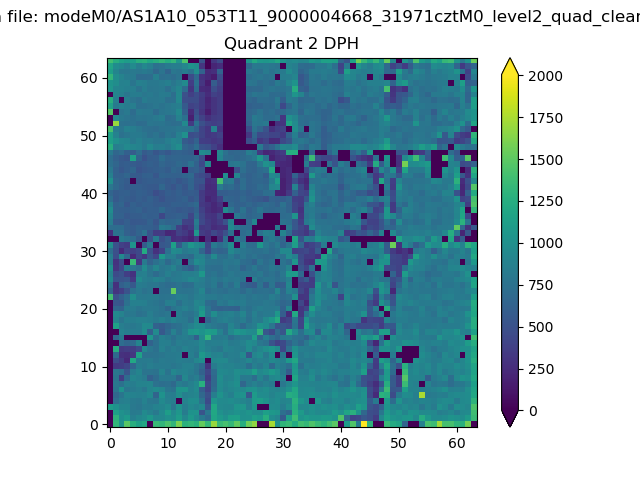
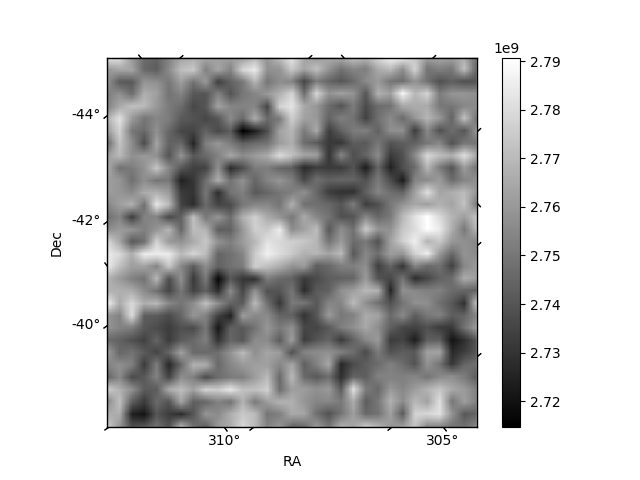
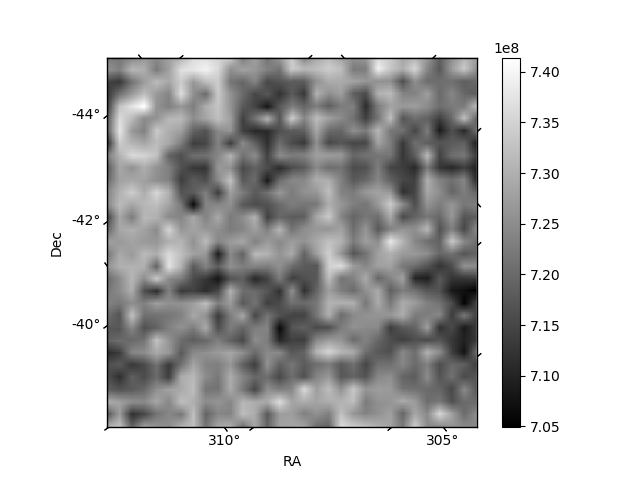
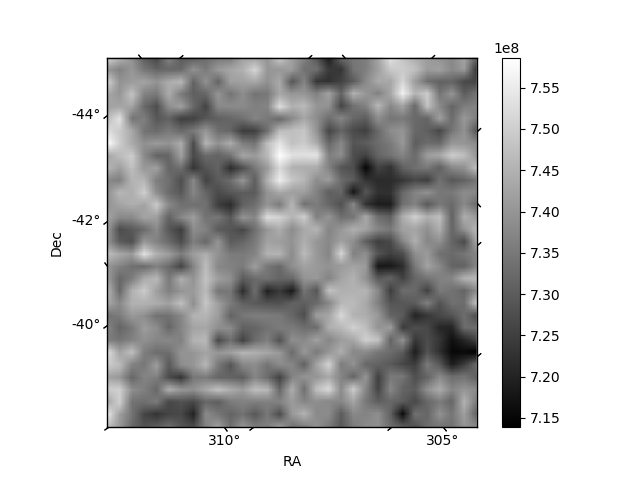
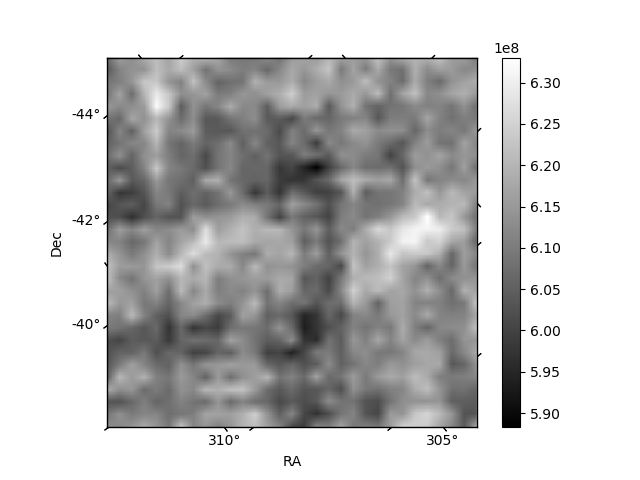
Histogram calculated using DETX and DETY for each event in the final _common_clean file
| Quadrant A | 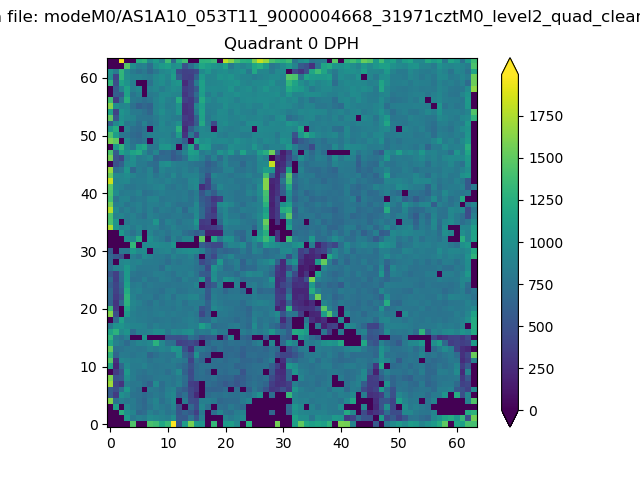 |
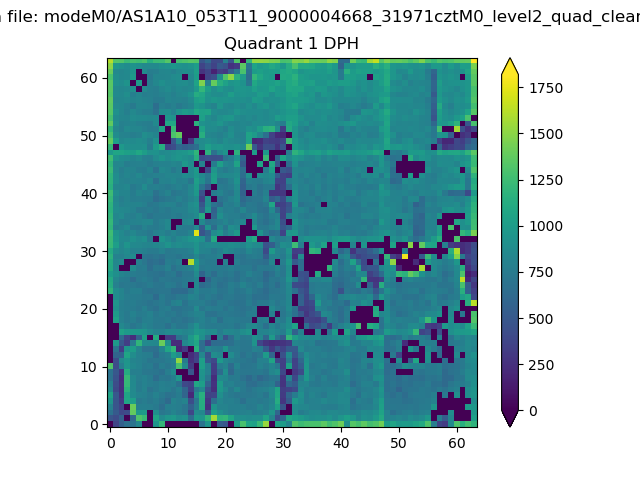 |
Quadrant B |
|---|---|---|---|
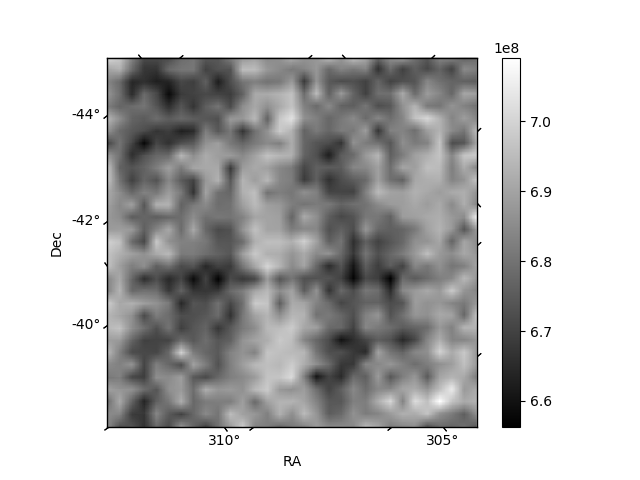
| Quadrant D | 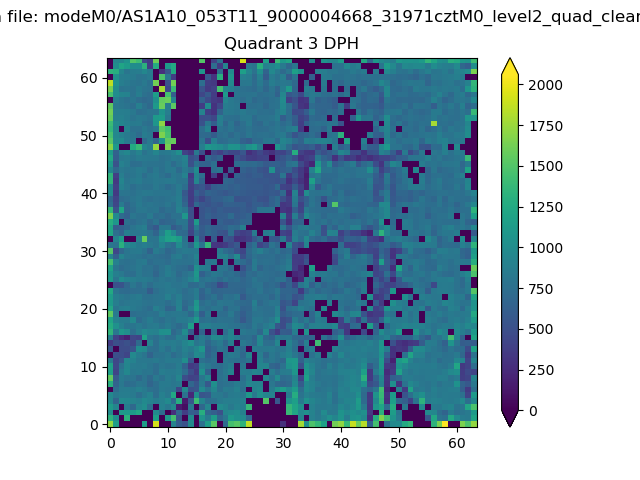 |
 |
Quadrant C |
| Plot type | Count rate plots | Images |
|---|---|---|
| Comparison with Poisson distribution Blue bars denote a histogram of data divided into 1 sec bins. Red curve is a Poisson curve with rate = median count rate of data. |
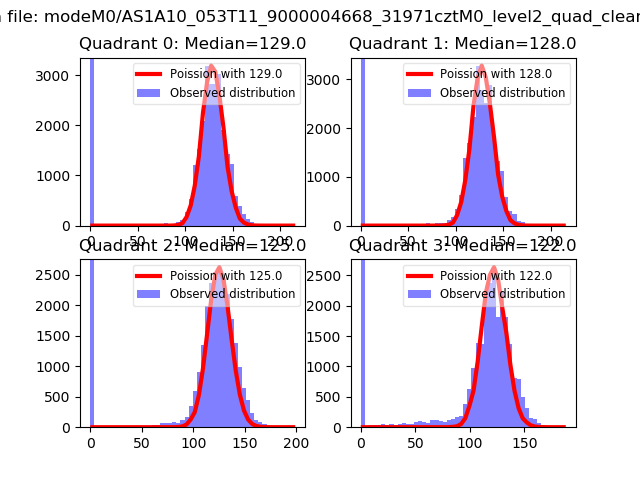 |
 |
| Quadrant-wise count rates Data is divided into 100 sec bins |
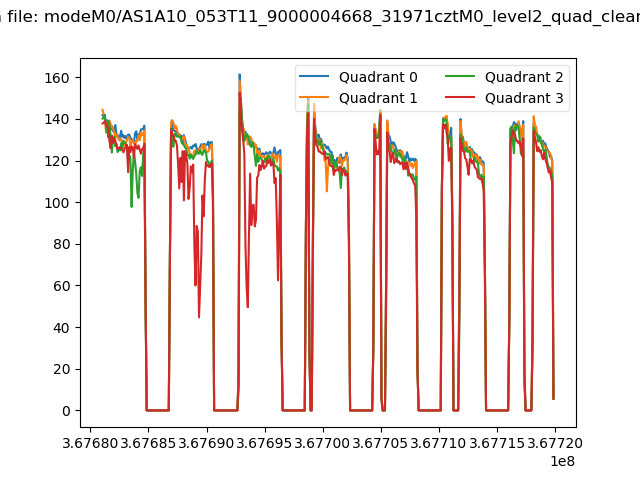 |
|
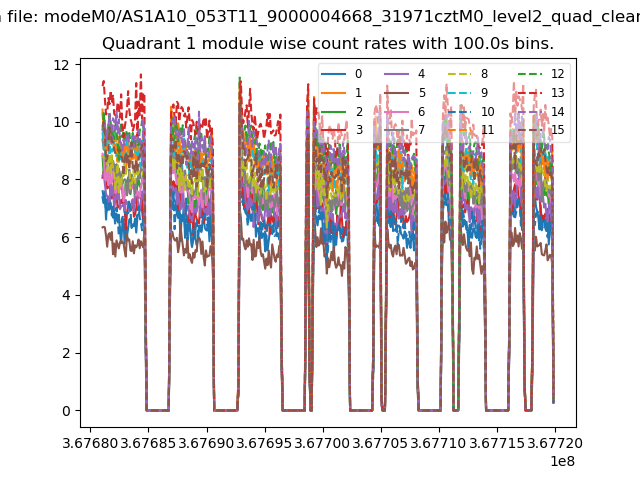
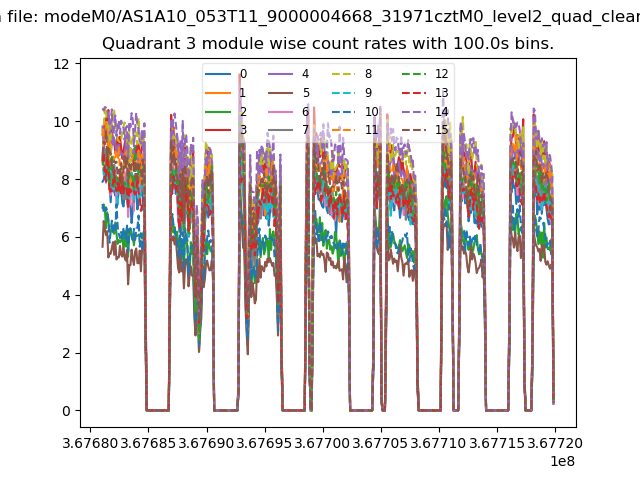
| Module-wise count rates for Quadrant A Data is divided into 100 sec bins |
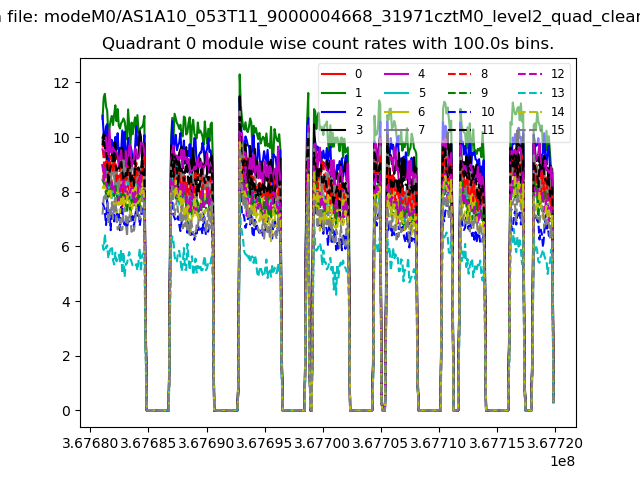 |
 |
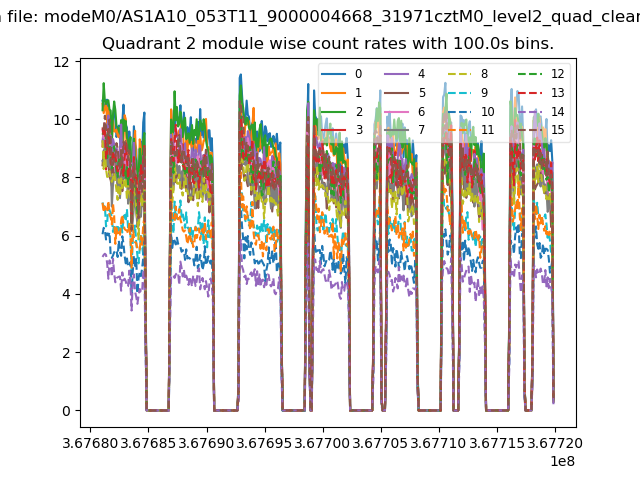
| Module-wise count rates for Quadrant B Data is divided into 100 sec bins |
 |
 |
| Module-wise count rates for Quadrant C Data is divided into 100 sec bins |
 |
 |
| Module-wise count rates for Quadrant D Data is divided into 100 sec bins |
 |
 |
| Parameter | Plot |
|---|---|
| CZT HV Monitor | 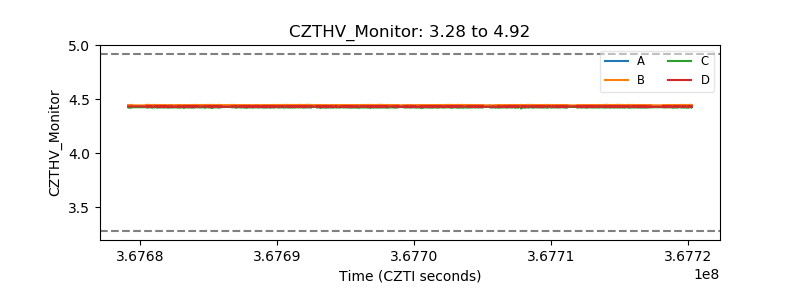 |
| D_VDD |  |
| Temperature 1 | 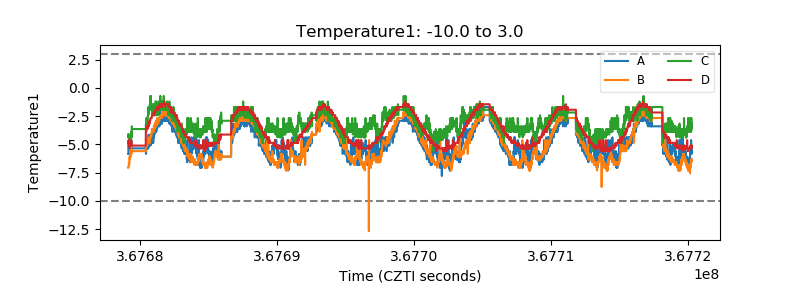 |
| Veto HV Monitor | 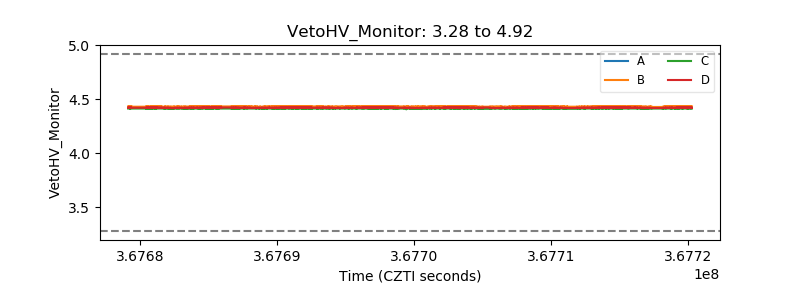 |
| Veto LLD | 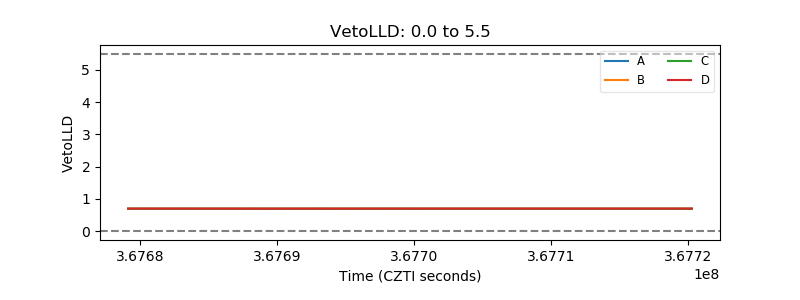 |
| Alpha Counter | 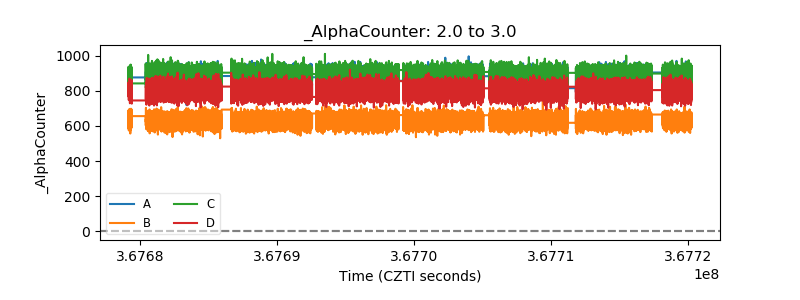 |
| _CPM_Rate | 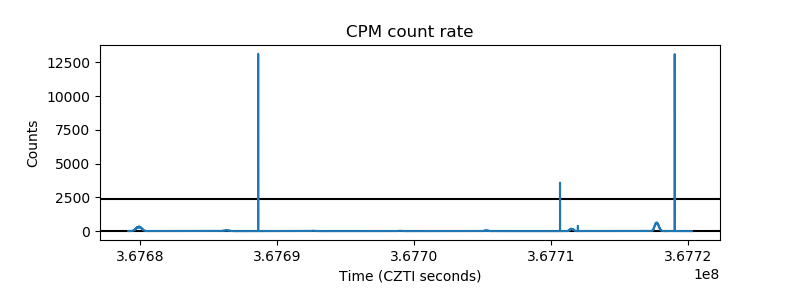 |
| CZT Counter | 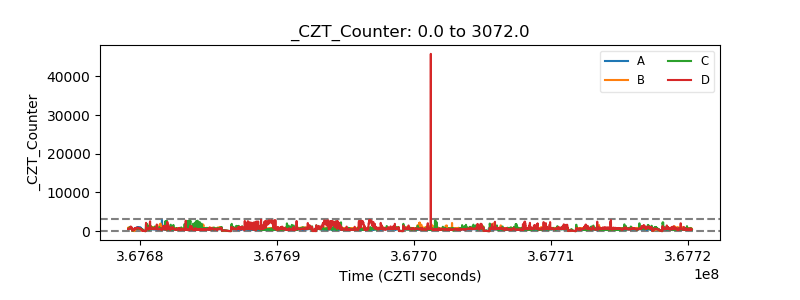 |
| +2.5 Volts monitor |  |
| +5 Volts monitor |  |
| _ROLL_ROT | 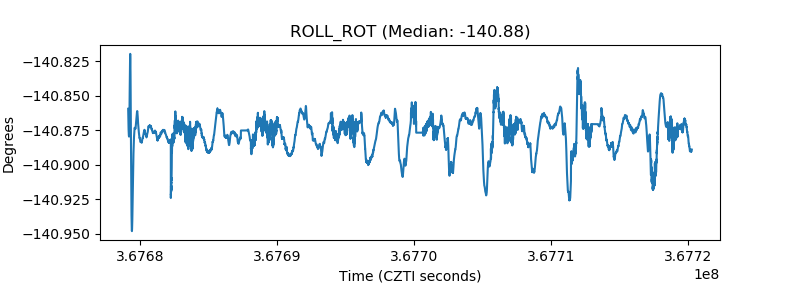 |
| _Roll_DEC | 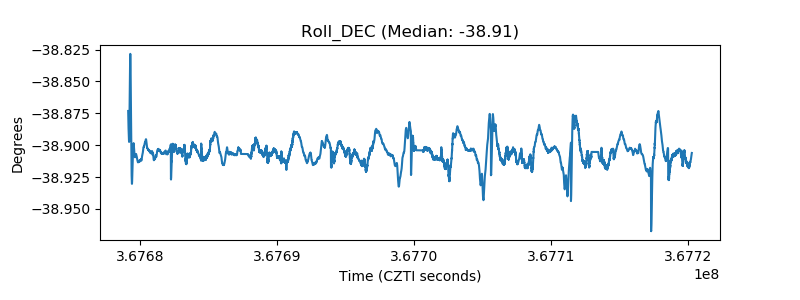 |
| _Roll_RA | 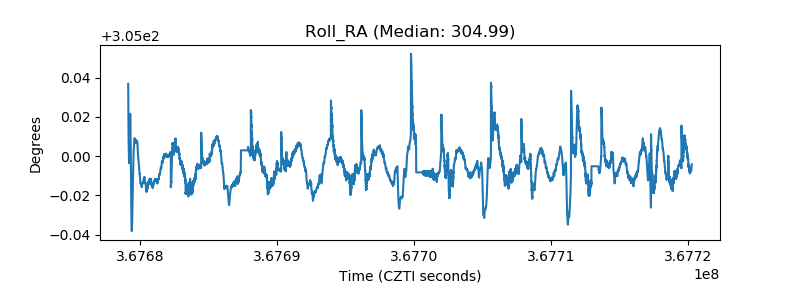 |
| Veto Counter | 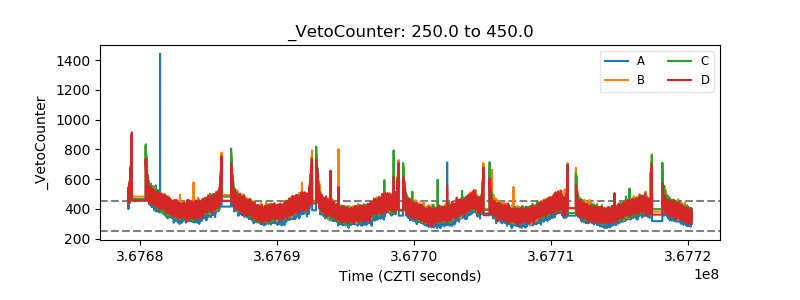 |