| Param | Original file | Final file |
|---|---|---|
| Filename | modeM0/AS1A10_094T30_9000004666cztM0_level2.fits | modeM0/AS1A10_094T30_9000004666cztM0_level2_quad_clean.evt |
| Size (bytes) | 43,528,320 | 32,440,320 |
| Size | 41.5 MB | 30.9 MB |
| Events in quadrant A | 278,446 | 184,794 |
| Events in quadrant B | 253,218 | 172,677 |
| Events in quadrant C | 259,826 | 172,988 |
| Events in quadrant D | 236,530 | 160,574 |
| Mode M9 | |||
|---|---|---|---|
| Quadrant | BADHDUFLAG | Total packets | Discarded packets |
| A | 0 | 13 | 0 |
| B | 0 | 13 | 0 |
| C | 0 | 13 | 0 |
| D | 0 | 13 | 0 |
| Mode M0 | |||
|---|---|---|---|
| Quadrant | BADHDUFLAG | Total packets | Discarded packets |
| A | 0 | 8543 | 0 |
| B | 0 | 13517 | 0 |
| C | 0 | 10075 | 0 |
| D | 0 | 10225 | 0 |
| Mode SS | |||
|---|---|---|---|
| Quadrant | BADHDUFLAG | Total packets | Discarded packets |
| A | 0 | 84 | 0 |
| B | 0 | 84 | 0 |
| C | 0 | 84 | 0 |
| D | 0 | 84 | 0 |
| Quadrant | Total seconds | Saturated seconds | Saturation percentage |
|---|---|---|---|
| A | 4120 | 27 | 0.655340% |
| B | 4120 | 194 | 4.708738% |
| C | 4120 | 101 | 2.451456% |
| D | 4120 | 61 | 1.480583% |
Noise dominated data is calculated using 1-second bins in cleaned event files. If a bin has >2000 counts, and if more than 50% of those come from <1% of pixels, then it is considered to be noise-dominated and hence unusable.
| Quadrant | # 1 sec bins | Bins with >0 counts | Bins with >2000 counts | High rate bins dominated by noise | Noise dominated (total time) | Noise dominated (detector-on time) | Marked lightcurve |
|---|---|---|---|---|---|---|---|
| A | 5349 | 4118 | 0 | 0 | 0.00% | 0.00% |  |
| B | 5349 | 4118 | 0 | 0 | 0.00% | 0.00% |  |
| C | 5349 | 4118 | 0 | 0 | 0.00% | 0.00% |  |
| D | 5349 | 4117 | 0 | 0 | 0.00% | 0.00% | 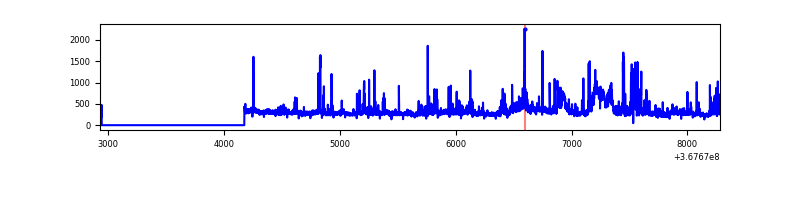 |
Top three noisy pixels from each quadrant. If the there are fewer than three noisy pixels in the level2.evt file, extra rows are filled as -1
| Pixel properties | Quadrant properties | ||||||
|---|---|---|---|---|---|---|---|
| Quadrant | DetID | PixID | Counts | Sigma | Mean | Median | Sigma |
| A | 0 | 29 | 274 | 10.81 | 72 | 69 | 19.0 |
| A | 9 | 19 | 212 | 7.54 | 72 | 69 | 19.0 |
| A | 15 | 236 | 210 | 7.43 | 72 | 69 | 19.0 |
| B | 2 | 9 | 223 | 10.29 | 67 | 64 | 15.4 |
| B | 2 | 8 | 176 | 7.25 | 67 | 64 | 15.4 |
| B | 3 | 80 | 174 | 7.12 | 67 | 64 | 15.4 |
| C | 3 | 187 | 195 | 6.75 | 68 | 65 | 19.2 |
| C | 3 | 158 | 181 | 6.03 | 68 | 65 | 19.2 |
| C | 7 | 233 | 176 | 5.77 | 68 | 65 | 19.2 |
| D | 3 | 14 | 185 | 6.38 | 67 | 61 | 19.4 |
| D | 10 | 189 | 184 | 6.32 | 67 | 61 | 19.4 |
| D | 4 | 246 | 180 | 6.12 | 67 | 61 | 19.4 |
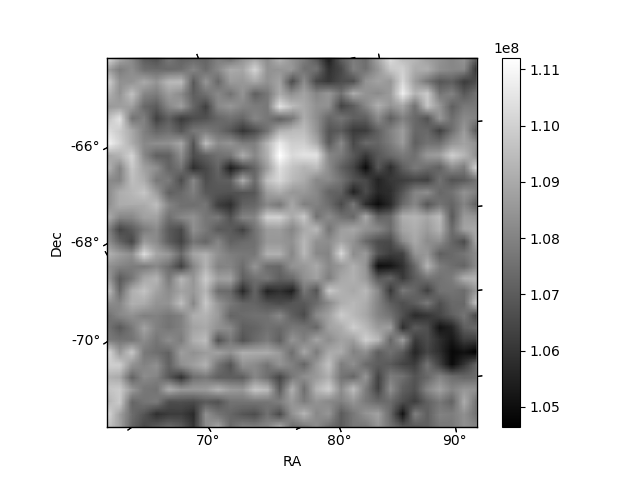
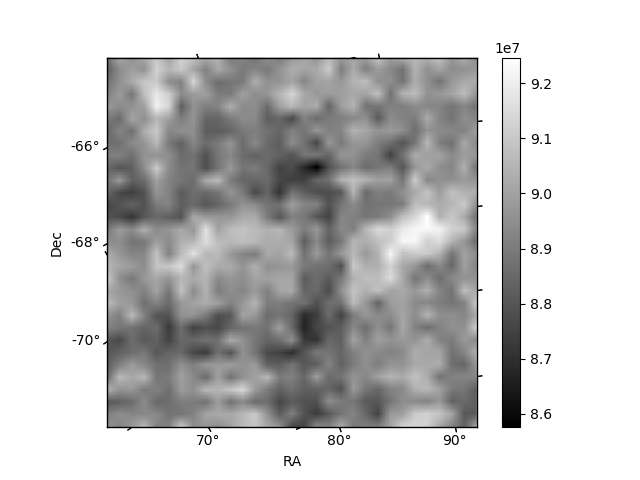
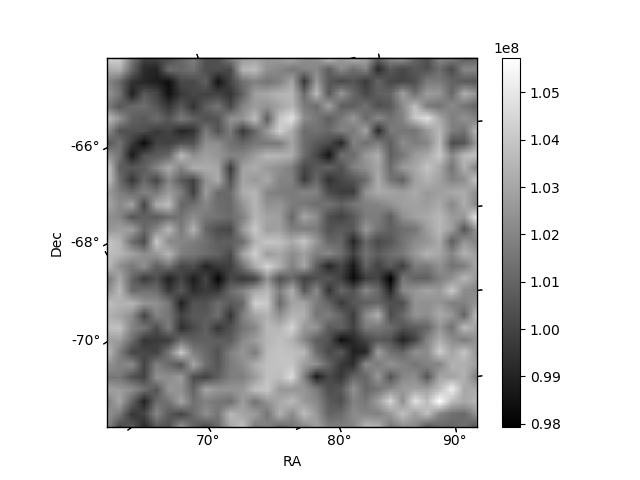
Histogram calculated using DETX and DETY for each event in the final _common_clean file
| Quadrant A |  |
 |
Quadrant B |
|---|---|---|---|
| Quadrant D |  |
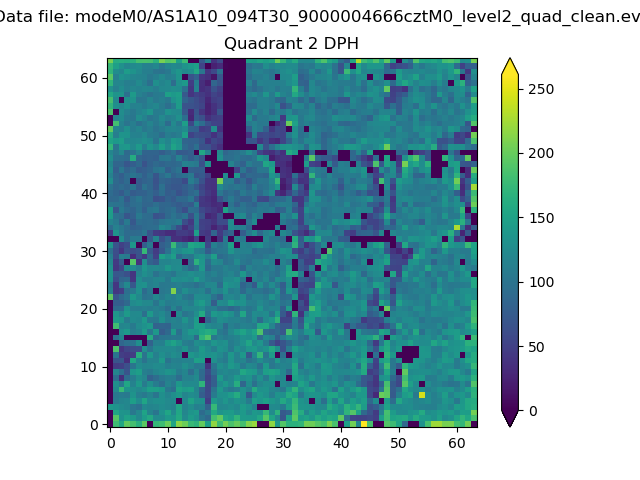 |
Quadrant C |
| Plot type | Count rate plots | Images |
|---|---|---|
| Comparison with Poisson distribution Blue bars denote a histogram of data divided into 1 sec bins. Red curve is a Poisson curve with rate = median count rate of data. |
 |
 |
| Quadrant-wise count rates Data is divided into 100 sec bins |
 |
|
| Module-wise count rates for Quadrant A Data is divided into 100 sec bins |
 |
 |
| Module-wise count rates for Quadrant B Data is divided into 100 sec bins |
 |
 |
| Module-wise count rates for Quadrant C Data is divided into 100 sec bins |
 |
 |
| Module-wise count rates for Quadrant D Data is divided into 100 sec bins |
 |
 |
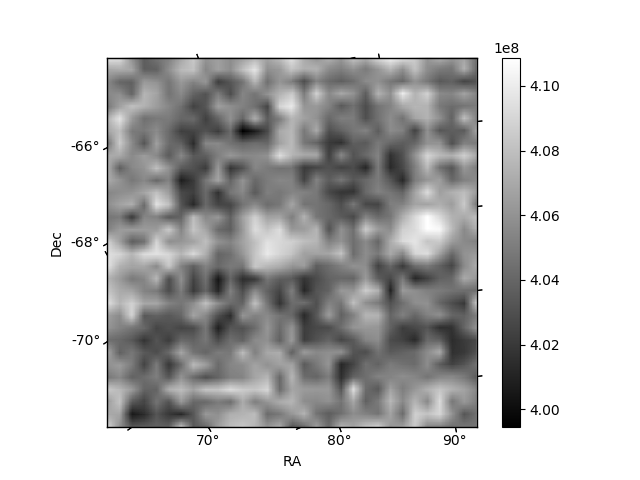
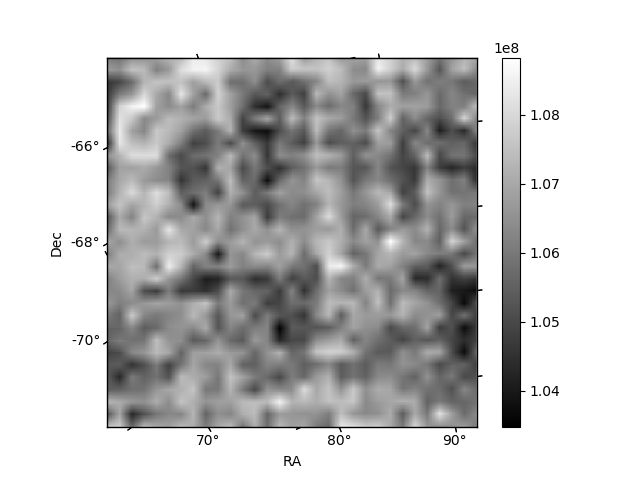
| Parameter | Plot |
|---|---|
| CZT HV Monitor |  |
| D_VDD | 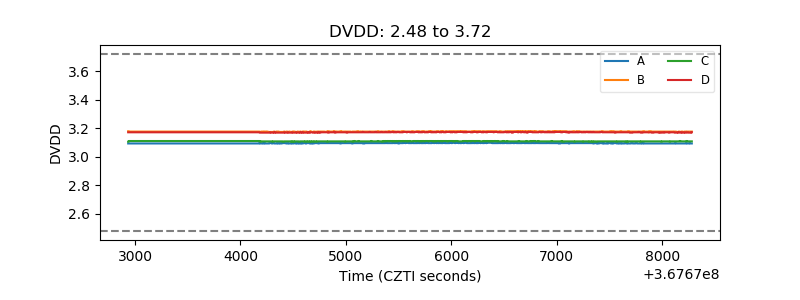 |
| Temperature 1 |  |
| Veto HV Monitor |  |
| Veto LLD |  |
| Alpha Counter | 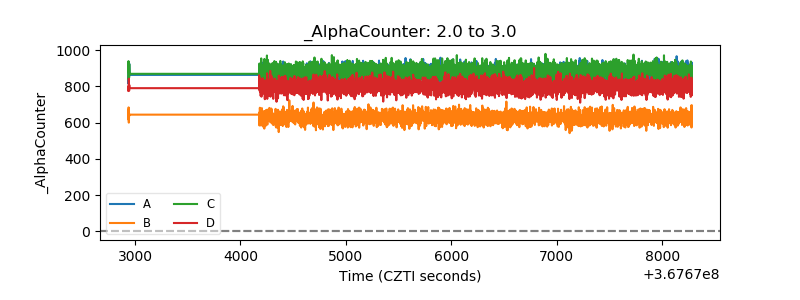 |
| _CPM_Rate |  |
| CZT Counter |  |
| +2.5 Volts monitor |  |
| +5 Volts monitor |  |
| _ROLL_ROT |  |
| _Roll_DEC |  |
| _Roll_RA |  |
| Veto Counter |  |