| Param | Original file | Final file |
|---|---|---|
| Filename | modeM0/AS1A10_094T30_9000004666_31965cztM0_level2.evt | modeM0/AS1A10_094T30_9000004666_31965cztM0_level2_quad_clean.evt |
| Size (bytes) | 67,507,200 | 2,805,120 |
| Size | 64.4 MB | 2.7 MB |
| Events in quadrant A | 380,905 | 4,753 |
| Events in quadrant B | 610,782 | 4,895 |
| Events in quadrant C | 472,378 | 4,556 |
| Events in quadrant D | 521,280 | 4,943 |
| Mode M0 | |||
|---|---|---|---|
| Quadrant | BADHDUFLAG | Total packets | Discarded packets |
| A | 0 | 1672 | 9 |
| B | 0 | 2492 | 17 |
| C | 0 | 1951 | 15 |
| D | 0 | 2084 | 26 |
| Mode SS | |||
|---|---|---|---|
| Quadrant | BADHDUFLAG | Total packets | Discarded packets |
| A | 0 | 17 | 1 |
| B | 0 | 16 | 0 |
| C | 0 | 16 | 0 |
| D | 0 | 16 | 0 |
| Quadrant | Total seconds | Saturated seconds | Saturation percentage |
|---|---|---|---|
| A | 828 | 0 | 0.000000% |
| B | 826 | 1 | 0.121065% |
| C | 826 | 4 | 0.484262% |
| D | 824 | 24 | 2.912621% |
Noise dominated data is calculated using 1-second bins in cleaned event files. If a bin has >2000 counts, and if more than 50% of those come from <1% of pixels, then it is considered to be noise-dominated and hence unusable.
| Quadrant | # 1 sec bins | Bins with >0 counts | Bins with >2000 counts | High rate bins dominated by noise | Noise dominated (total time) | Noise dominated (detector-on time) | Marked lightcurve |
|---|---|---|---|---|---|---|---|
| A | 1118 | 834 | 0 | 0 | 0.00% | 0.00% | 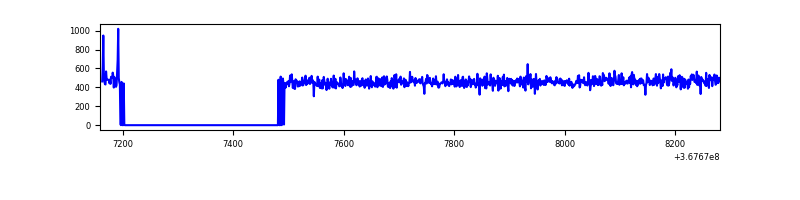 |
| B | 1122 | 833 | 0 | 0 | 0.00% | 0.00% | 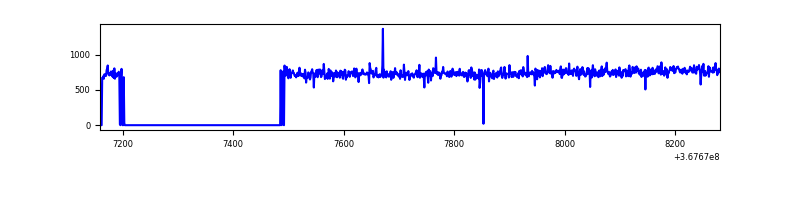 |
| C | 1122 | 831 | 0 | 0 | 0.00% | 0.00% | 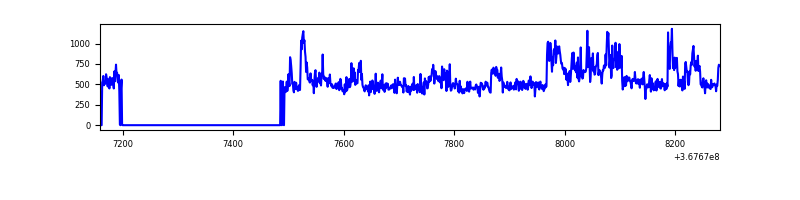 |
| D | 1121 | 831 | 23 | 23 | 2.05% | 2.77% | 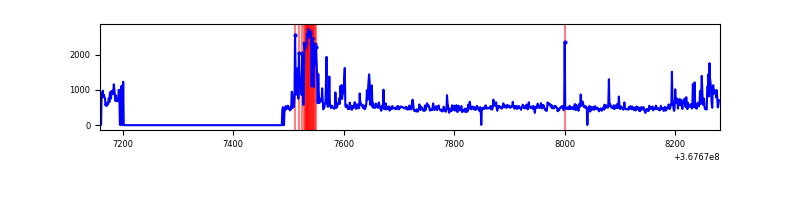 |
Top three noisy pixels from each quadrant. If the there are fewer than three noisy pixels in the level2.evt file, extra rows are filled as -1
| Pixel properties | Quadrant properties | ||||||
|---|---|---|---|---|---|---|---|
| Quadrant | DetID | PixID | Counts | Sigma | Mean | Median | Sigma |
| A | 14 | 238 | 2398 | 105.17 | 97 | 95 | 21.9 |
| A | 13 | 254 | 1579 | 67.77 | 97 | 95 | 21.9 |
| A | 12 | 96 | 1109 | 46.3 | 97 | 95 | 21.9 |
| B | 6 | 159 | 226996 | 11019.41 | 97 | 94 | 20.6 |
| B | 12 | 111 | 2339 | 109.03 | 97 | 94 | 20.6 |
| B | 11 | 111 | 2083 | 96.6 | 97 | 94 | 20.6 |
| C | 3 | 233 | 83117 | 3486.65 | 93 | 93 | 23.8 |
| C | 14 | 238 | 15198 | 634.34 | 93 | 93 | 23.8 |
| C | 0 | 10 | 7808 | 324.0 | 93 | 93 | 23.8 |
| D | 13 | 249 | 86313 | 3621.87 | 91 | 88 | 23.8 |
| D | 2 | 250 | 30180 | 1264.01 | 91 | 88 | 23.8 |
| D | 8 | 195 | 30106 | 1260.9 | 91 | 88 | 23.8 |
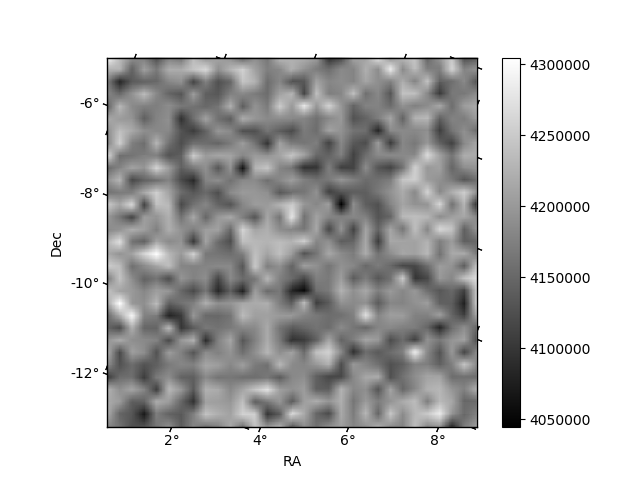
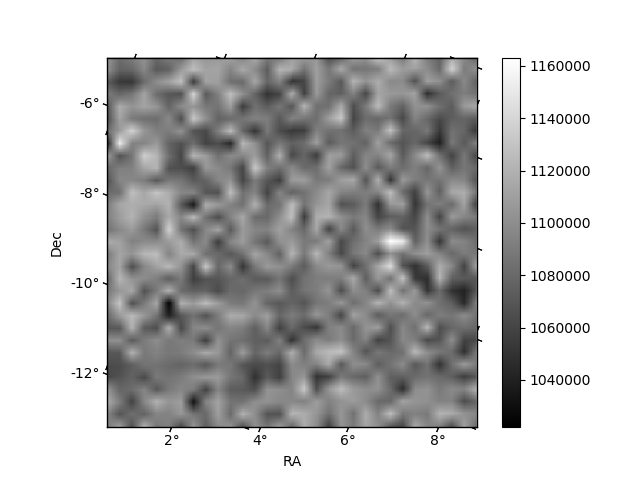
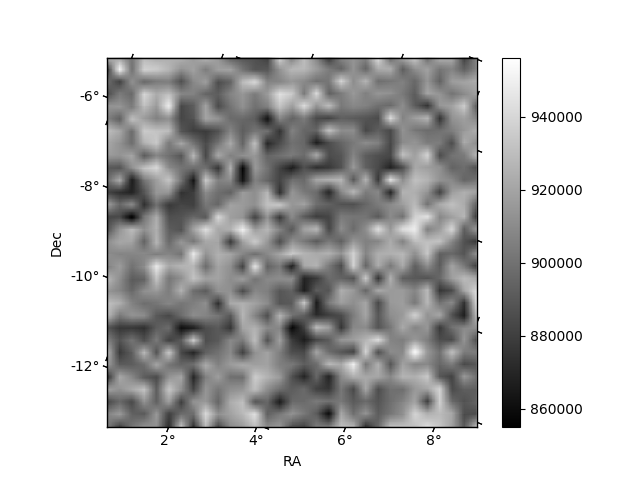
Histogram calculated using DETX and DETY for each event in the final _common_clean file
| Quadrant A | 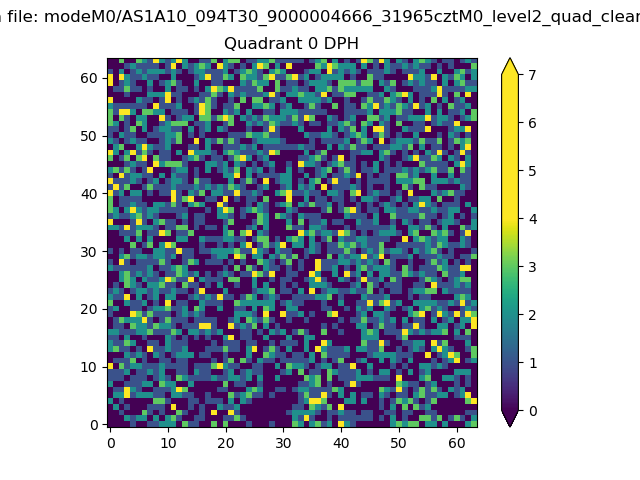 |
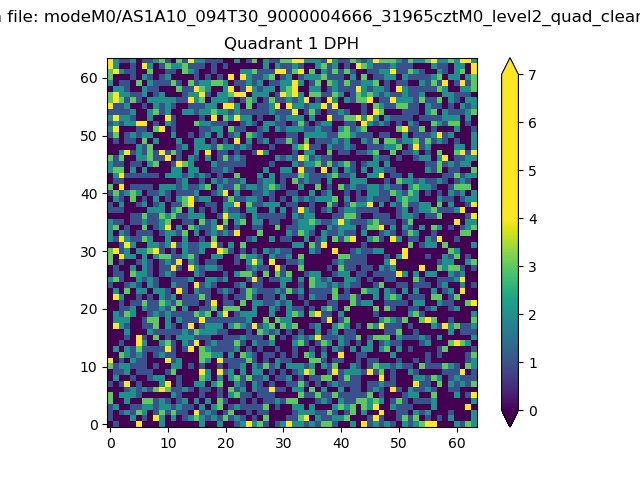 |
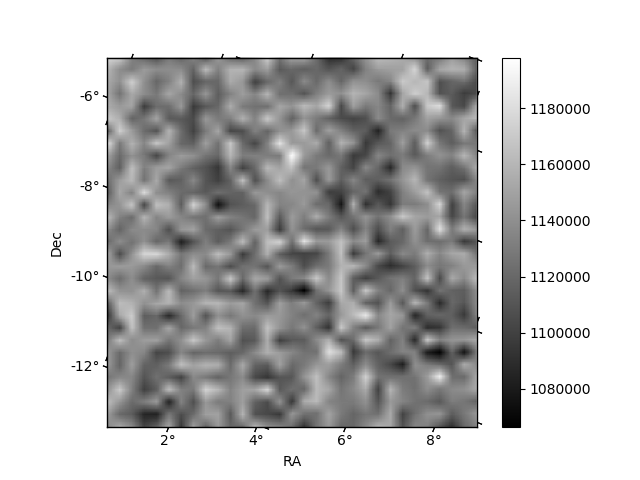
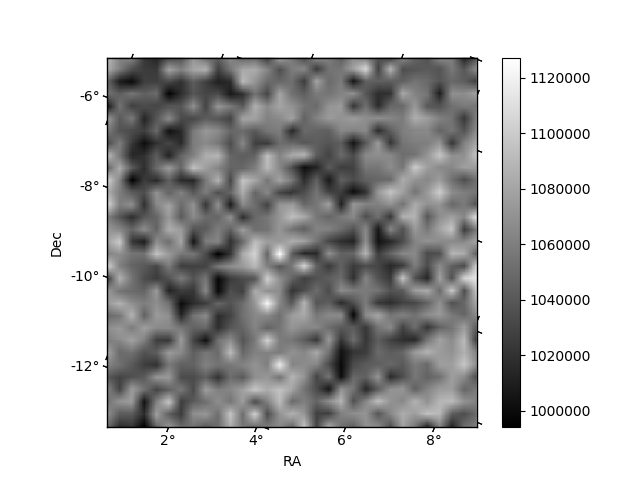
Quadrant B |
|---|---|---|---|
| Quadrant D | 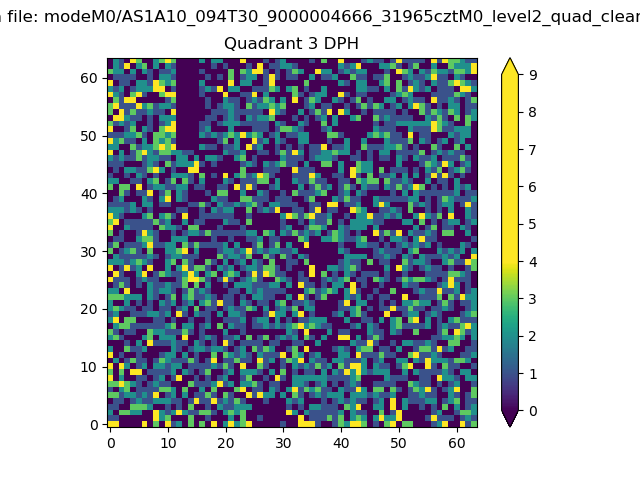 |
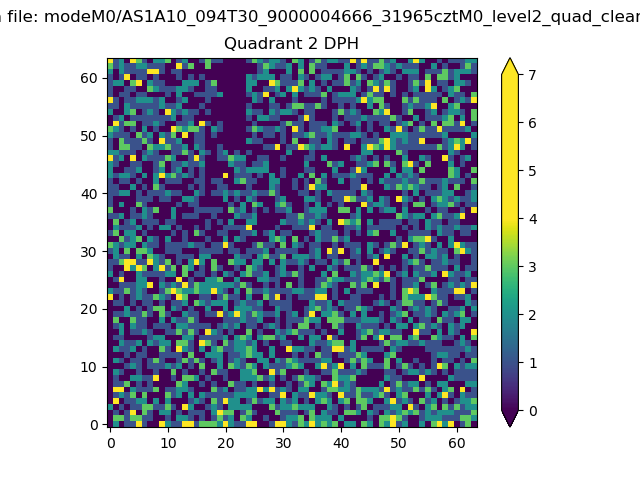 |
Quadrant C |
| Plot type | Count rate plots | Images |
|---|---|---|
| Comparison with Poisson distribution Blue bars denote a histogram of data divided into 1 sec bins. Red curve is a Poisson curve with rate = median count rate of data. |
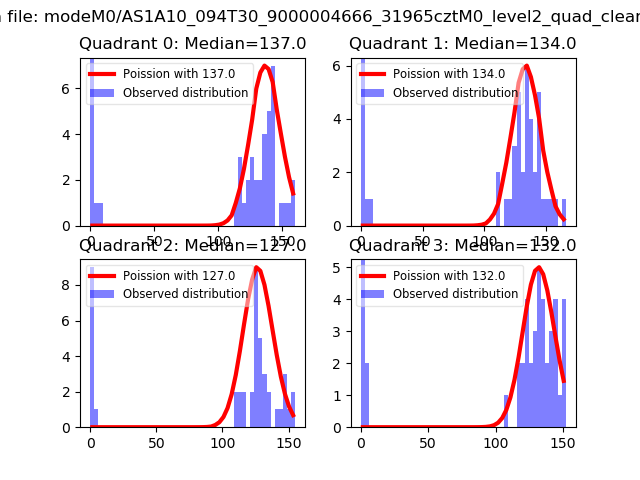 |
 |
| Quadrant-wise count rates Data is divided into 100 sec bins |
 |
|
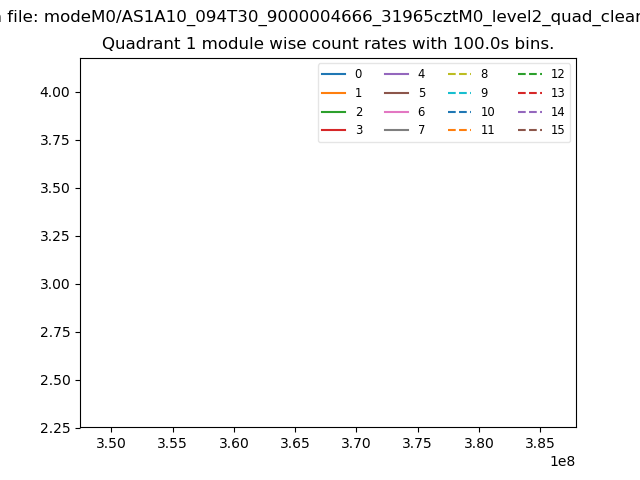
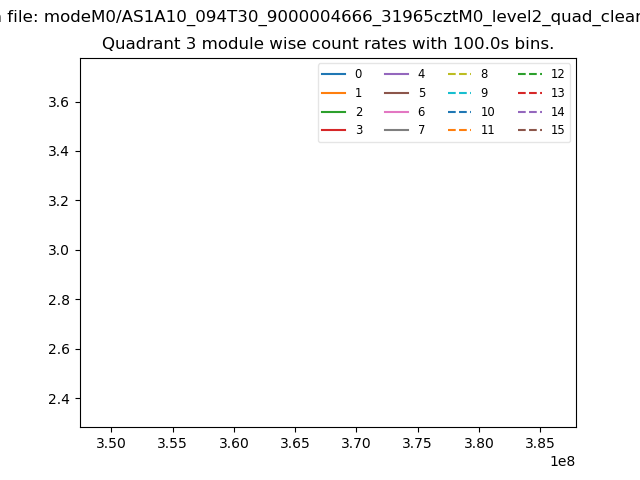
| Module-wise count rates for Quadrant A Data is divided into 100 sec bins |
 |
 |
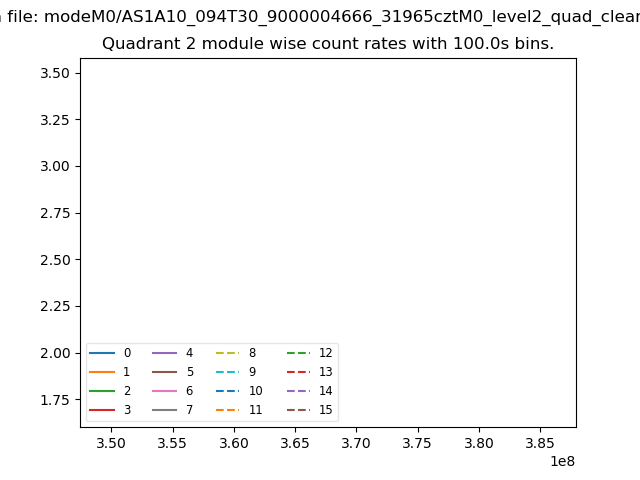
| Module-wise count rates for Quadrant B Data is divided into 100 sec bins |
 |
 |
| Module-wise count rates for Quadrant C Data is divided into 100 sec bins |
 |
 |
| Module-wise count rates for Quadrant D Data is divided into 100 sec bins |
 |
 |
| Parameter | Plot |
|---|---|
| CZT HV Monitor | 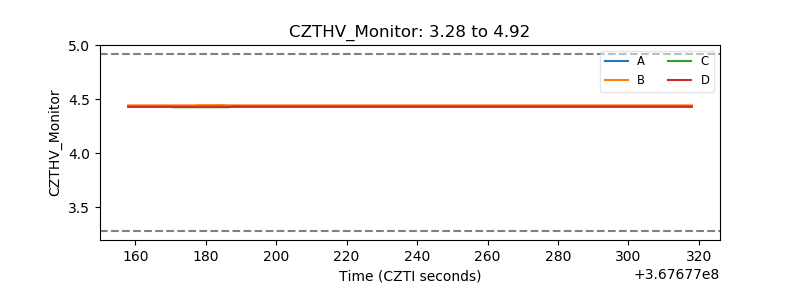 |
| D_VDD | 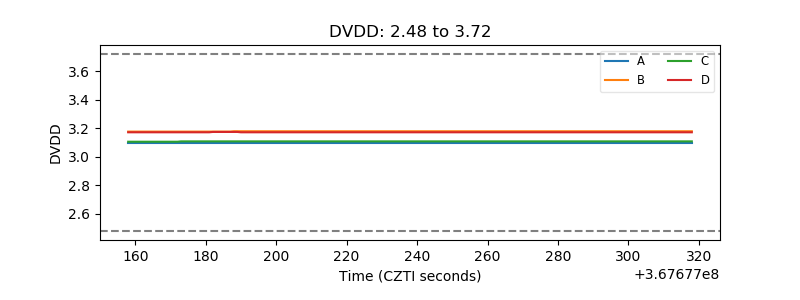 |
| Temperature 1 | 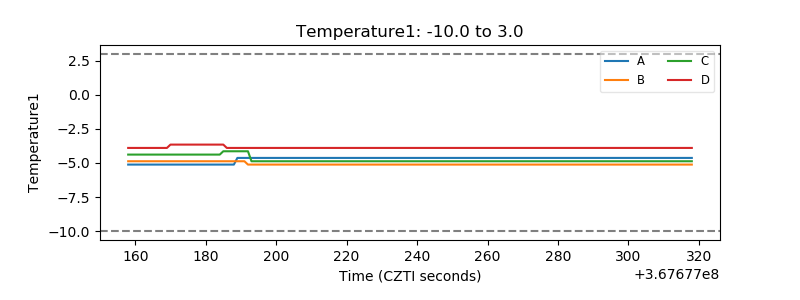 |
| Veto HV Monitor | 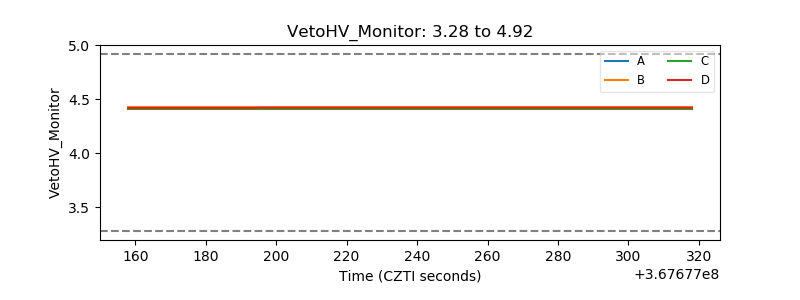 |
| Veto LLD | 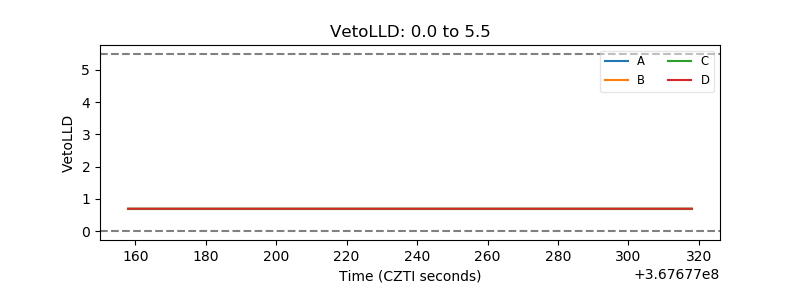 |
| Alpha Counter | 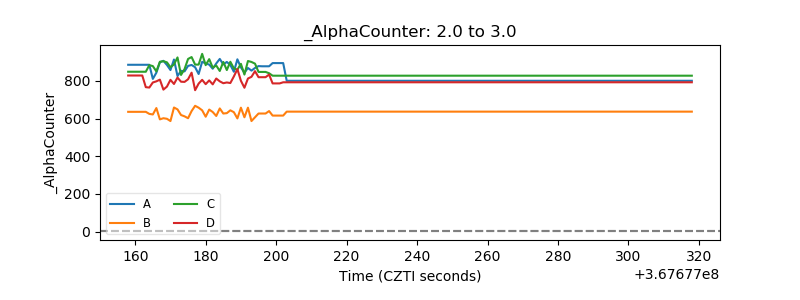 |
| _CPM_Rate | 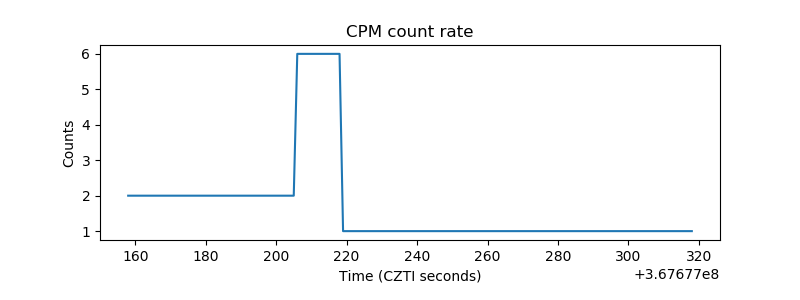 |
| CZT Counter | 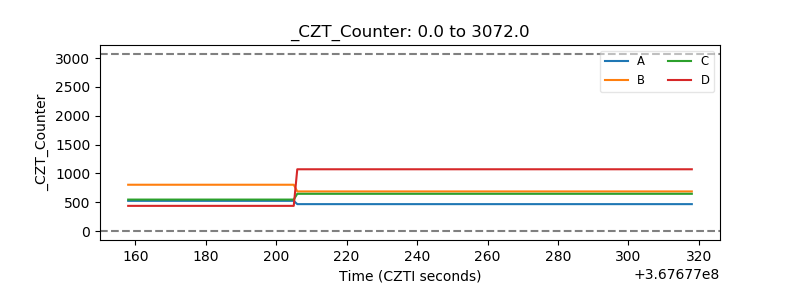 |
| +2.5 Volts monitor |  |
| +5 Volts monitor |  |
| _ROLL_ROT | 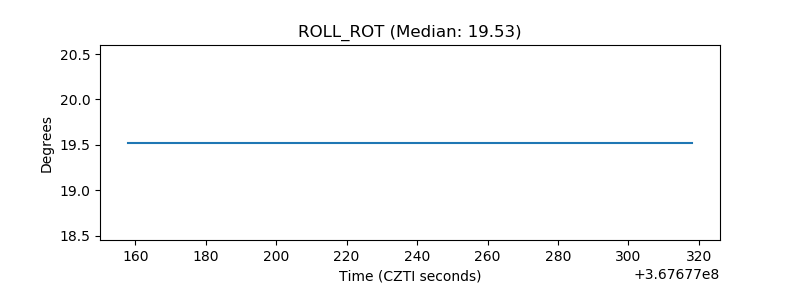 |
| _Roll_DEC | 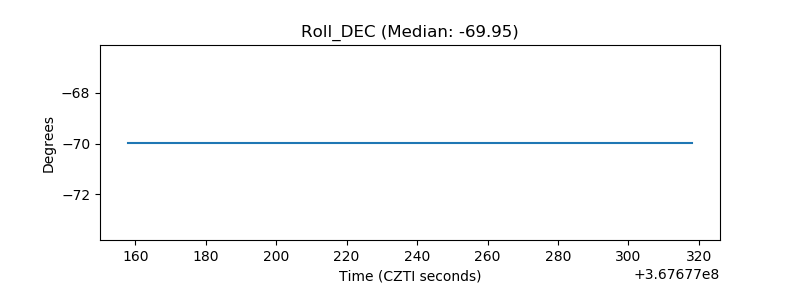 |
| _Roll_RA | 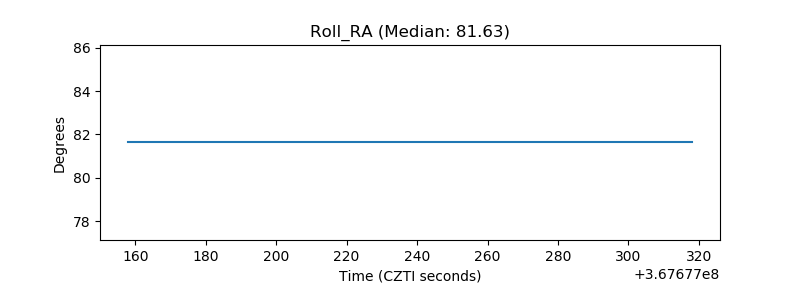 |
| Veto Counter | 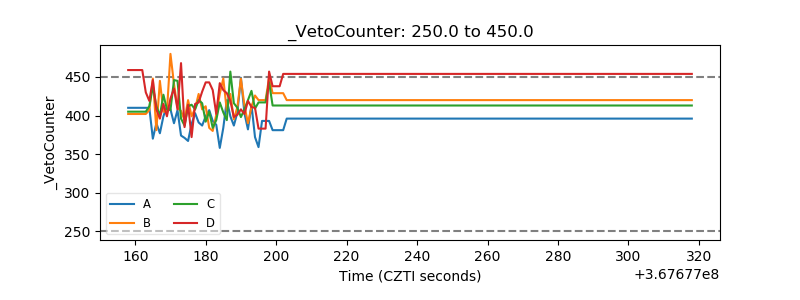 |