| Param | Original file | Final file |
|---|---|---|
| Filename | modeM0/AS1A10_094T33_9000004664cztM0_level2.fits | modeM0/AS1A10_094T33_9000004664cztM0_level2_quad_clean.evt |
| Size (bytes) | 52,159,680 | 31,435,200 |
| Size | 49.7 MB | 30.0 MB |
| Events in quadrant A | 341,432 | 163,411 |
| Events in quadrant B | 307,726 | 159,642 |
| Events in quadrant C | 315,750 | 155,275 |
| Events in quadrant D | 286,396 | 143,872 |
| Mode M9 | |||
|---|---|---|---|
| Quadrant | BADHDUFLAG | Total packets | Discarded packets |
| A | 0 | 13 | 0 |
| B | 0 | 13 | 0 |
| C | 0 | 13 | 0 |
| D | 0 | 13 | 0 |
| Mode SS | |||
|---|---|---|---|
| Quadrant | BADHDUFLAG | Total packets | Discarded packets |
| A | 0 | 96 | 0 |
| B | 0 | 96 | 0 |
| C | 0 | 96 | 0 |
| D | 0 | 96 | 0 |
| Mode M0 | |||
|---|---|---|---|
| Quadrant | BADHDUFLAG | Total packets | Discarded packets |
| A | 0 | 9936 | 0 |
| B | 0 | 14454 | 0 |
| C | 0 | 11184 | 0 |
| D | 0 | 13822 | 0 |
| Quadrant | Total seconds | Saturated seconds | Saturation percentage |
|---|---|---|---|
| A | 4676 | 31 | 0.662960% |
| B | 4676 | 81 | 1.732250% |
| C | 4676 | 157 | 3.357571% |
| D | 4675 | 93 | 1.989305% |
Noise dominated data is calculated using 1-second bins in cleaned event files. If a bin has >2000 counts, and if more than 50% of those come from <1% of pixels, then it is considered to be noise-dominated and hence unusable.
| Quadrant | # 1 sec bins | Bins with >0 counts | Bins with >2000 counts | High rate bins dominated by noise | Noise dominated (total time) | Noise dominated (detector-on time) | Marked lightcurve |
|---|---|---|---|---|---|---|---|
| A | 5981 | 4675 | 0 | 0 | 0.00% | 0.00% |  |
| B | 5981 | 4675 | 0 | 0 | 0.00% | 0.00% |  |
| C | 5981 | 4675 | 0 | 0 | 0.00% | 0.00% |  |
| D | 5981 | 4674 | 0 | 0 | 0.00% | 0.00% |  |
Top three noisy pixels from each quadrant. If the there are fewer than three noisy pixels in the level2.evt file, extra rows are filled as -1
| Pixel properties | Quadrant properties | ||||||
|---|---|---|---|---|---|---|---|
| Quadrant | DetID | PixID | Counts | Sigma | Mean | Median | Sigma |
| A | 0 | 29 | 315 | 9.86 | 89 | 85 | 23.3 |
| A | 7 | 110 | 260 | 7.51 | 89 | 85 | 23.3 |
| A | 9 | 19 | 251 | 7.12 | 89 | 85 | 23.3 |
| B | 2 | 9 | 210 | 7.14 | 81 | 78 | 18.5 |
| B | 2 | 8 | 198 | 6.49 | 81 | 78 | 18.5 |
| B | 14 | 254 | 194 | 6.28 | 81 | 78 | 18.5 |
| C | 3 | 202 | 263 | 8.04 | 83 | 79 | 22.9 |
| C | 1 | 81 | 263 | 8.04 | 83 | 79 | 22.9 |
| C | 3 | 203 | 261 | 7.95 | 83 | 79 | 22.9 |
| D | 6 | 67 | 231 | 6.65 | 82 | 75 | 23.5 |
| D | 10 | 189 | 205 | 5.54 | 82 | 75 | 23.5 |
| D | 10 | 113 | 203 | 5.46 | 82 | 75 | 23.5 |
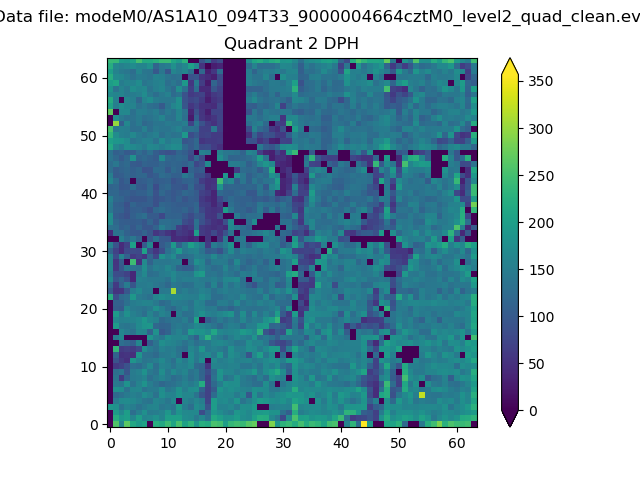
Histogram calculated using DETX and DETY for each event in the final _common_clean file
| Quadrant A |  |
 |
Quadrant B |
|---|---|---|---|
| Quadrant D |  |
 |
Quadrant C |
| Plot type | Count rate plots | Images |
|---|---|---|
| Comparison with Poisson distribution Blue bars denote a histogram of data divided into 1 sec bins. Red curve is a Poisson curve with rate = median count rate of data. |
 |
 |
| Quadrant-wise count rates Data is divided into 100 sec bins |
 |
|
| Module-wise count rates for Quadrant A Data is divided into 100 sec bins |
 |
 |
| Module-wise count rates for Quadrant B Data is divided into 100 sec bins |
 |
 |
| Module-wise count rates for Quadrant C Data is divided into 100 sec bins |
 |
 |
| Module-wise count rates for Quadrant D Data is divided into 100 sec bins |
 |
 |
| Parameter | Plot |
|---|---|
| CZT HV Monitor |  |
| D_VDD |  |
| Temperature 1 |  |
| Veto HV Monitor |  |
| Veto LLD |  |
| Alpha Counter |  |
| _CPM_Rate |  |
| CZT Counter |  |
| +2.5 Volts monitor |  |
| +5 Volts monitor |  |
| _ROLL_ROT |  |
| _Roll_DEC |  |
| _Roll_RA |  |
| Veto Counter |  |