| Param | Original file | Final file |
|---|---|---|
| Filename | modeM0/AS1A10_094T33_9000004664_31961cztM0_level2.evt | modeM0/AS1A10_094T33_9000004664_31961cztM0_level2_quad_clean.evt |
| Size (bytes) | 171,720,000 | 44,150,400 |
| Size | 163.8 MB | 42.1 MB |
| Events in quadrant A | 1,033,700 | 311,842 |
| Events in quadrant B | 1,497,799 | 307,543 |
| Events in quadrant C | 1,296,000 | 291,462 |
| Events in quadrant D | 1,248,272 | 293,823 |
| Mode M9 | |||
|---|---|---|---|
| Quadrant | BADHDUFLAG | Total packets | Discarded packets |
| A | 0 | 13 | 0 |
| B | 0 | 13 | 0 |
| C | 0 | 13 | 0 |
| D | 0 | 13 | 0 |
| Mode SS | |||
|---|---|---|---|
| Quadrant | BADHDUFLAG | Total packets | Discarded packets |
| A | 0 | 38 | 0 |
| B | 0 | 38 | 0 |
| C | 0 | 38 | 0 |
| D | 0 | 38 | 0 |
| Mode M0 | |||
|---|---|---|---|
| Quadrant | BADHDUFLAG | Total packets | Discarded packets |
| A | 0 | 4162 | 1 |
| B | 0 | 5581 | 1 |
| C | 0 | 5063 | 2 |
| D | 0 | 5112 | 3 |
| Quadrant | Total seconds | Saturated seconds | Saturation percentage |
|---|---|---|---|
| A | 1807 | 31 | 1.715551% |
| B | 1807 | 50 | 2.767017% |
| C | 1806 | 145 | 8.028793% |
| D | 1805 | 38 | 2.105263% |
Noise dominated data is calculated using 1-second bins in cleaned event files. If a bin has >2000 counts, and if more than 50% of those come from <1% of pixels, then it is considered to be noise-dominated and hence unusable.
| Quadrant | # 1 sec bins | Bins with >0 counts | Bins with >2000 counts | High rate bins dominated by noise | Noise dominated (total time) | Noise dominated (detector-on time) | Marked lightcurve |
|---|---|---|---|---|---|---|---|
| A | 3112 | 1807 | 0 | 0 | 0.00% | 0.00% | 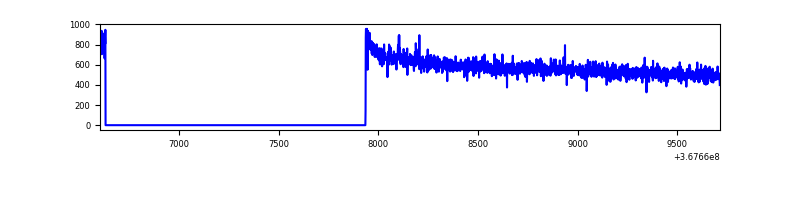 |
| B | 3112 | 1807 | 0 | 0 | 0.00% | 0.00% | 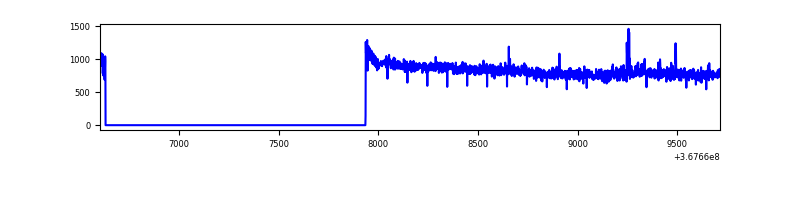 |
| C | 3111 | 1806 | 45 | 45 | 1.45% | 2.49% | 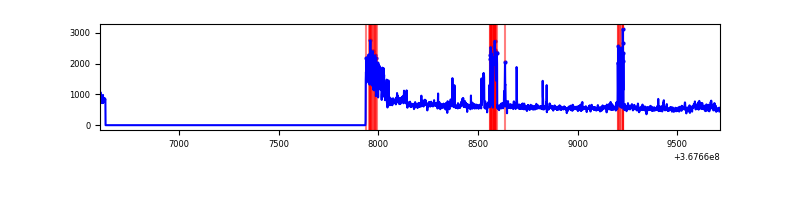 |
| D | 3111 | 1806 | 3 | 3 | 0.10% | 0.17% | 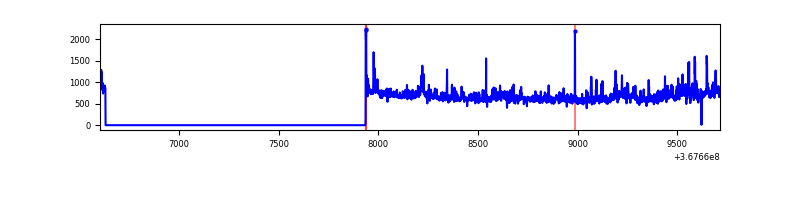 |
Top three noisy pixels from each quadrant. If the there are fewer than three noisy pixels in the level2.evt file, extra rows are filled as -1
| Pixel properties | Quadrant properties | ||||||
|---|---|---|---|---|---|---|---|
| Quadrant | DetID | PixID | Counts | Sigma | Mean | Median | Sigma |
| A | 14 | 238 | 4851 | 85.41 | 266 | 262 | 53.7 |
| A | 13 | 254 | 3358 | 57.62 | 266 | 262 | 53.7 |
| A | 13 | 6 | 3195 | 54.59 | 266 | 262 | 53.7 |
| B | 6 | 159 | 478058 | 9869.14 | 255 | 250 | 48.4 |
| B | 0 | 190 | 9517 | 191.41 | 255 | 250 | 48.4 |
| B | 0 | 156 | 6832 | 135.95 | 255 | 250 | 48.4 |
| C | 0 | 10 | 233502 | 4025.88 | 247 | 249 | 57.9 |
| C | 3 | 233 | 45374 | 778.84 | 247 | 249 | 57.9 |
| C | 14 | 238 | 40403 | 693.05 | 247 | 249 | 57.9 |
| D | 8 | 195 | 182821 | 2932.71 | 261 | 255 | 62.3 |
| D | 2 | 250 | 23612 | 375.2 | 261 | 255 | 62.3 |
| D | 12 | 233 | 13983 | 220.52 | 261 | 255 | 62.3 |
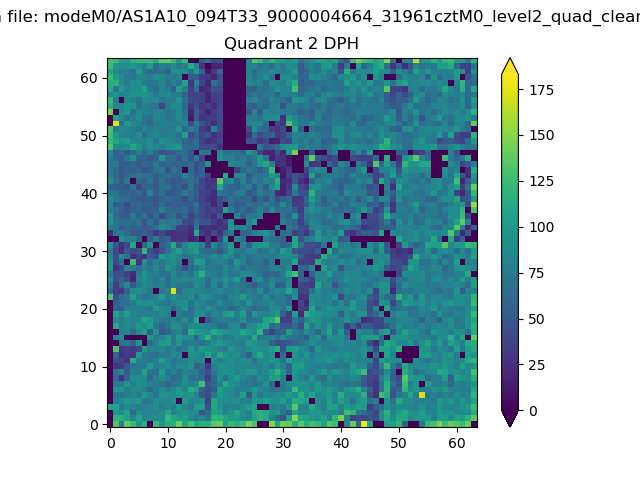
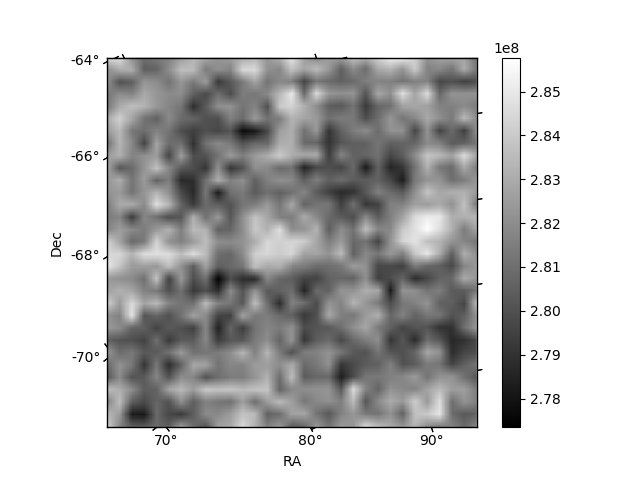
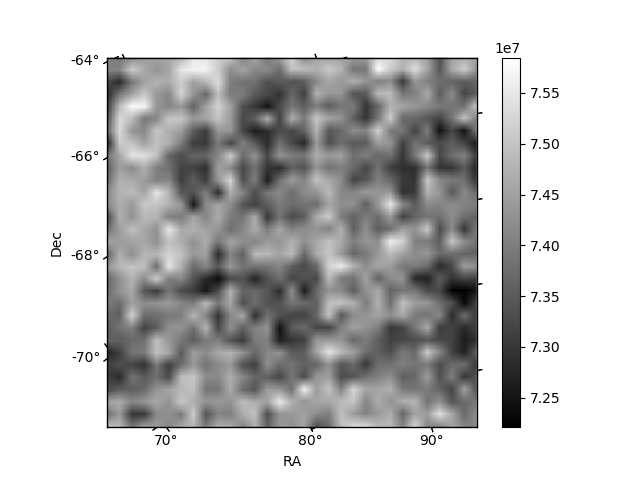
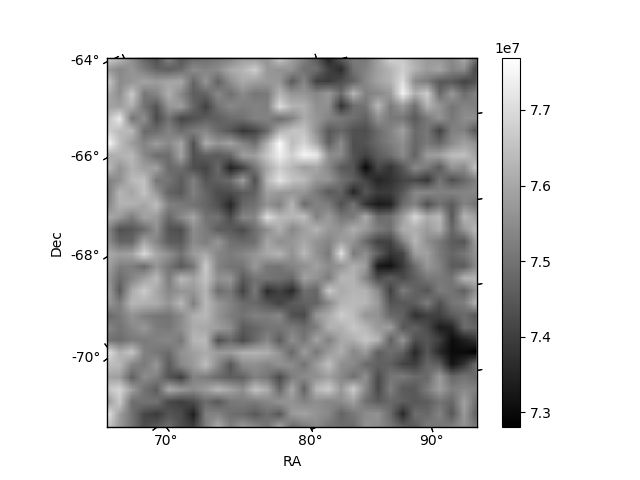
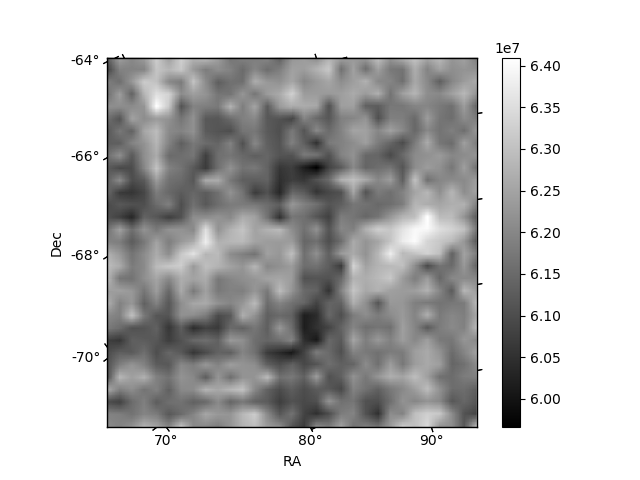
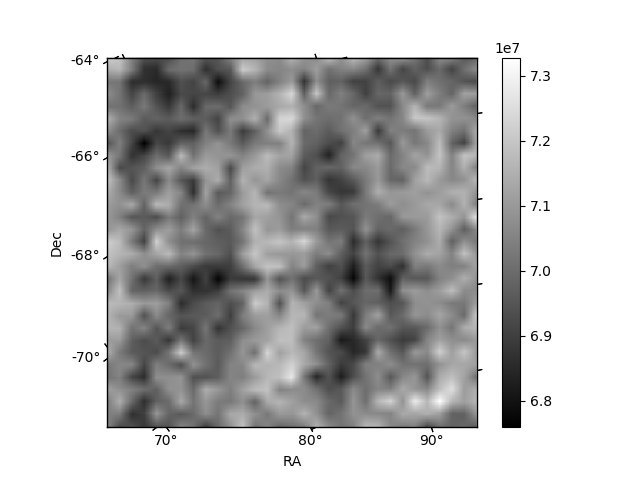
Histogram calculated using DETX and DETY for each event in the final _common_clean file
| Quadrant A | 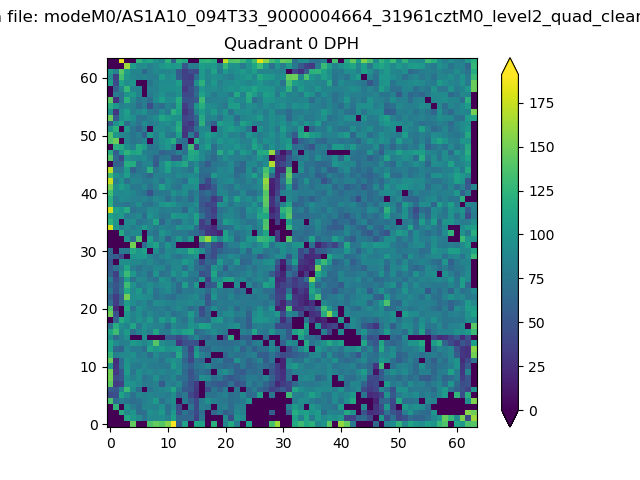 |
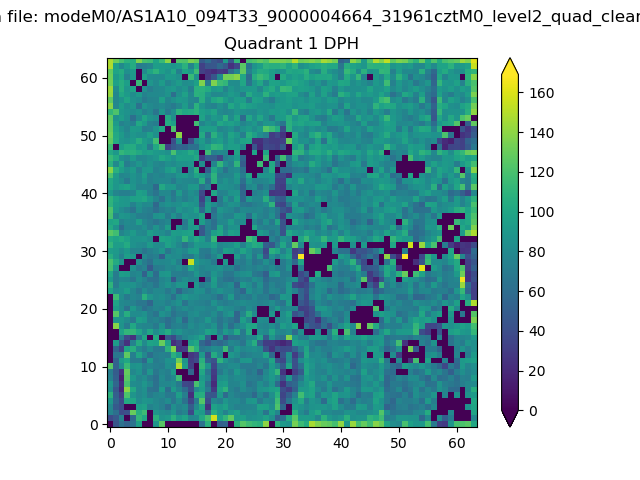 |
Quadrant B |
|---|---|---|---|
| Quadrant D | 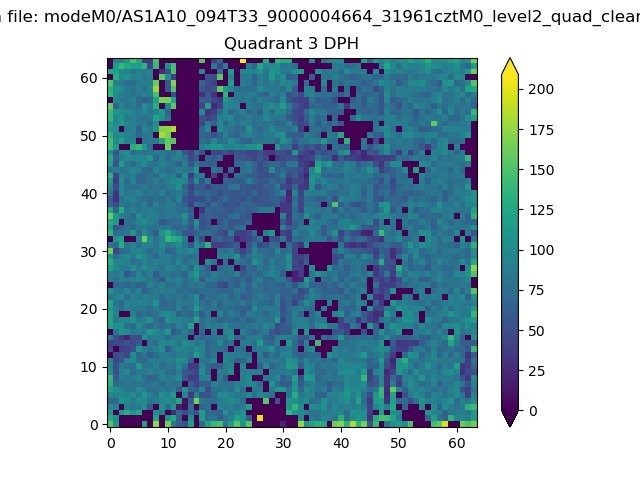 |
 |
Quadrant C |
| Plot type | Count rate plots | Images |
|---|---|---|
| Comparison with Poisson distribution Blue bars denote a histogram of data divided into 1 sec bins. Red curve is a Poisson curve with rate = median count rate of data. |
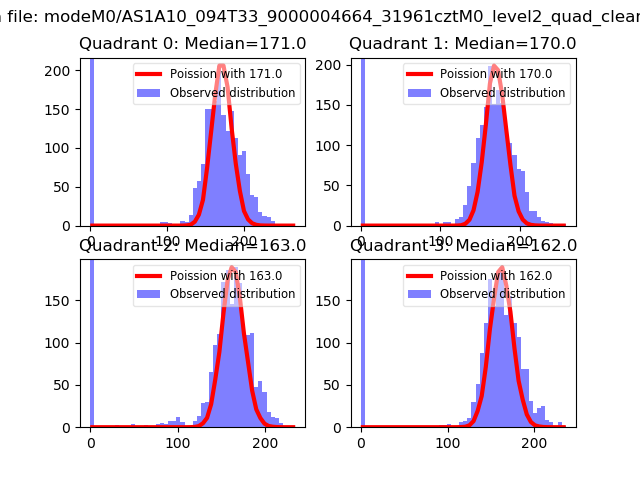 |
 |
| Quadrant-wise count rates Data is divided into 100 sec bins |
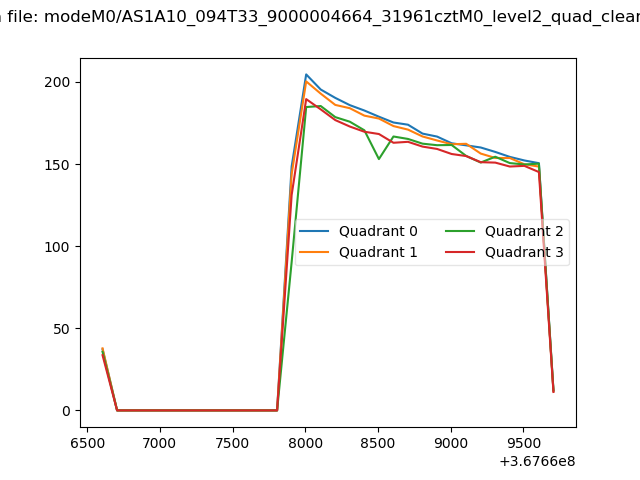 |
|
| Module-wise count rates for Quadrant A Data is divided into 100 sec bins |
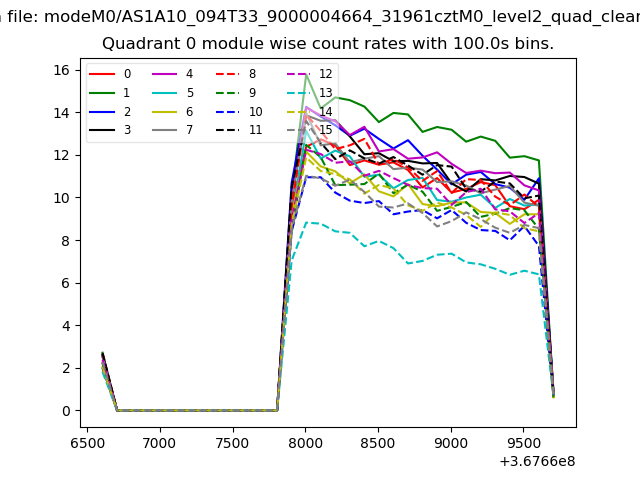 |
 |
| Module-wise count rates for Quadrant B Data is divided into 100 sec bins |
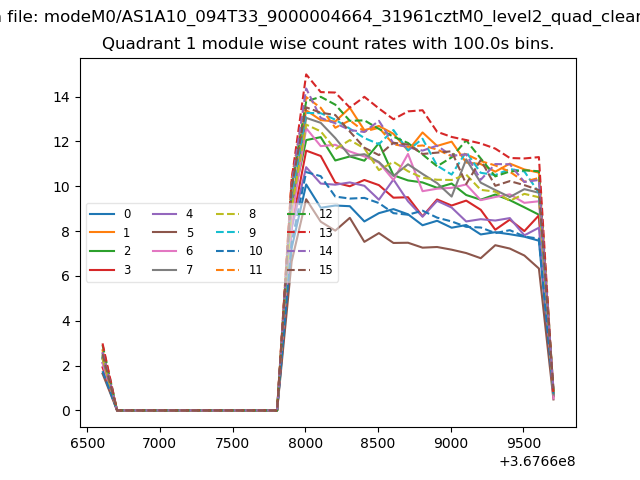 |
 |
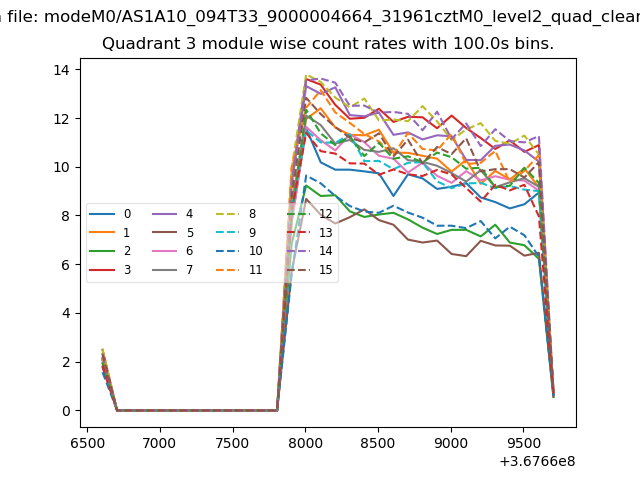
| Module-wise count rates for Quadrant C Data is divided into 100 sec bins |
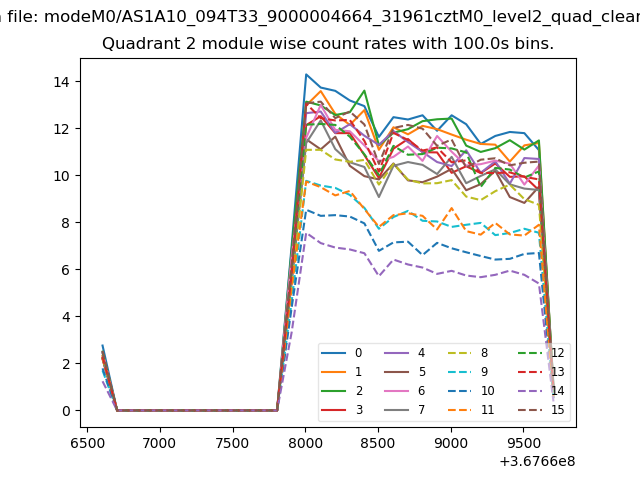 |
 |
| Module-wise count rates for Quadrant D Data is divided into 100 sec bins |
 |
 |
| Parameter | Plot |
|---|---|
| CZT HV Monitor | 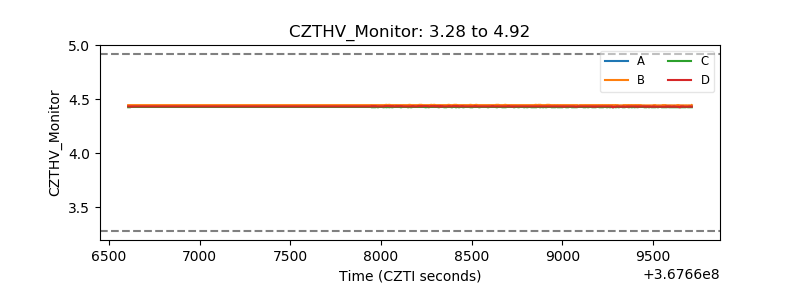 |
| D_VDD | 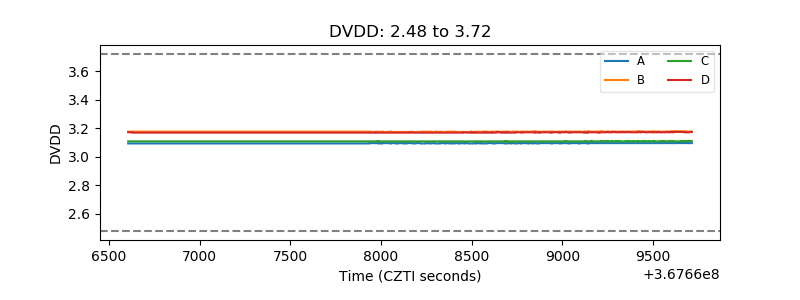 |
| Temperature 1 | 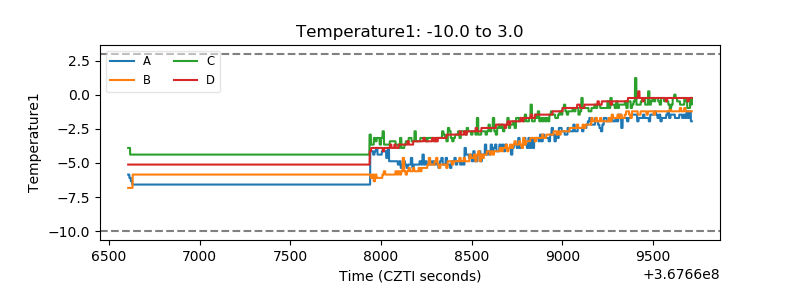 |
| Veto HV Monitor | 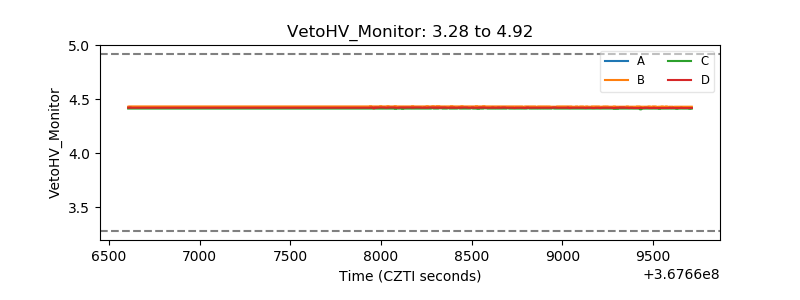 |
| Veto LLD | 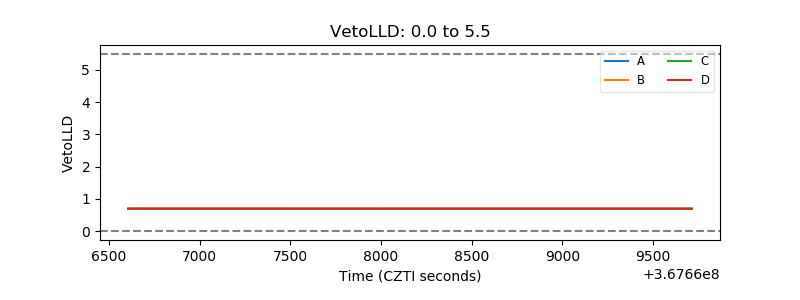 |
| Alpha Counter | 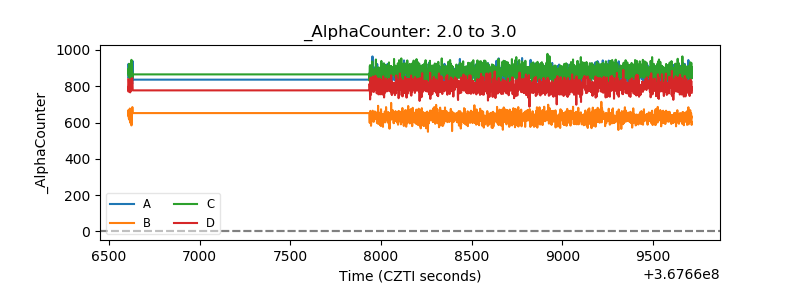 |
| _CPM_Rate | 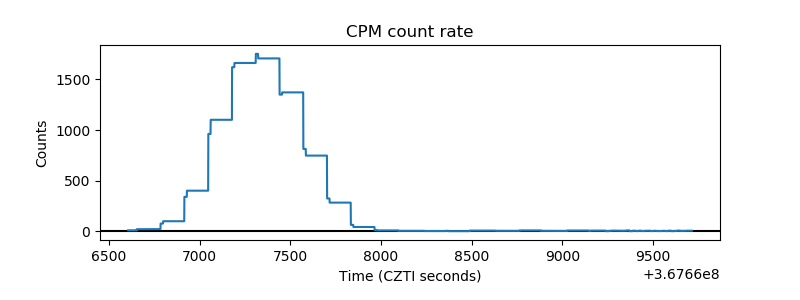 |
| CZT Counter | 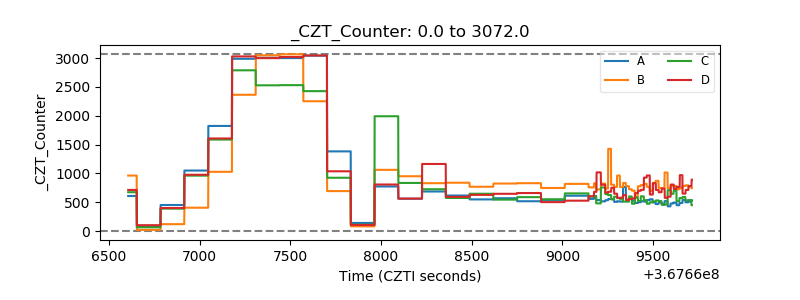 |
| +2.5 Volts monitor |  |
| +5 Volts monitor |  |
| _ROLL_ROT | 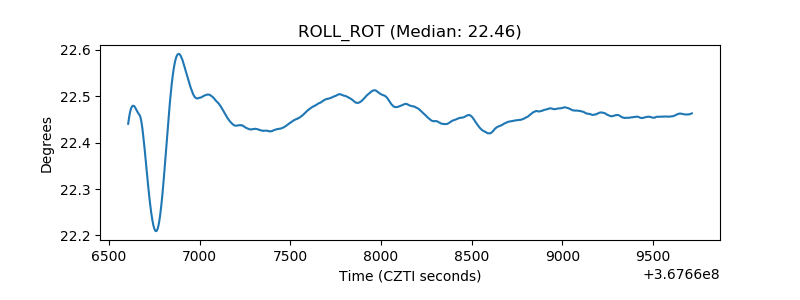 |
| _Roll_DEC | 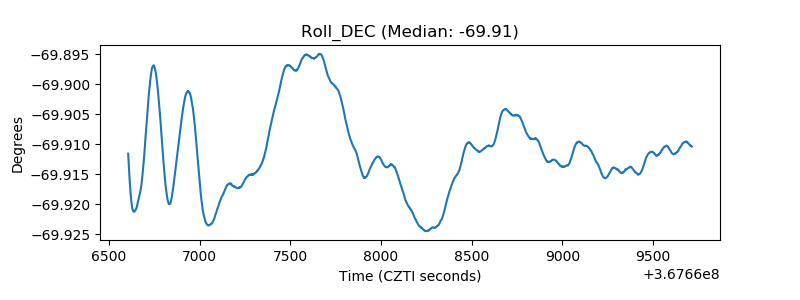 |
| _Roll_RA | 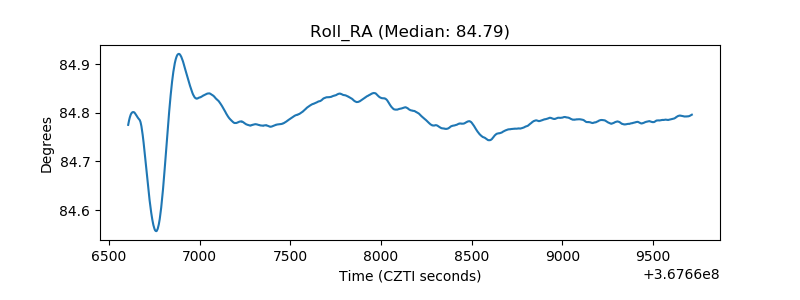 |
| Veto Counter | 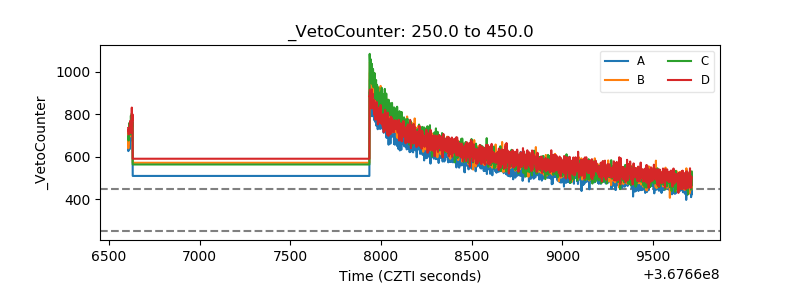 |